| Param | Original file | Final file |
|---|---|---|
| Filename | modeM0/AS1A10_045T08_9000004208_29271cztM0_level2.evt | modeM0/AS1A10_045T08_9000004208_29271cztM0_level2_quad_clean.evt |
| Size (bytes) | 548,521,920 | 81,426,240 |
| Size | 523.1 MB | 77.7 MB |
| Events in quadrant A | 3,160,738 | 509,467 |
| Events in quadrant B | 3,585,102 | 515,575 |
| Events in quadrant C | 4,916,482 | 500,143 |
| Events in quadrant D | 4,517,940 | 495,916 |
| Mode SS | |||
|---|---|---|---|
| Quadrant | BADHDUFLAG | Total packets | Discarded packets |
| A | 0 | 130 | 0 |
| B | 0 | 130 | 0 |
| C | 0 | 130 | 0 |
| D | 0 | 130 | 0 |
| Mode M0 | |||
|---|---|---|---|
| Quadrant | BADHDUFLAG | Total packets | Discarded packets |
| A | 0 | 13247 | 1 |
| B | 0 | 14605 | 1 |
| C | 0 | 19190 | 1 |
| D | 0 | 17735 | 1 |
| Mode M9 | |||
|---|---|---|---|
| Quadrant | BADHDUFLAG | Total packets | Discarded packets |
| A | 0 | 9 | 0 |
| B | 0 | 9 | 0 |
| C | 0 | 9 | 0 |
| D | 0 | 9 | 0 |
| Quadrant | Total seconds | Saturated seconds | Saturation percentage |
|---|---|---|---|
| A | 6370 | 72 | 1.130298% |
| B | 6371 | 151 | 2.370115% |
| C | 6371 | 301 | 4.724533% |
| D | 6371 | 225 | 3.531628% |
Noise dominated data is calculated using 1-second bins in cleaned event files. If a bin has >2000 counts, and if more than 50% of those come from <1% of pixels, then it is considered to be noise-dominated and hence unusable.
| Quadrant | # 1 sec bins | Bins with >0 counts | Bins with >2000 counts | High rate bins dominated by noise | Noise dominated (total time) | Noise dominated (detector-on time) | Marked lightcurve |
|---|---|---|---|---|---|---|---|
| A | 7225 | 6371 | 3 | 3 | 0.04% | 0.05% | 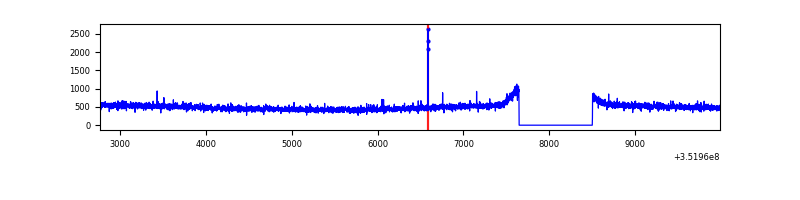 |
| B | 7226 | 6372 | 23 | 23 | 0.32% | 0.36% |  |
| C | 7226 | 6372 | 32 | 32 | 0.44% | 0.50% | 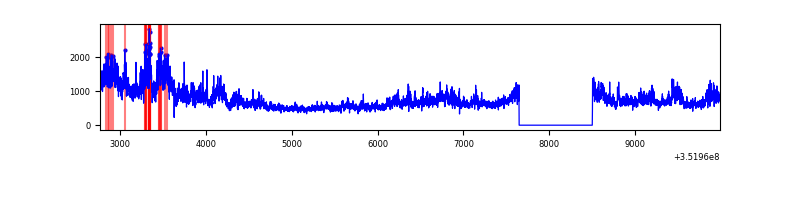 |
| D | 7226 | 6372 | 133 | 133 | 1.84% | 2.09% | 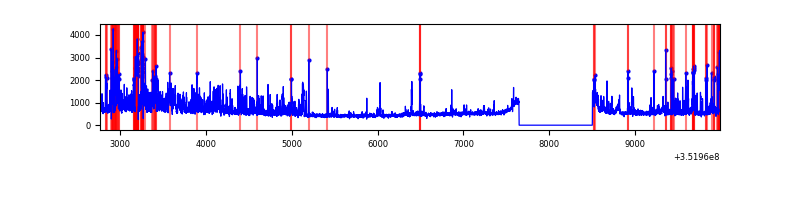 |
Top three noisy pixels from each quadrant. If the there are fewer than three noisy pixels in the level2.evt file, extra rows are filled as -1
| Pixel properties | Quadrant properties | ||||||
|---|---|---|---|---|---|---|---|
| Quadrant | DetID | PixID | Counts | Sigma | Mean | Median | Sigma |
| A | 13 | 254 | 11934 | 68.0 | 816 | 801 | 163.7 |
| A | 5 | 168 | 9738 | 54.59 | 816 | 801 | 163.7 |
| A | 3 | 137 | 7785 | 42.66 | 816 | 801 | 163.7 |
| B | 0 | 229 | 249226 | 1608.5 | 807 | 786 | 154.5 |
| B | 10 | 245 | 101748 | 653.67 | 807 | 786 | 154.5 |
| B | 0 | 183 | 47710 | 303.81 | 807 | 786 | 154.5 |
| C | 3 | 233 | 1603442 | 8765.74 | 780 | 786 | 182.8 |
| C | 14 | 238 | 134944 | 733.78 | 780 | 786 | 182.8 |
| C | 7 | 247 | 107114 | 581.56 | 780 | 786 | 182.8 |
| D | 8 | 195 | 680059 | 3581.82 | 789 | 771 | 189.6 |
| D | 1 | 52 | 610652 | 3215.84 | 789 | 771 | 189.6 |
| D | 13 | 153 | 133203 | 698.3 | 789 | 771 | 189.6 |
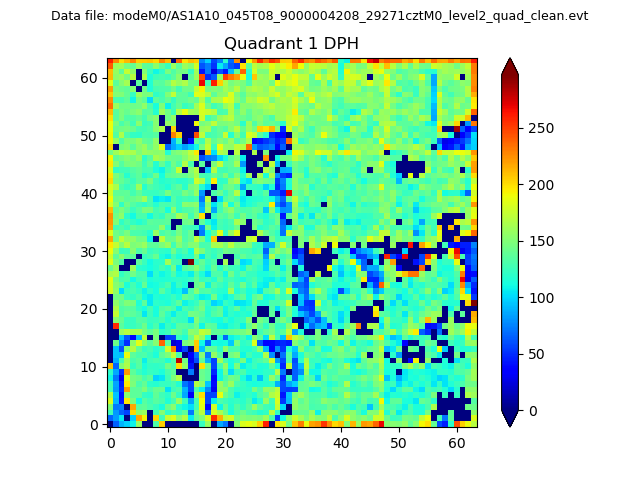
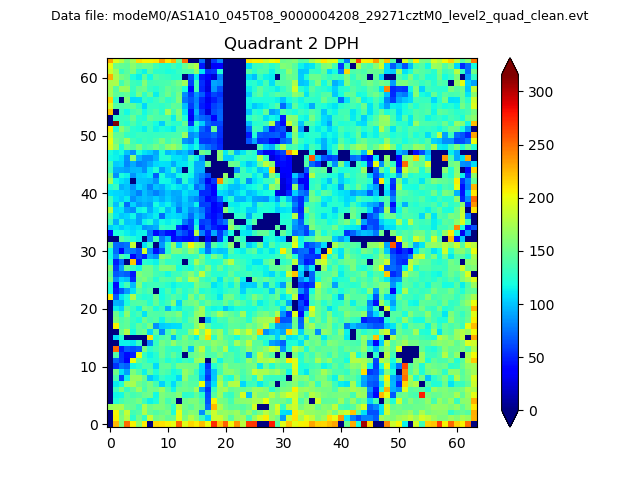
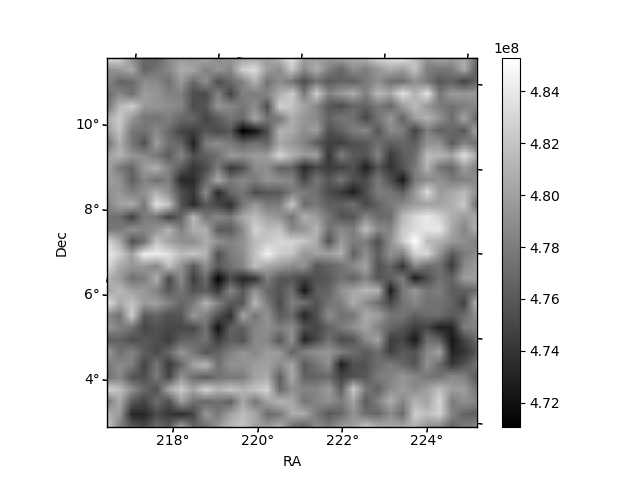
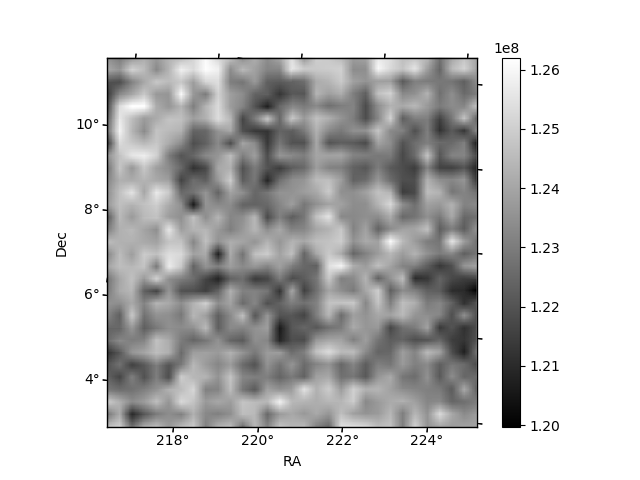
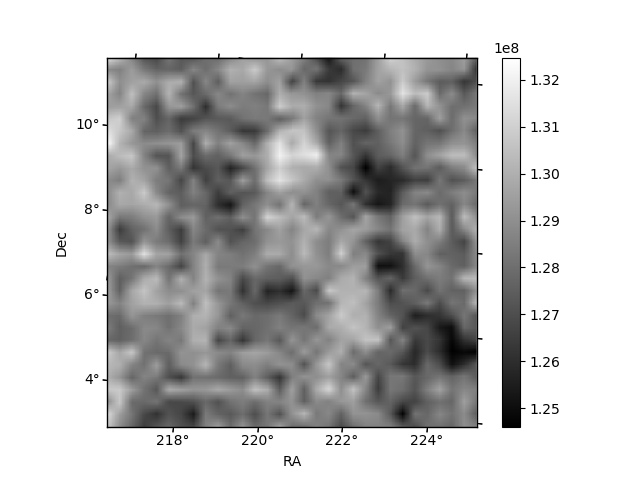
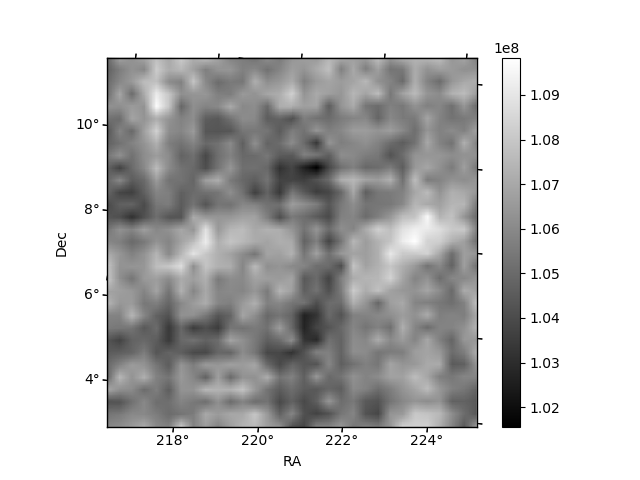
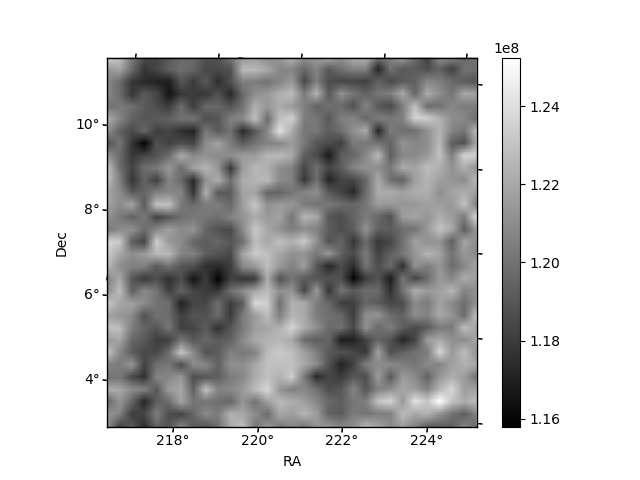
Histogram calculated using DETX and DETY for each event in the final _common_clean file
| Quadrant A |  |
 |
Quadrant B |
|---|---|---|---|
| Quadrant D | 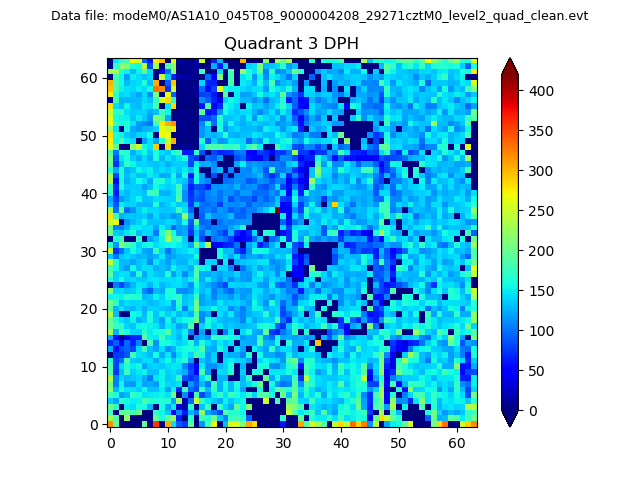 |
 |
Quadrant C |
| Plot type | Count rate plots | Images |
|---|---|---|
| Comparison with Poisson distribution Blue bars denote a histogram of data divided into 1 sec bins. Red curve is a Poisson curve with rate = median count rate of data. |
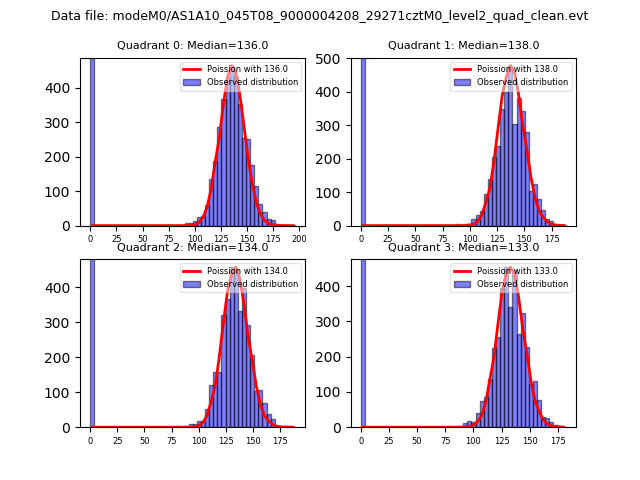 |
 |
| Quadrant-wise count rates Data is divided into 100 sec bins |
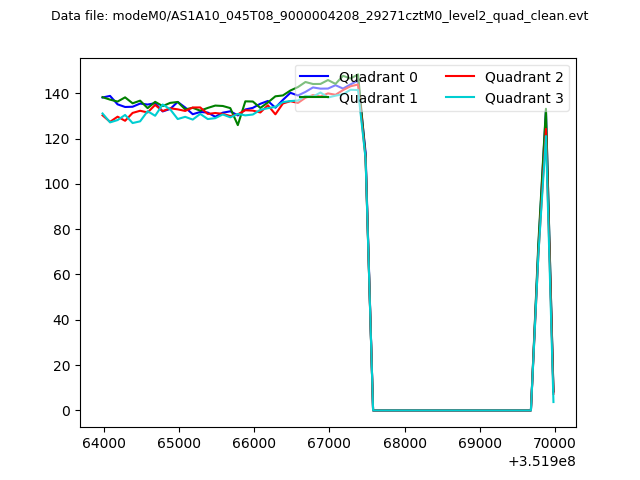 |
|
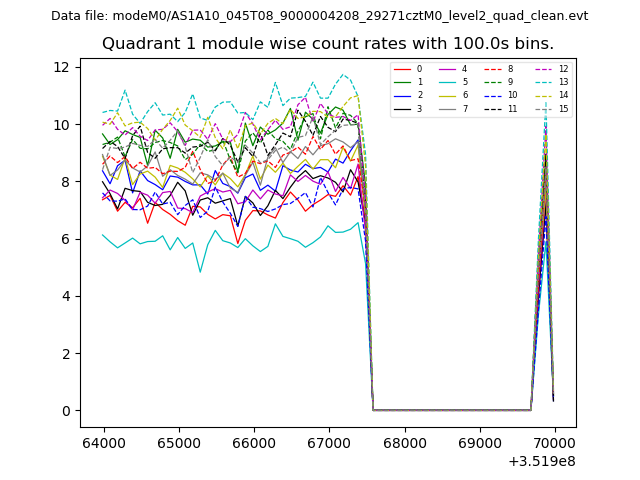
| Module-wise count rates for Quadrant A Data is divided into 100 sec bins |
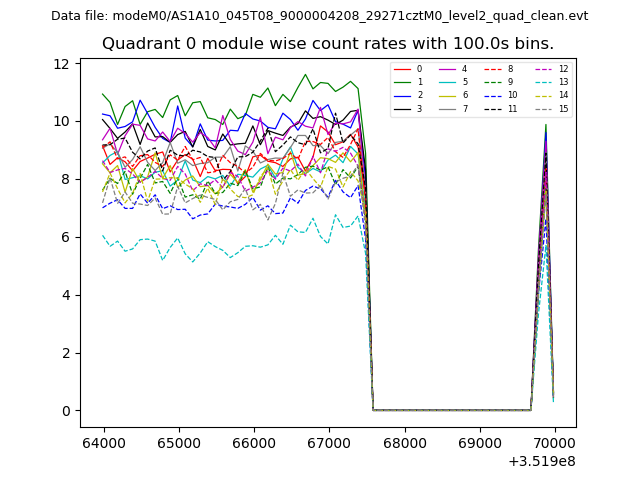 |
 |
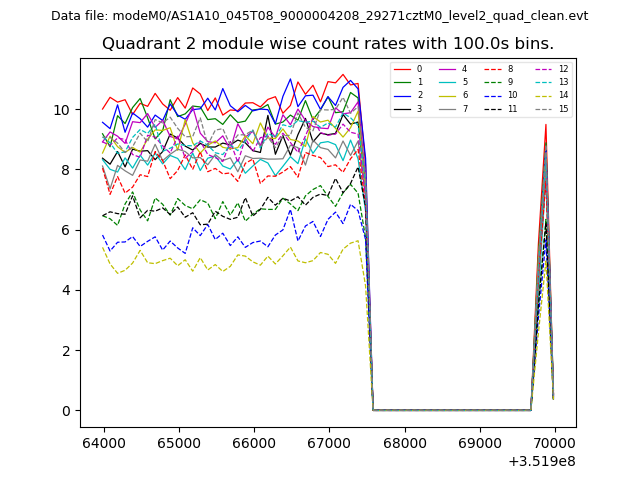
| Module-wise count rates for Quadrant B Data is divided into 100 sec bins |
 |
 |
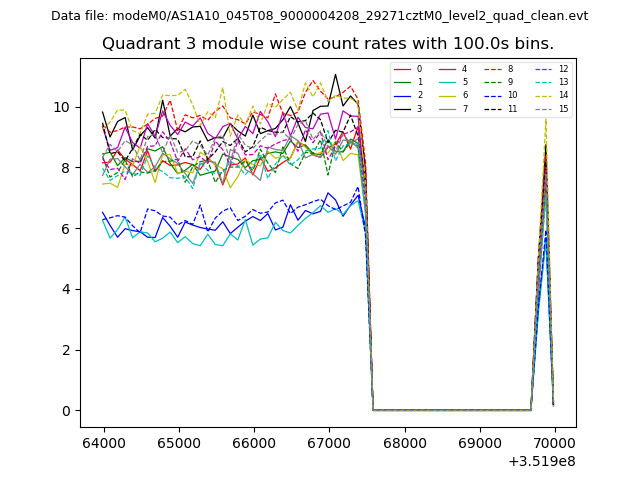
| Module-wise count rates for Quadrant C Data is divided into 100 sec bins |
 |
 |
| Module-wise count rates for Quadrant D Data is divided into 100 sec bins |
 |
 |
| Parameter | Plot |
|---|---|
| CZT HV Monitor | 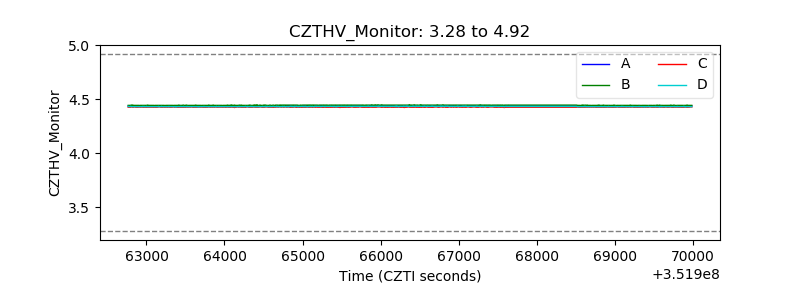 |
| D_VDD | 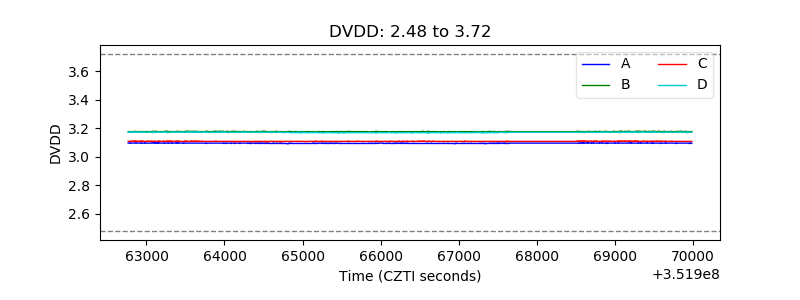 |
| Temperature 1 | 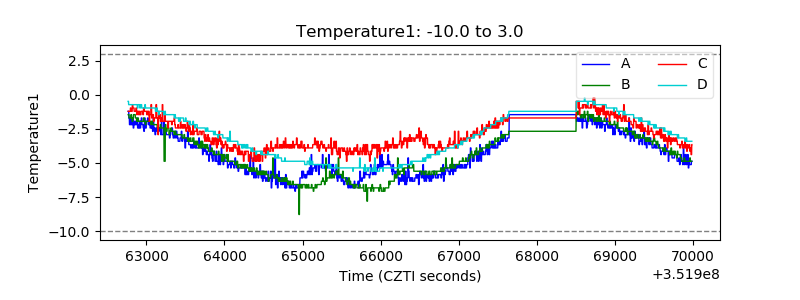 |
| Veto HV Monitor | 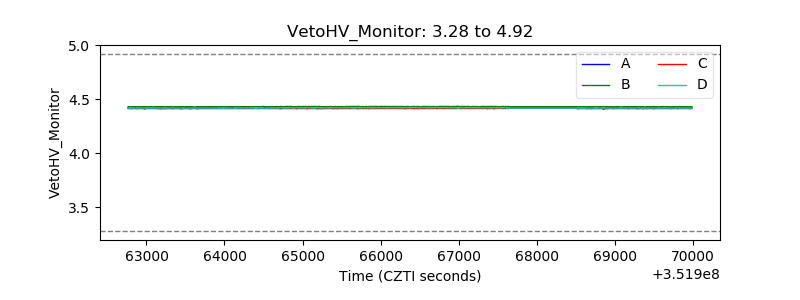 |
| Veto LLD | 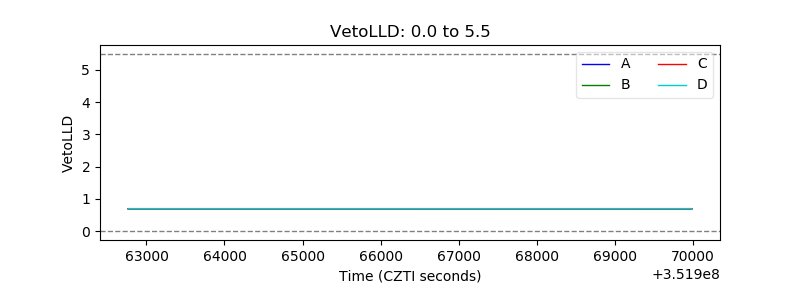 |
| Alpha Counter | 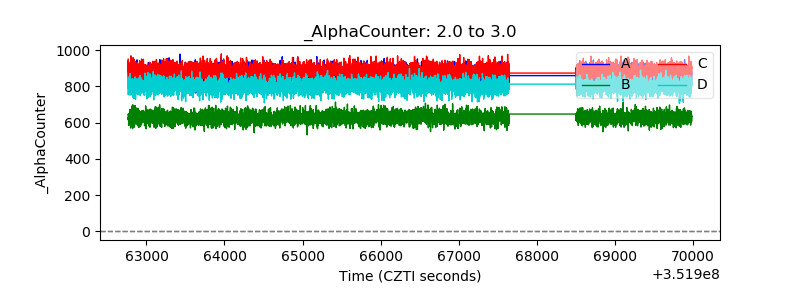 |
| _CPM_Rate | 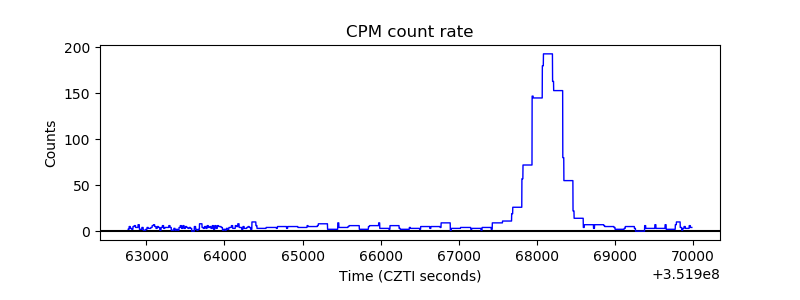 |
| CZT Counter | 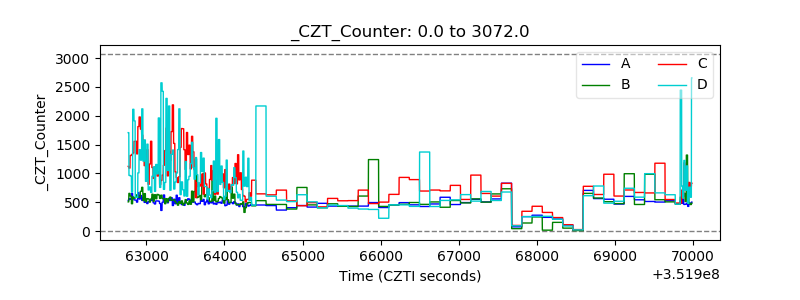 |
| +2.5 Volts monitor |  |
| +5 Volts monitor | 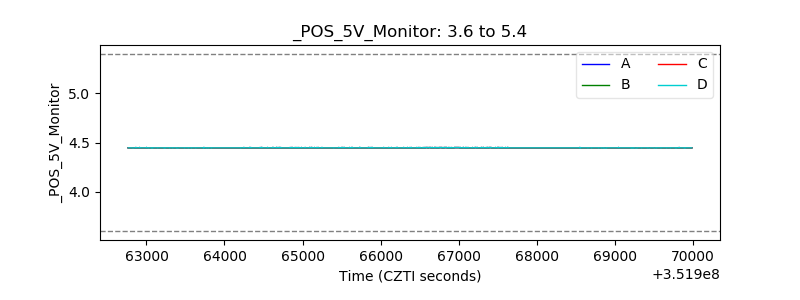 |
| _ROLL_ROT | 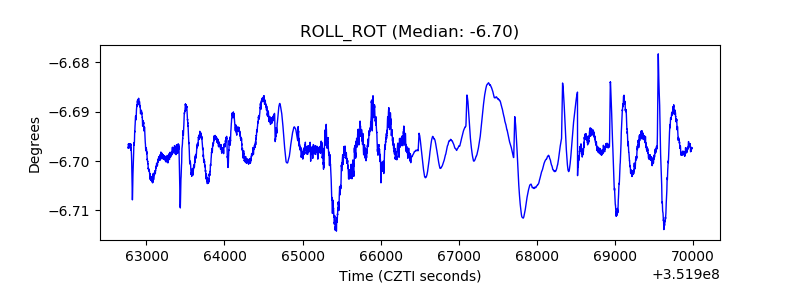 |
| _Roll_DEC | 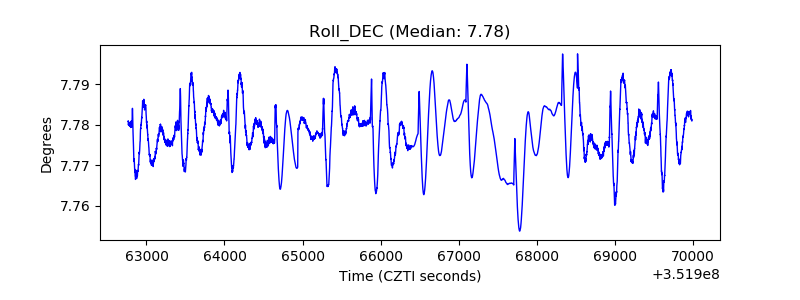 |
| _Roll_RA | 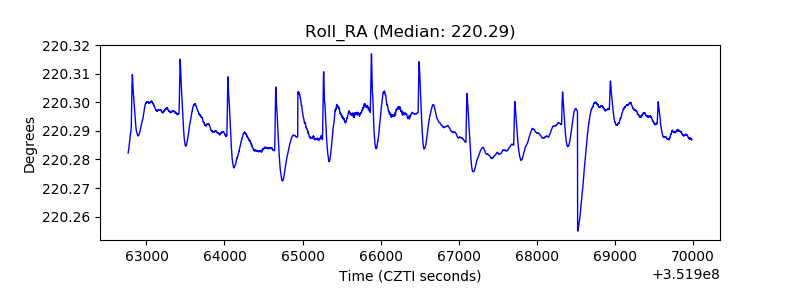 |
| Veto Counter | 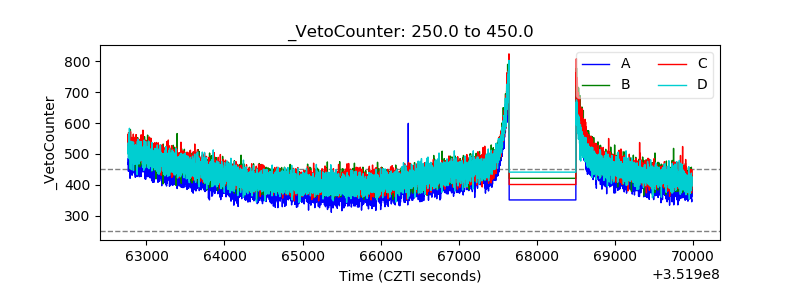 |