| Param | Original file | Final file |
|---|---|---|
| Filename | modeM0/AS1A10_045T08_9000004208_29272cztM0_level2.evt | modeM0/AS1A10_045T08_9000004208_29272cztM0_level2_quad_clean.evt |
| Size (bytes) | 634,089,600 | 84,574,080 |
| Size | 604.7 MB | 80.7 MB |
| Events in quadrant A | 3,425,307 | 525,679 |
| Events in quadrant B | 3,759,371 | 533,059 |
| Events in quadrant C | 6,166,610 | 506,793 |
| Events in quadrant D | 5,375,383 | 504,868 |
| Mode SS | |||
|---|---|---|---|
| Quadrant | BADHDUFLAG | Total packets | Discarded packets |
| A | 0 | 142 | 0 |
| B | 0 | 142 | 0 |
| C | 0 | 142 | 0 |
| D | 0 | 142 | 0 |
| Mode M0 | |||
|---|---|---|---|
| Quadrant | BADHDUFLAG | Total packets | Discarded packets |
| A | 0 | 14590 | 1 |
| B | 0 | 15655 | 1 |
| C | 0 | 23471 | 1 |
| D | 0 | 20649 | 8 |
| Mode M9 | |||
|---|---|---|---|
| Quadrant | BADHDUFLAG | Total packets | Discarded packets |
| A | 0 | 5 | 0 |
| B | 0 | 5 | 0 |
| C | 0 | 5 | 0 |
| D | 0 | 5 | 0 |
| Quadrant | Total seconds | Saturated seconds | Saturation percentage |
|---|---|---|---|
| A | 7049 | 67 | 0.950489% |
| B | 7049 | 114 | 1.617251% |
| C | 7049 | 680 | 9.646758% |
| D | 7048 | 344 | 4.880817% |
Noise dominated data is calculated using 1-second bins in cleaned event files. If a bin has >2000 counts, and if more than 50% of those come from <1% of pixels, then it is considered to be noise-dominated and hence unusable.
| Quadrant | # 1 sec bins | Bins with >0 counts | Bins with >2000 counts | High rate bins dominated by noise | Noise dominated (total time) | Noise dominated (detector-on time) | Marked lightcurve |
|---|---|---|---|---|---|---|---|
| A | 7489 | 7050 | 0 | 0 | 0.00% | 0.00% | 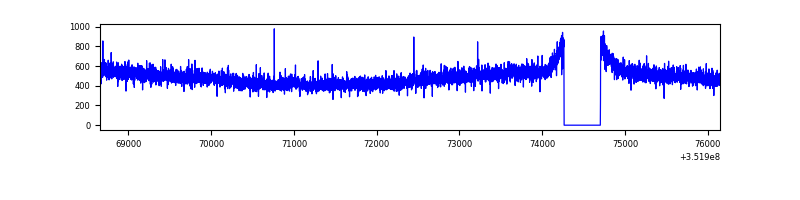 |
| B | 7489 | 7050 | 8 | 8 | 0.11% | 0.11% | 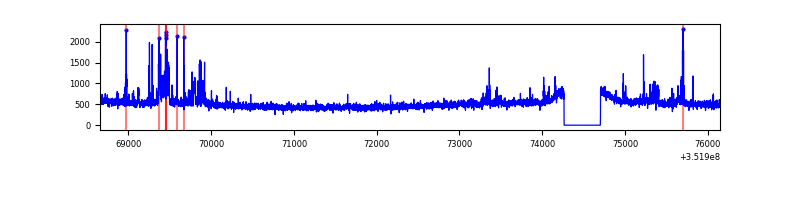 |
| C | 7489 | 7050 | 13 | 13 | 0.17% | 0.18% | 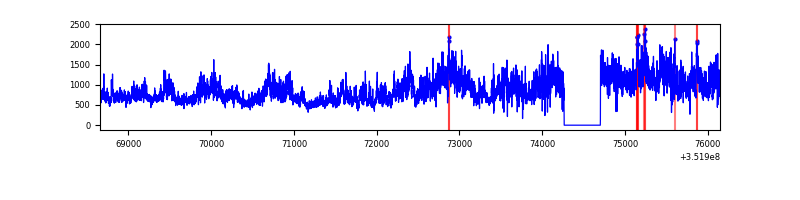 |
| D | 7488 | 7049 | 251 | 251 | 3.35% | 3.56% | 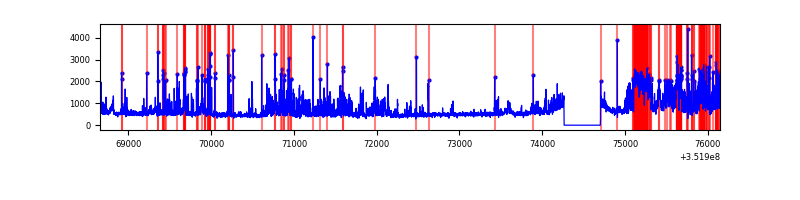 |
Top three noisy pixels from each quadrant. If the there are fewer than three noisy pixels in the level2.evt file, extra rows are filled as -1
| Pixel properties | Quadrant properties | ||||||
|---|---|---|---|---|---|---|---|
| Quadrant | DetID | PixID | Counts | Sigma | Mean | Median | Sigma |
| A | 13 | 254 | 13998 | 73.45 | 885 | 868 | 178.8 |
| A | 3 | 137 | 8727 | 43.97 | 885 | 868 | 178.8 |
| A | 1 | 113 | 7931 | 39.51 | 885 | 868 | 178.8 |
| B | 0 | 229 | 176357 | 1038.99 | 878 | 855 | 168.9 |
| B | 10 | 245 | 88625 | 519.61 | 878 | 855 | 168.9 |
| B | 0 | 183 | 26835 | 153.8 | 878 | 855 | 168.9 |
| C | 3 | 233 | 2625192 | 13532.88 | 825 | 832 | 193.9 |
| C | 14 | 238 | 197702 | 1015.19 | 825 | 832 | 193.9 |
| C | 14 | 254 | 93939 | 480.12 | 825 | 832 | 193.9 |
| D | 8 | 195 | 727313 | 3558.7 | 856 | 834 | 204.1 |
| D | 1 | 52 | 628407 | 3074.21 | 856 | 834 | 204.1 |
| D | 7 | 238 | 495887 | 2425.05 | 856 | 834 | 204.1 |
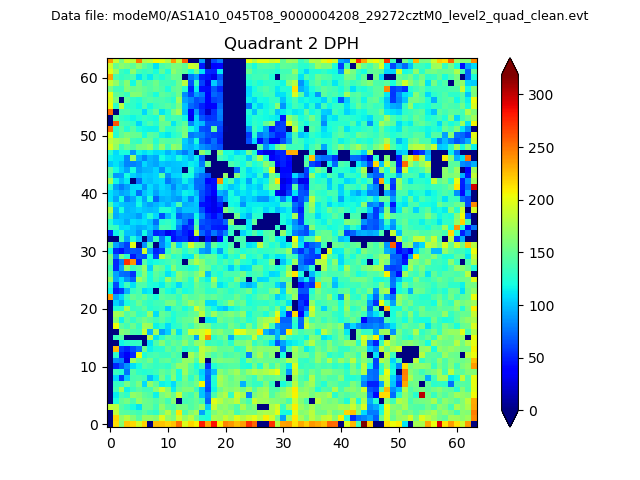
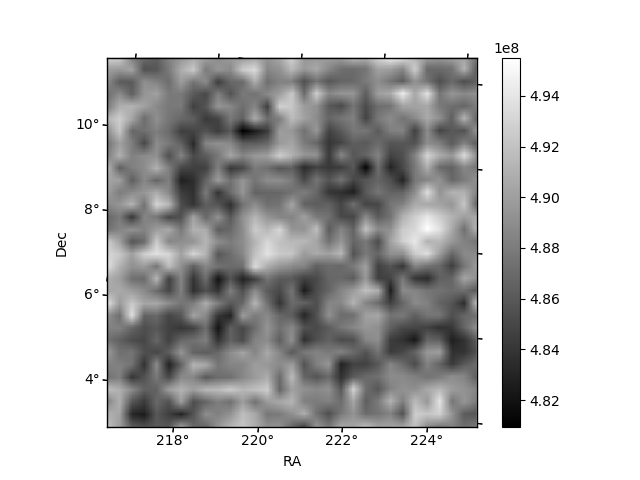
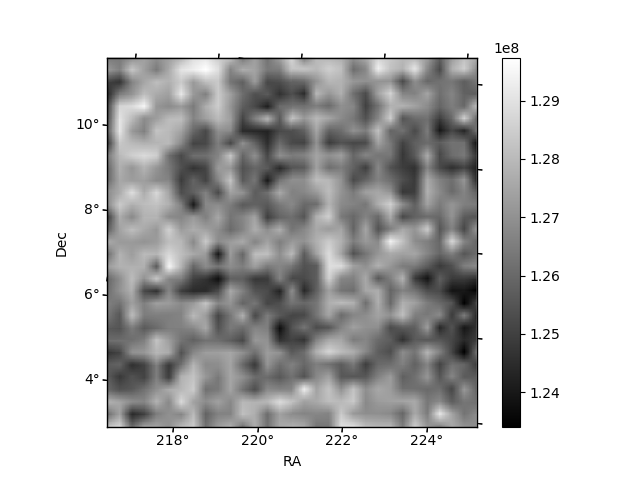
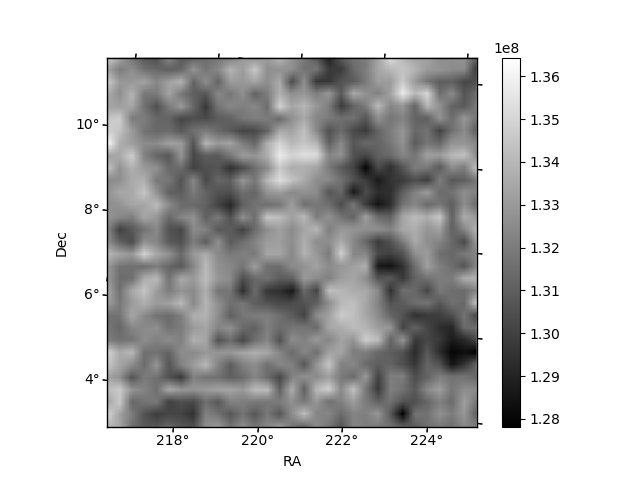
Histogram calculated using DETX and DETY for each event in the final _common_clean file
| Quadrant A | 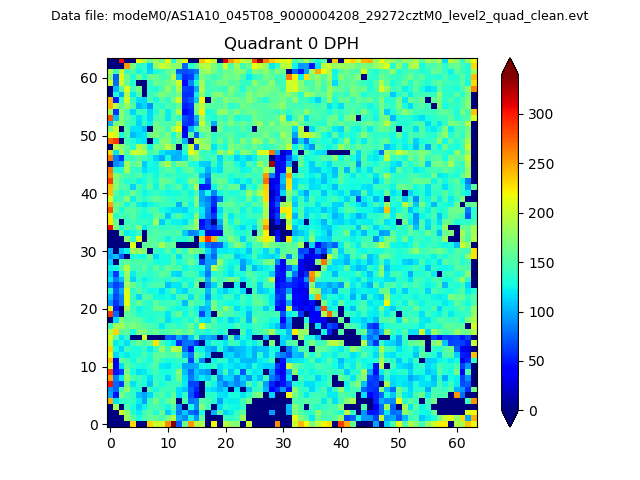 |
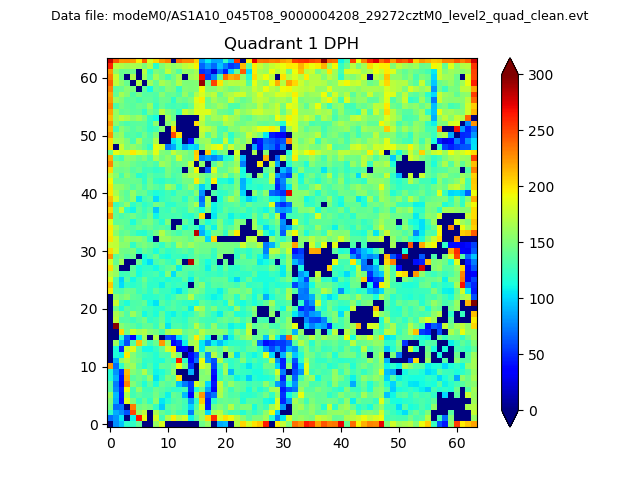 |
Quadrant B |
|---|---|---|---|
| Quadrant D | 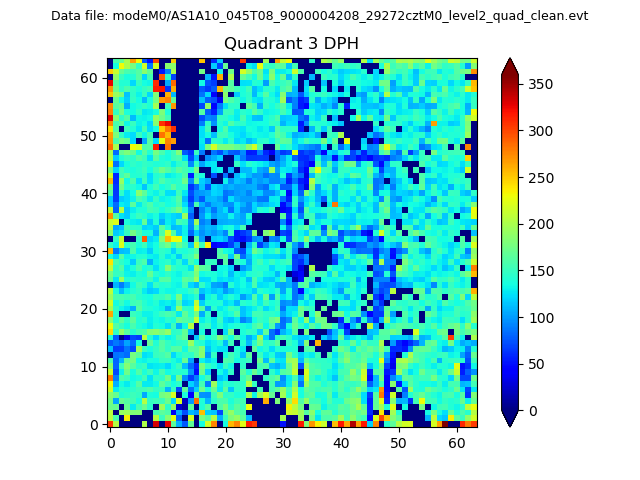 |
 |
Quadrant C |
| Plot type | Count rate plots | Images |
|---|---|---|
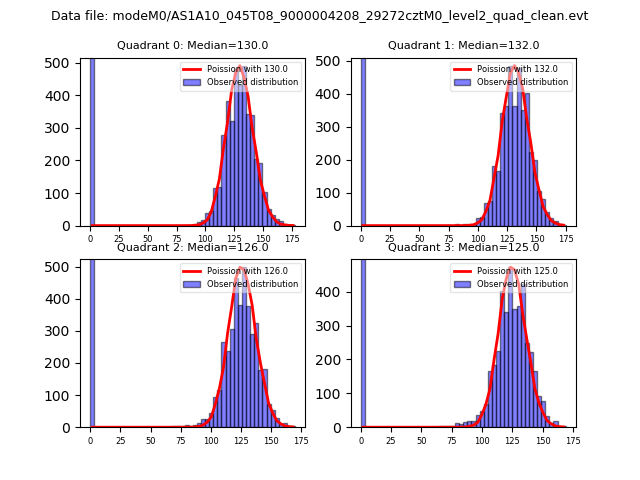
| Comparison with Poisson distribution Blue bars denote a histogram of data divided into 1 sec bins. Red curve is a Poisson curve with rate = median count rate of data. |
 |
 |
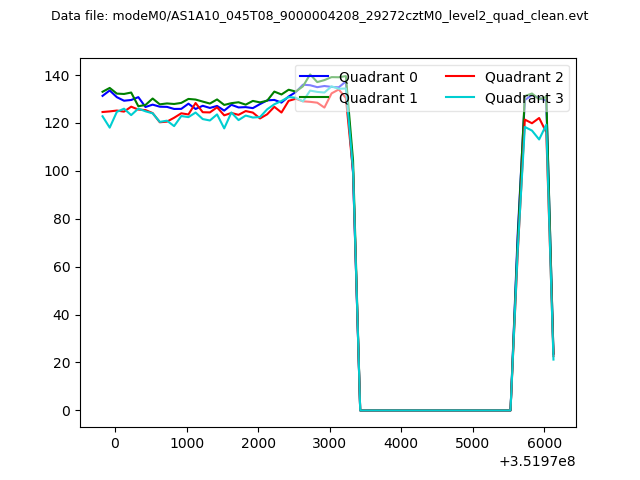
| Quadrant-wise count rates Data is divided into 100 sec bins |
 |
|
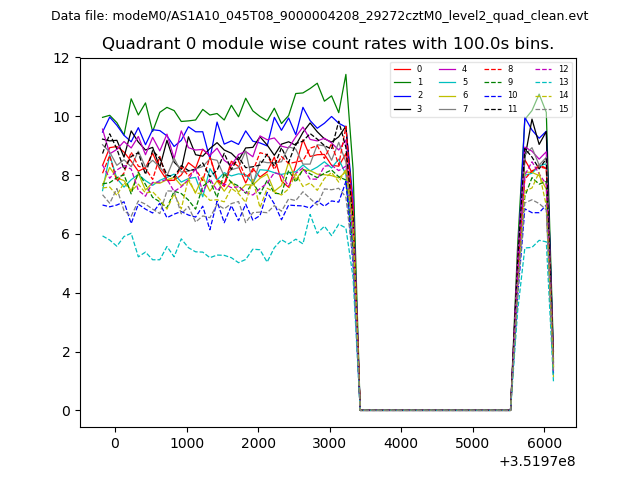
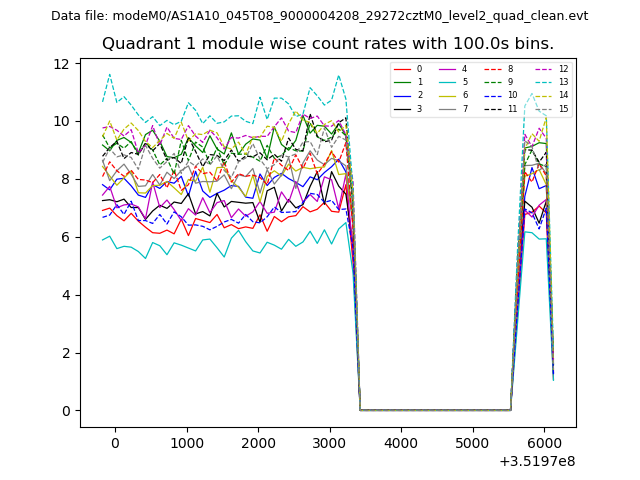
| Module-wise count rates for Quadrant A Data is divided into 100 sec bins |
 |
 |
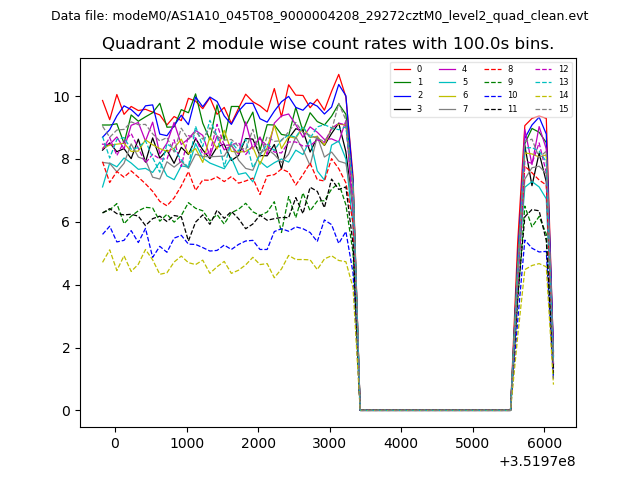
| Module-wise count rates for Quadrant B Data is divided into 100 sec bins |
 |
 |
| Module-wise count rates for Quadrant C Data is divided into 100 sec bins |
 |
 |
| Module-wise count rates for Quadrant D Data is divided into 100 sec bins |
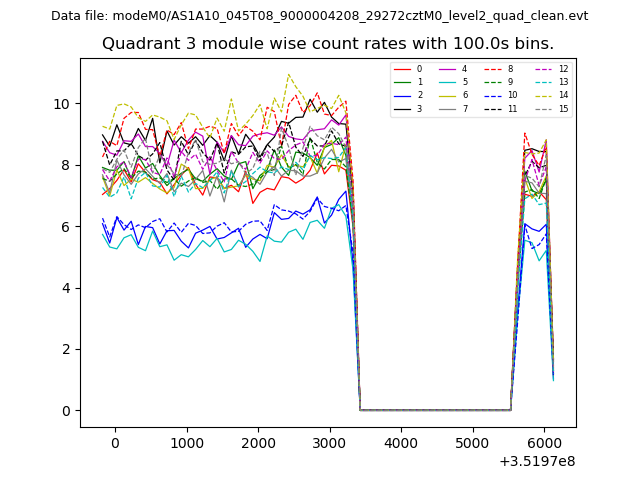 |
 |
| Parameter | Plot |
|---|---|
| CZT HV Monitor | 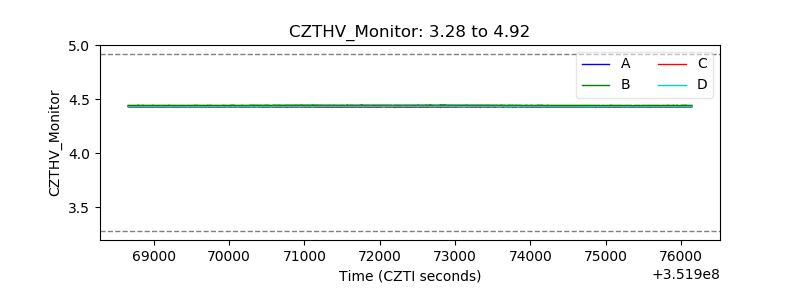 |
| D_VDD | 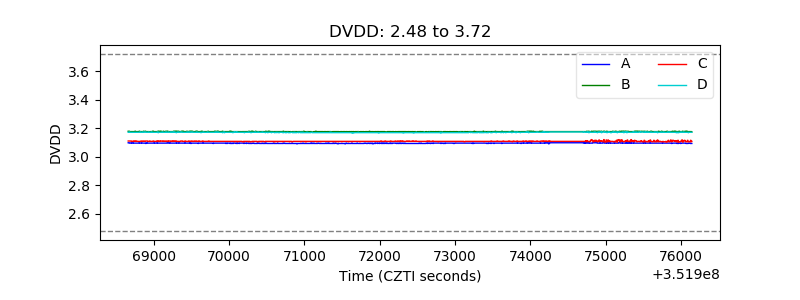 |
| Temperature 1 | 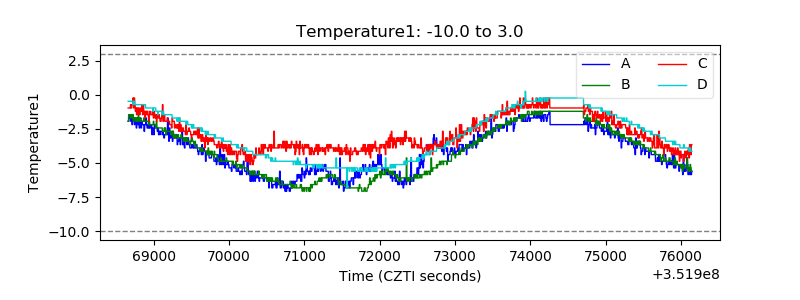 |
| Veto HV Monitor | 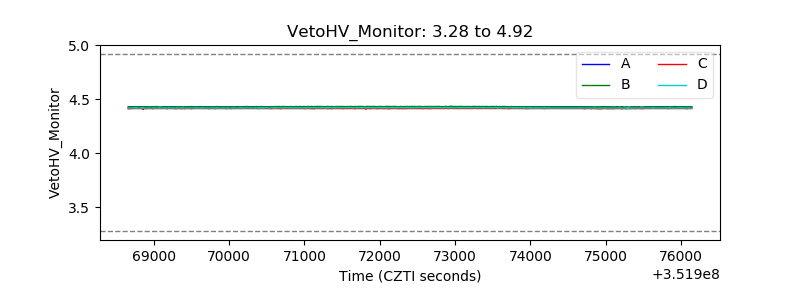 |
| Veto LLD | 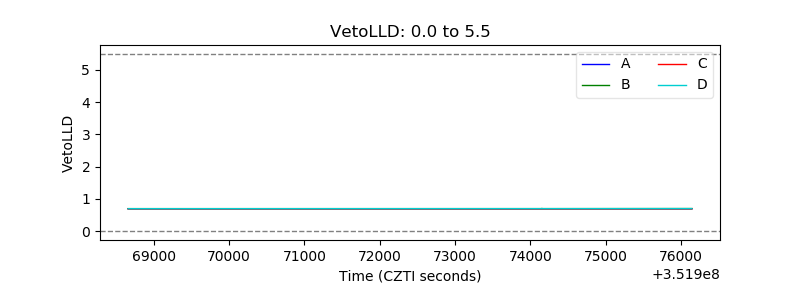 |
| Alpha Counter | 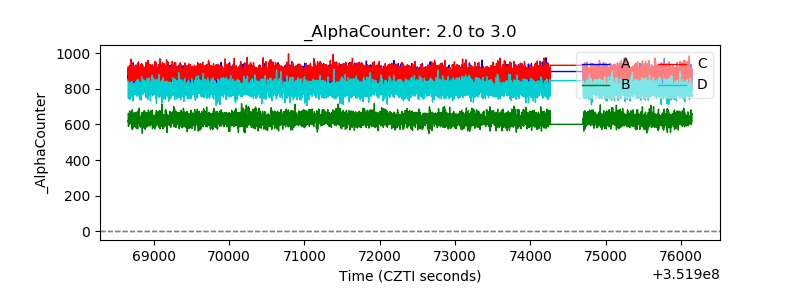 |
| _CPM_Rate | 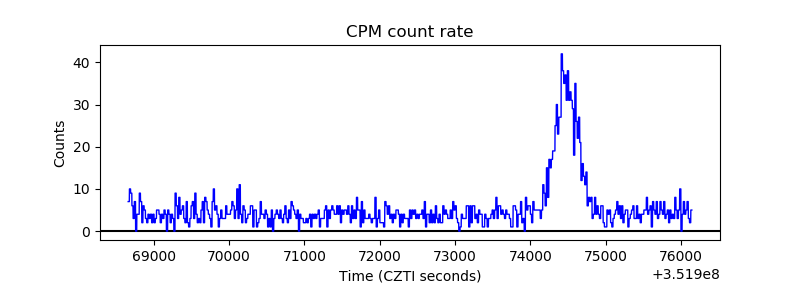 |
| CZT Counter | 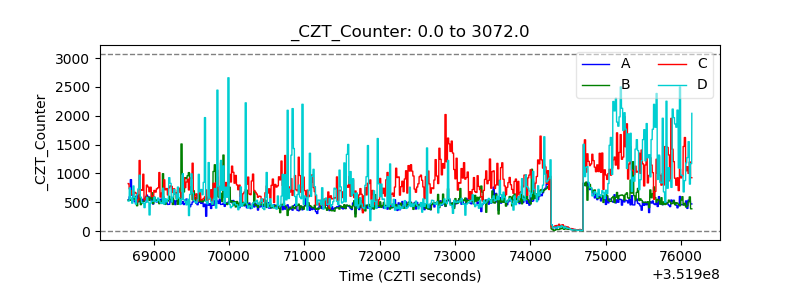 |
| +2.5 Volts monitor |  |
| +5 Volts monitor | 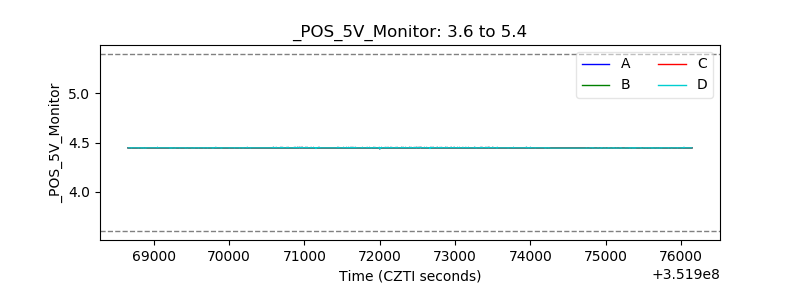 |
| _ROLL_ROT | 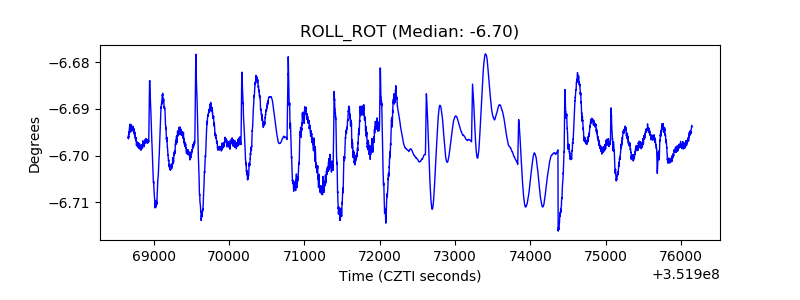 |
| _Roll_DEC | 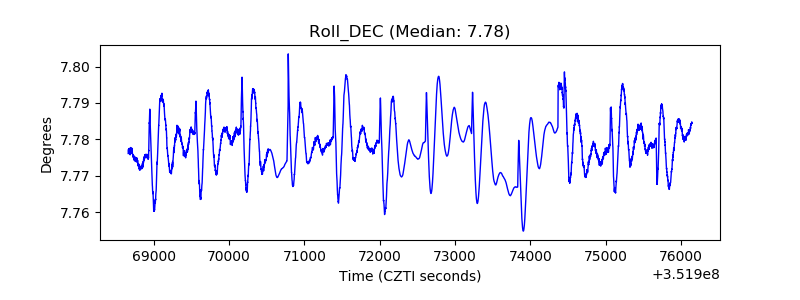 |
| _Roll_RA | 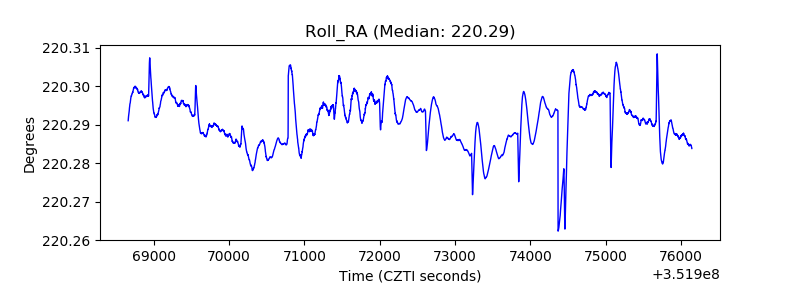 |
| Veto Counter | 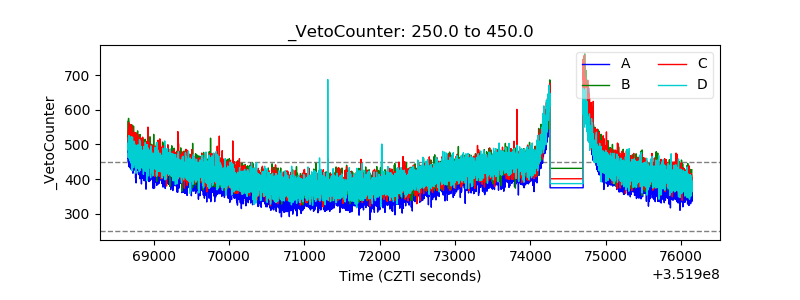 |