| Param | Original file | Final file |
|---|---|---|
| Filename | modeM0/AS1A10_045T08_9000004208_29273cztM0_level2.evt | modeM0/AS1A10_045T08_9000004208_29273cztM0_level2_quad_clean.evt |
| Size (bytes) | 719,380,800 | 91,877,760 |
| Size | 686.1 MB | 87.6 MB |
| Events in quadrant A | 3,397,507 | 586,806 |
| Events in quadrant B | 3,782,728 | 594,038 |
| Events in quadrant C | 6,871,904 | 554,303 |
| Events in quadrant D | 7,253,516 | 550,820 |
| Mode SS | |||
|---|---|---|---|
| Quadrant | BADHDUFLAG | Total packets | Discarded packets |
| A | 0 | 146 | 0 |
| B | 0 | 146 | 0 |
| C | 0 | 146 | 0 |
| D | 0 | 146 | 0 |
| Mode M0 | |||
|---|---|---|---|
| Quadrant | BADHDUFLAG | Total packets | Discarded packets |
| A | 0 | 14724 | 1 |
| B | 0 | 15902 | 1 |
| C | 0 | 25688 | 1 |
| D | 0 | 26604 | 1 |
| Mode M9 | |||
|---|---|---|---|
| Quadrant | BADHDUFLAG | Total packets | Discarded packets |
| A | 0 | 2 | 0 |
| B | 0 | 2 | 0 |
| C | 0 | 2 | 0 |
| D | 0 | 2 | 0 |
| Quadrant | Total seconds | Saturated seconds | Saturation percentage |
|---|---|---|---|
| A | 7119 | 53 | 0.744487% |
| B | 7120 | 125 | 1.755618% |
| C | 7120 | 783 | 10.997191% |
| D | 7120 | 462 | 6.488764% |
Noise dominated data is calculated using 1-second bins in cleaned event files. If a bin has >2000 counts, and if more than 50% of those come from <1% of pixels, then it is considered to be noise-dominated and hence unusable.
| Quadrant | # 1 sec bins | Bins with >0 counts | Bins with >2000 counts | High rate bins dominated by noise | Noise dominated (total time) | Noise dominated (detector-on time) | Marked lightcurve |
|---|---|---|---|---|---|---|---|
| A | 7354 | 7120 | 0 | 0 | 0.00% | 0.00% | 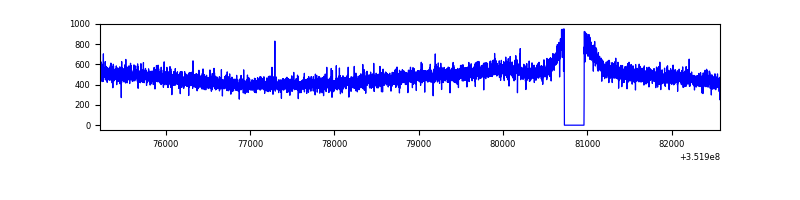 |
| B | 7355 | 7121 | 8 | 8 | 0.11% | 0.11% | 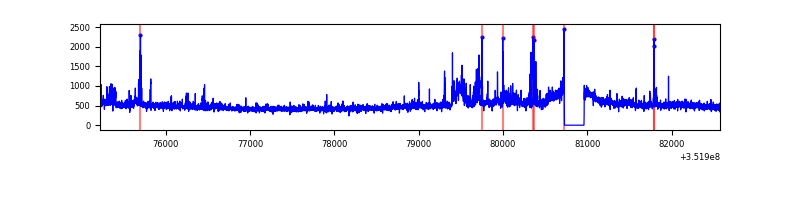 |
| C | 7355 | 7121 | 34 | 34 | 0.46% | 0.48% | 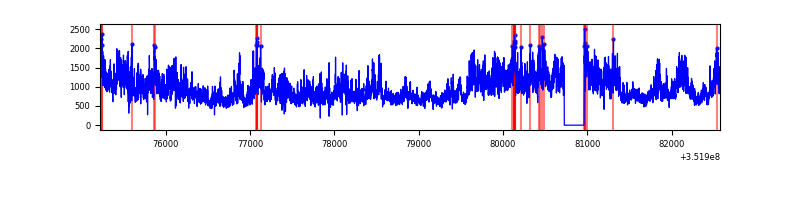 |
| D | 7355 | 7121 | 365 | 365 | 4.96% | 5.13% | 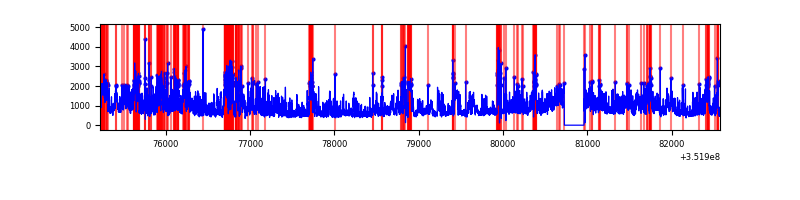 |
Top three noisy pixels from each quadrant. If the there are fewer than three noisy pixels in the level2.evt file, extra rows are filled as -1
| Pixel properties | Quadrant properties | ||||||
|---|---|---|---|---|---|---|---|
| Quadrant | DetID | PixID | Counts | Sigma | Mean | Median | Sigma |
| A | 13 | 254 | 14020 | 73.79 | 879 | 863 | 178.3 |
| A | 3 | 137 | 8745 | 44.21 | 879 | 863 | 178.3 |
| A | 0 | 226 | 7451 | 36.95 | 879 | 863 | 178.3 |
| B | 0 | 229 | 148318 | 867.95 | 872 | 848 | 169.9 |
| B | 10 | 245 | 109160 | 637.48 | 872 | 848 | 169.9 |
| B | 0 | 183 | 47305 | 273.43 | 872 | 848 | 169.9 |
| C | 3 | 233 | 3335122 | 17332.44 | 816 | 822 | 192.4 |
| C | 14 | 238 | 200583 | 1038.4 | 816 | 822 | 192.4 |
| C | 14 | 254 | 101190 | 521.73 | 816 | 822 | 192.4 |
| D | 8 | 195 | 1620366 | 8051.28 | 837 | 814 | 201.2 |
| D | 1 | 52 | 1378563 | 6849.2 | 837 | 814 | 201.2 |
| D | 7 | 238 | 526000 | 2610.86 | 837 | 814 | 201.2 |
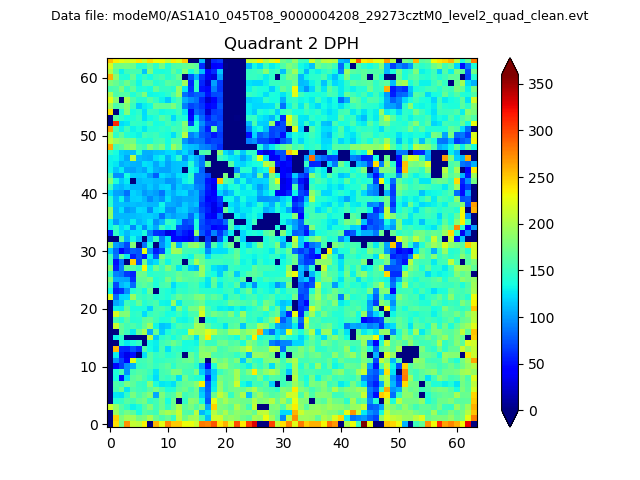
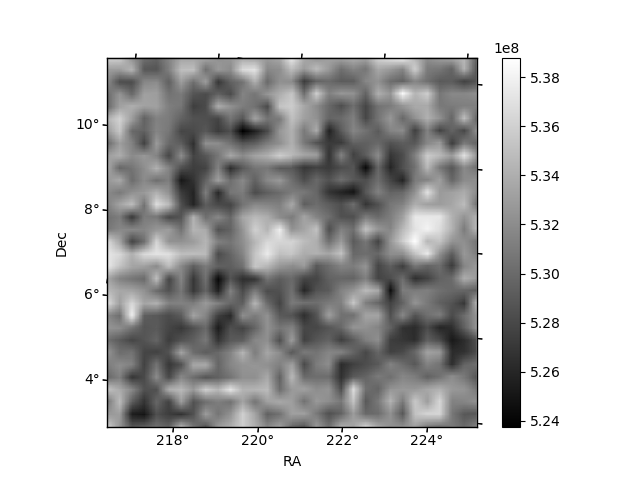
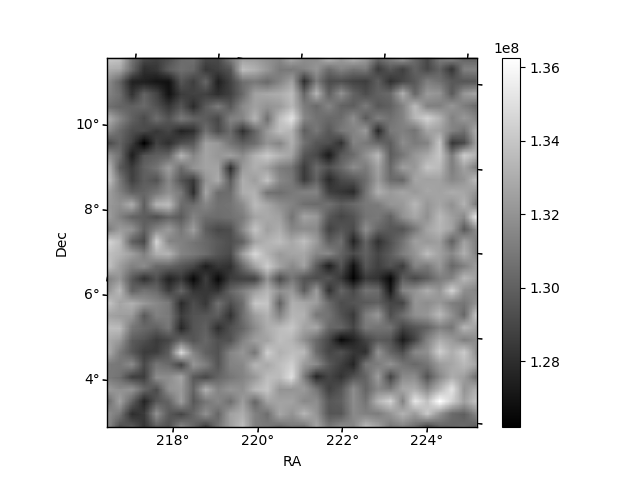
Histogram calculated using DETX and DETY for each event in the final _common_clean file
| Quadrant A | 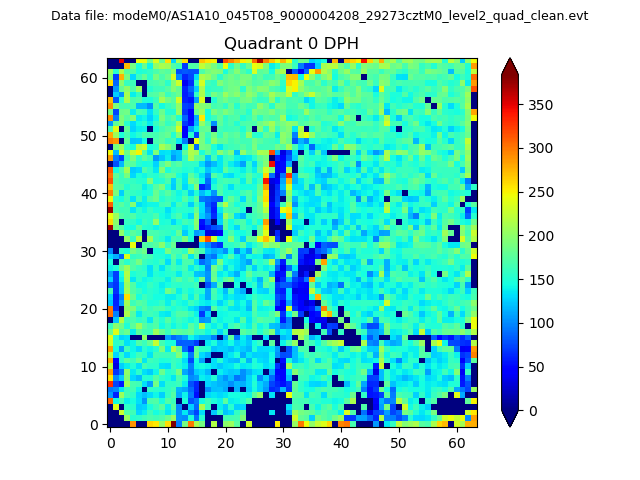 |
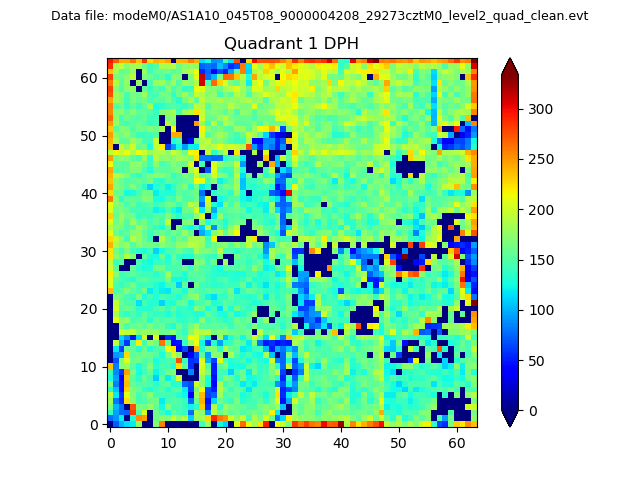 |
Quadrant B |
|---|---|---|---|
| Quadrant D | 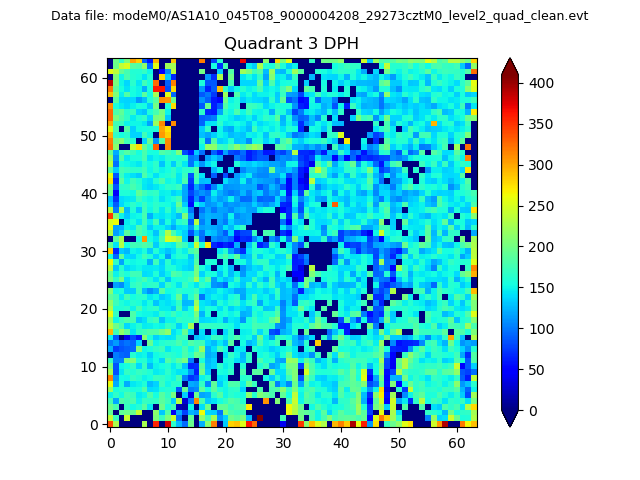 |
 |
Quadrant C |
| Plot type | Count rate plots | Images |
|---|---|---|
| Comparison with Poisson distribution Blue bars denote a histogram of data divided into 1 sec bins. Red curve is a Poisson curve with rate = median count rate of data. |
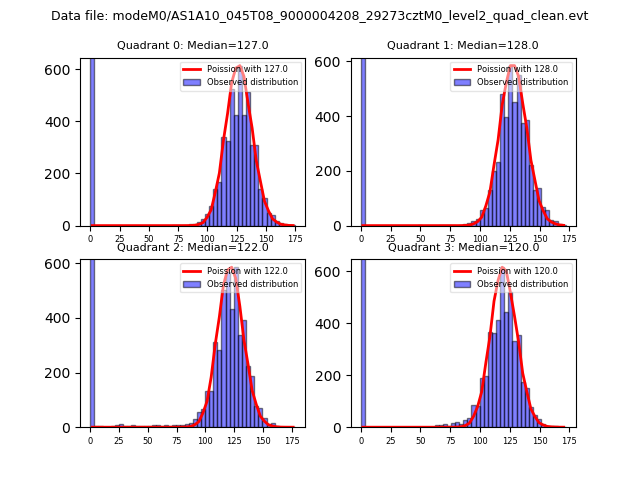 |
 |
| Quadrant-wise count rates Data is divided into 100 sec bins |
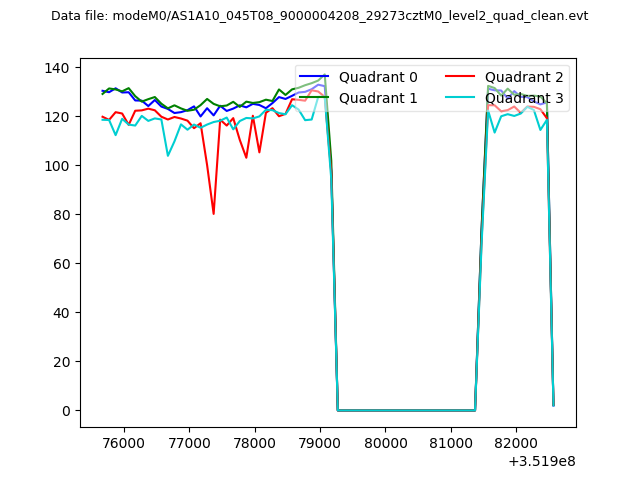 |
|
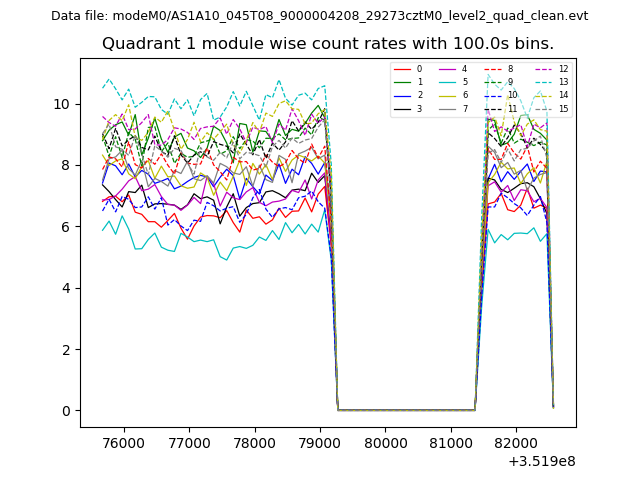
| Module-wise count rates for Quadrant A Data is divided into 100 sec bins |
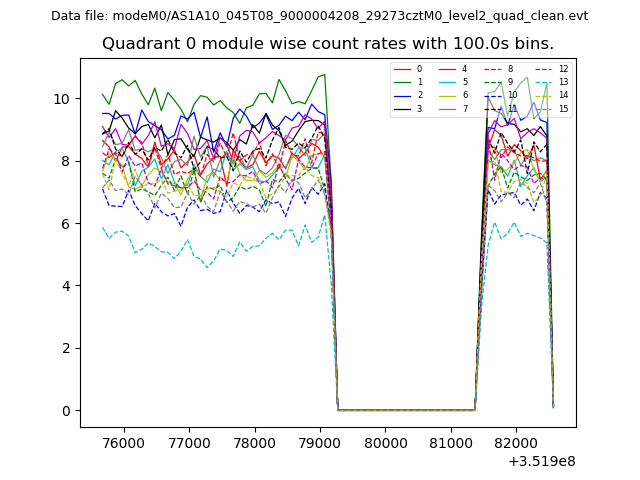 |
 |
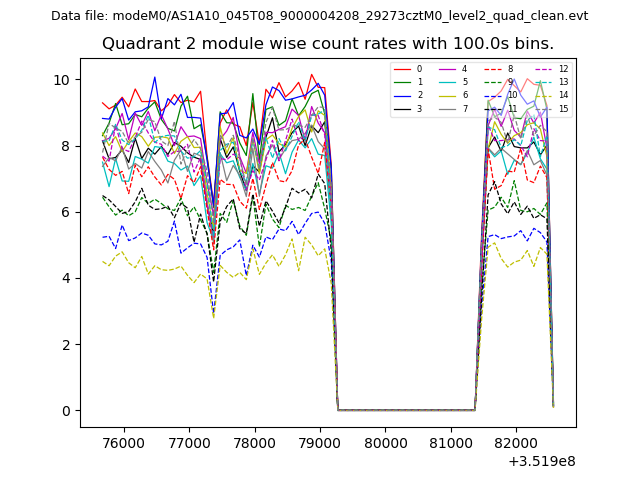
| Module-wise count rates for Quadrant B Data is divided into 100 sec bins |
 |
 |
| Module-wise count rates for Quadrant C Data is divided into 100 sec bins |
 |
 |
| Module-wise count rates for Quadrant D Data is divided into 100 sec bins |
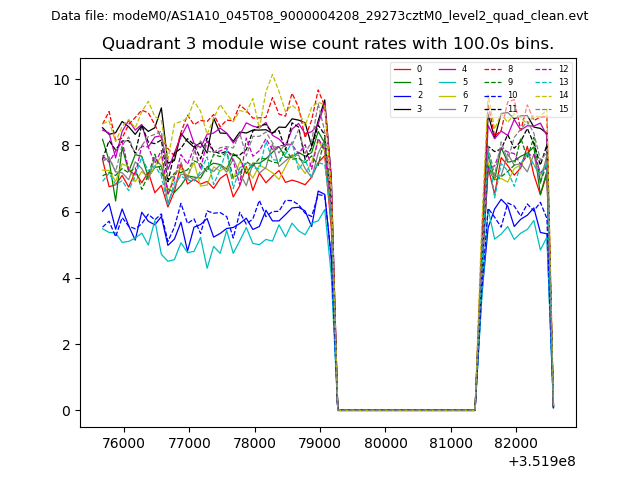 |
 |
| Parameter | Plot |
|---|---|
| CZT HV Monitor | 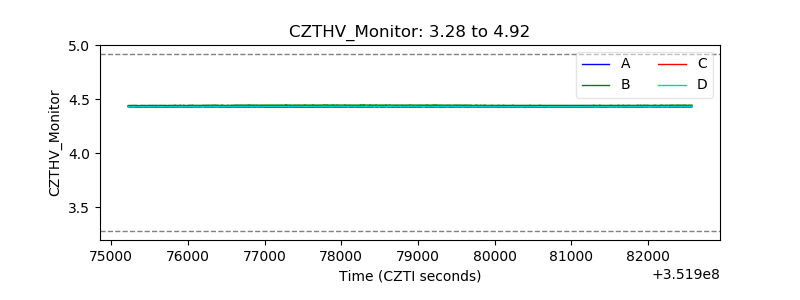 |
| D_VDD | 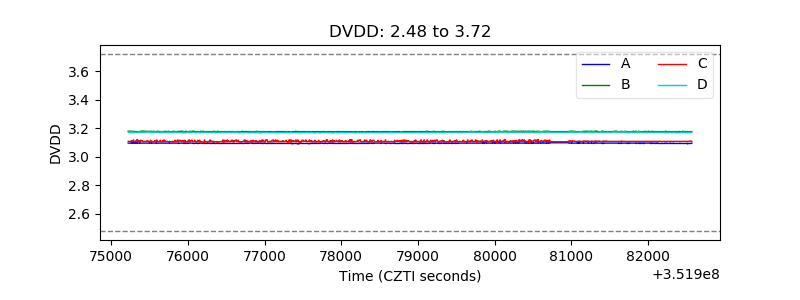 |
| Temperature 1 | 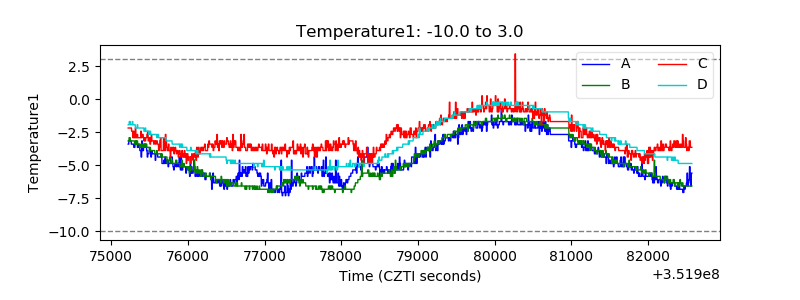 |
| Veto HV Monitor | 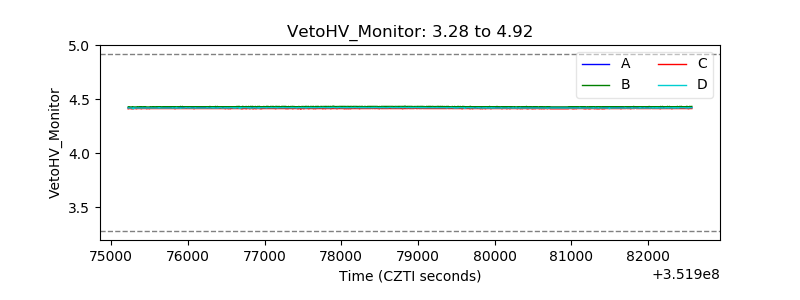 |
| Veto LLD | 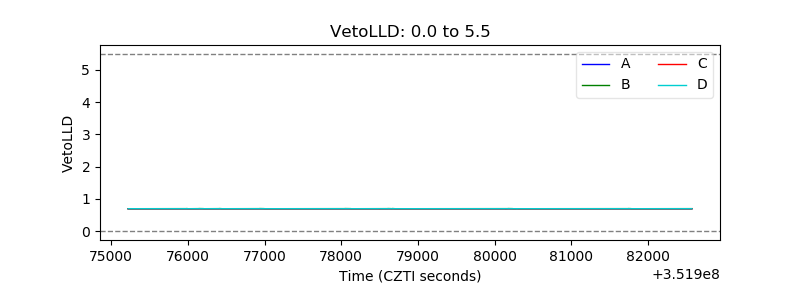 |
| Alpha Counter | 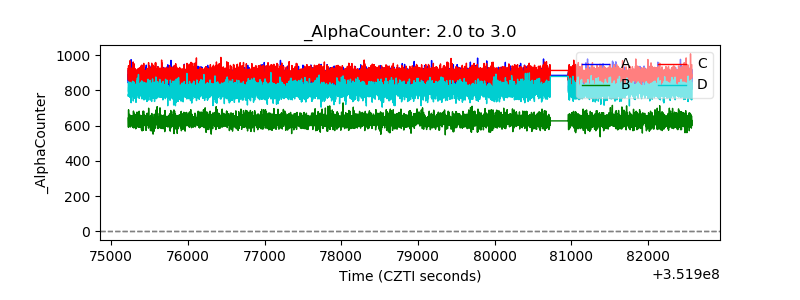 |
| _CPM_Rate | 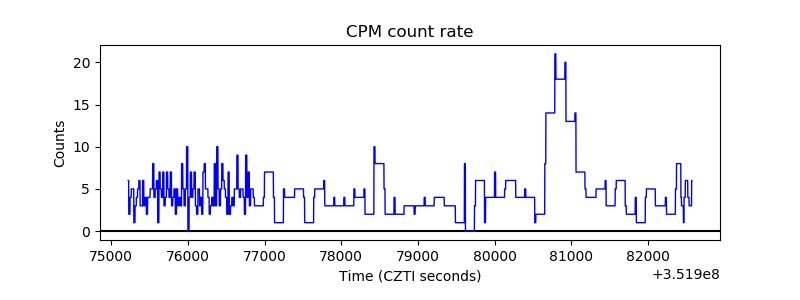 |
| CZT Counter | 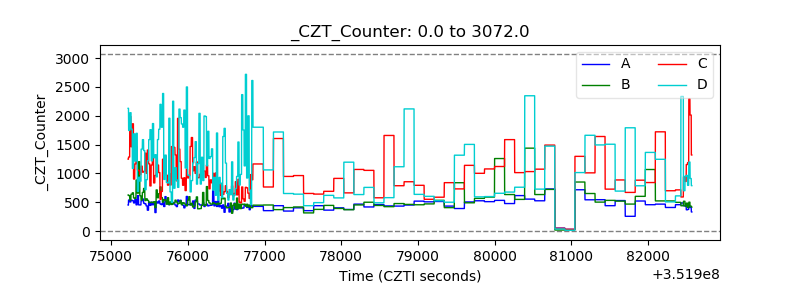 |
| +2.5 Volts monitor |  |
| +5 Volts monitor | 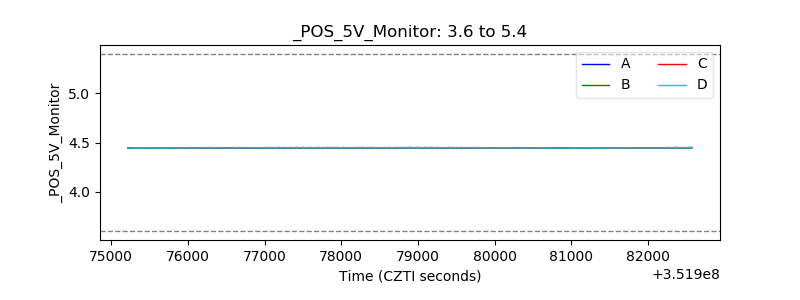 |
| _ROLL_ROT | 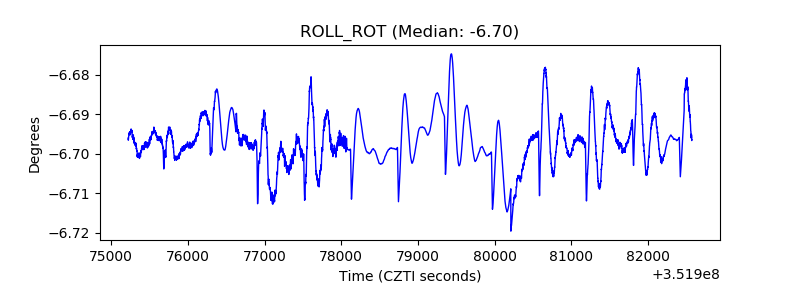 |
| _Roll_DEC |  |
| _Roll_RA | 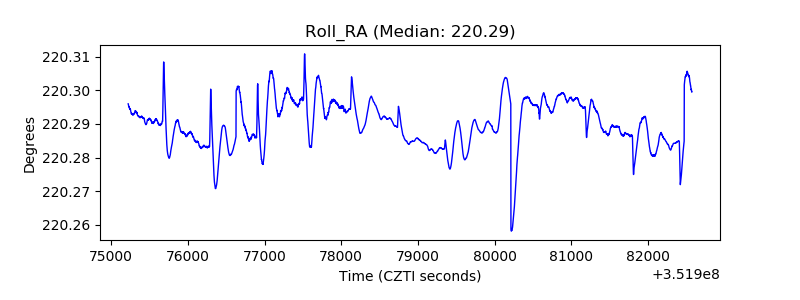 |
| Veto Counter | 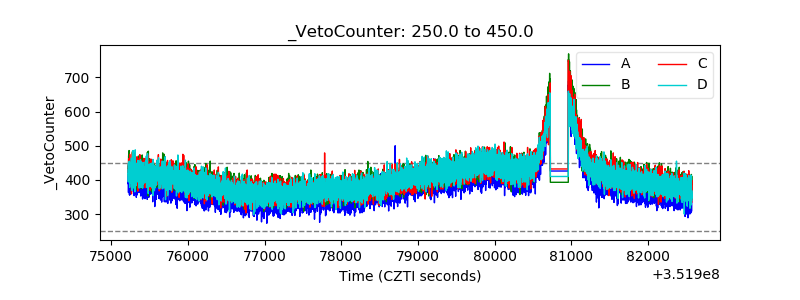 |