| Param | Original file | Final file |
|---|---|---|
| Filename | modeM0/AS1A10_045T08_9000004208_29274cztM0_level2.evt | modeM0/AS1A10_045T08_9000004208_29274cztM0_level2_quad_clean.evt |
| Size (bytes) | 684,486,720 | 101,471,040 |
| Size | 652.8 MB | 96.8 MB |
| Events in quadrant A | 3,484,543 | 650,633 |
| Events in quadrant B | 3,973,989 | 659,414 |
| Events in quadrant C | 6,556,466 | 627,111 |
| Events in quadrant D | 6,215,887 | 621,941 |
| Mode SS | |||
|---|---|---|---|
| Quadrant | BADHDUFLAG | Total packets | Discarded packets |
| A | 0 | 150 | 0 |
| B | 0 | 150 | 0 |
| C | 0 | 150 | 0 |
| D | 0 | 150 | 0 |
| Mode M0 | |||
|---|---|---|---|
| Quadrant | BADHDUFLAG | Total packets | Discarded packets |
| A | 0 | 15164 | 1 |
| B | 0 | 16559 | 1 |
| C | 0 | 24756 | 1 |
| D | 0 | 23632 | 6 |
| Mode M9 | |||
|---|---|---|---|
| Quadrant | BADHDUFLAG | Total packets | Discarded packets |
| A | 0 | 4 | 0 |
| B | 0 | 4 | 0 |
| C | 0 | 4 | 0 |
| D | 0 | 4 | 0 |
| Quadrant | Total seconds | Saturated seconds | Saturation percentage |
|---|---|---|---|
| A | 7381 | 42 | 0.569029% |
| B | 7382 | 97 | 1.314007% |
| C | 7382 | 652 | 8.832295% |
| D | 7381 | 237 | 3.210947% |
Noise dominated data is calculated using 1-second bins in cleaned event files. If a bin has >2000 counts, and if more than 50% of those come from <1% of pixels, then it is considered to be noise-dominated and hence unusable.
| Quadrant | # 1 sec bins | Bins with >0 counts | Bins with >2000 counts | High rate bins dominated by noise | Noise dominated (total time) | Noise dominated (detector-on time) | Marked lightcurve |
|---|---|---|---|---|---|---|---|
| A | 7731 | 7382 | 0 | 0 | 0.00% | 0.00% |  |
| B | 7732 | 7383 | 6 | 6 | 0.08% | 0.08% | 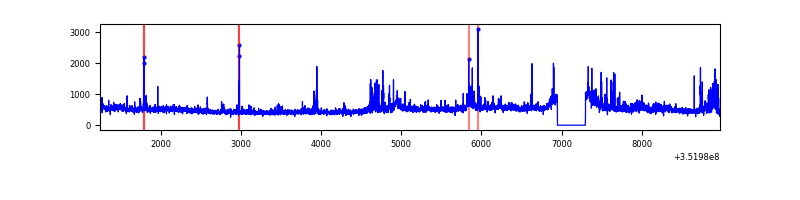 |
| C | 7732 | 7382 | 70 | 70 | 0.91% | 0.95% | 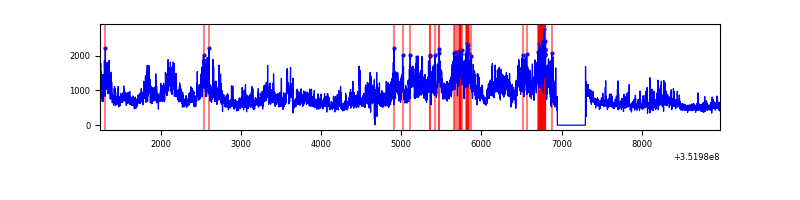 |
| D | 7731 | 7382 | 173 | 173 | 2.24% | 2.34% | 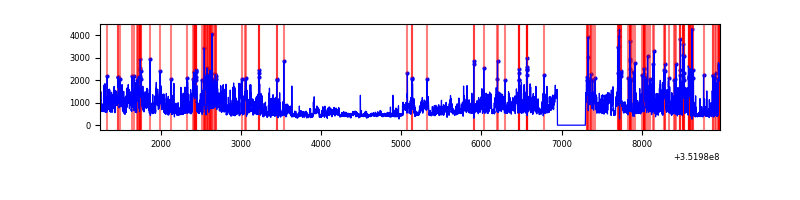 |
Top three noisy pixels from each quadrant. If the there are fewer than three noisy pixels in the level2.evt file, extra rows are filled as -1
| Pixel properties | Quadrant properties | ||||||
|---|---|---|---|---|---|---|---|
| Quadrant | DetID | PixID | Counts | Sigma | Mean | Median | Sigma |
| A | 1 | 113 | 20561 | 108.13 | 897 | 878 | 182.0 |
| A | 13 | 254 | 14698 | 75.92 | 897 | 878 | 182.0 |
| A | 3 | 137 | 9148 | 45.43 | 897 | 878 | 182.0 |
| B | 10 | 245 | 183925 | 1059.79 | 892 | 871 | 172.7 |
| B | 0 | 229 | 158112 | 910.35 | 892 | 871 | 172.7 |
| B | 0 | 183 | 112911 | 648.66 | 892 | 871 | 172.7 |
| C | 3 | 233 | 3004213 | 15194.46 | 837 | 842 | 197.7 |
| C | 14 | 238 | 181512 | 914.03 | 837 | 842 | 197.7 |
| C | 14 | 254 | 73543 | 367.8 | 837 | 842 | 197.7 |
| D | 1 | 52 | 1251448 | 5974.58 | 861 | 840 | 209.3 |
| D | 8 | 195 | 1060583 | 5062.75 | 861 | 840 | 209.3 |
| D | 7 | 238 | 288254 | 1373.07 | 861 | 840 | 209.3 |
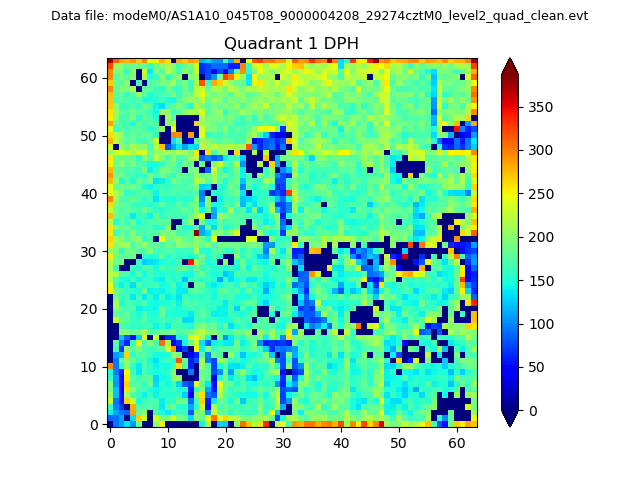
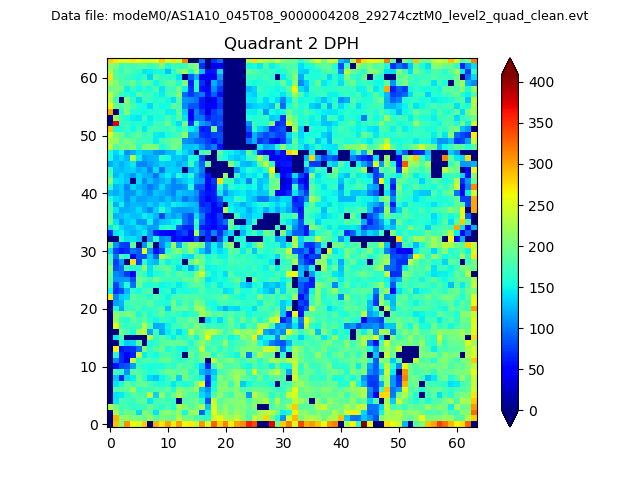
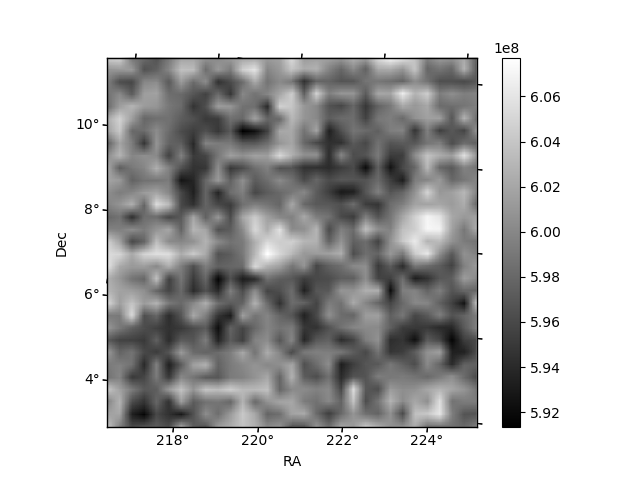
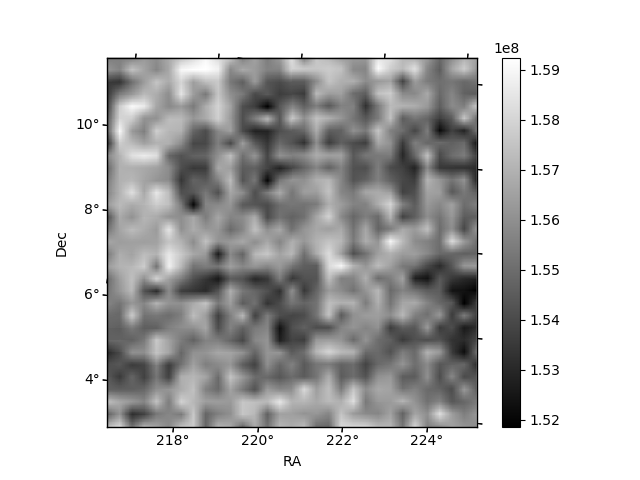
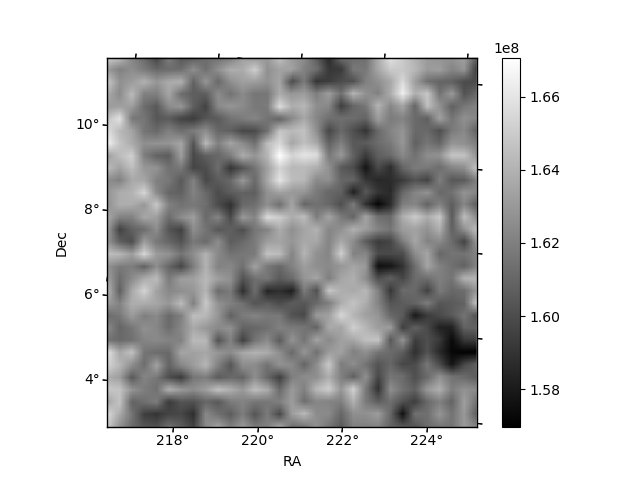
Histogram calculated using DETX and DETY for each event in the final _common_clean file
| Quadrant A | 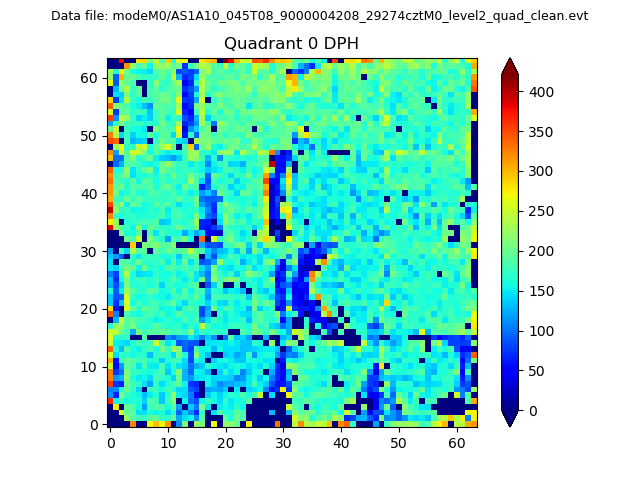 |
 |
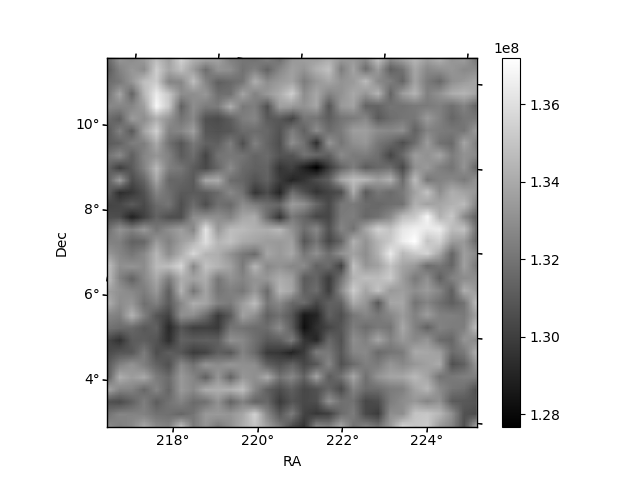
Quadrant B |
|---|---|---|---|
| Quadrant D | 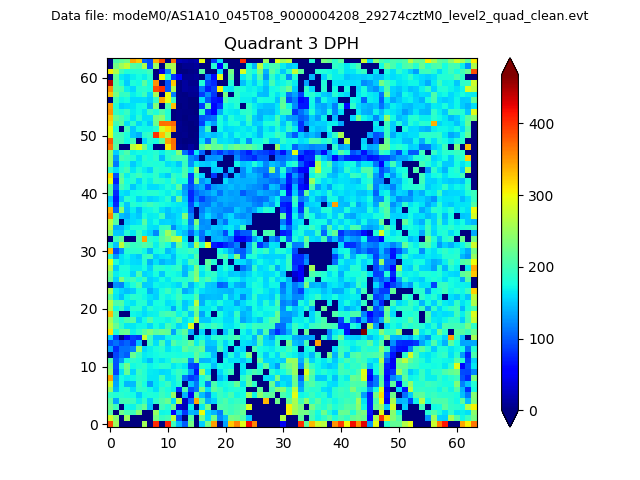 |
 |
Quadrant C |
| Plot type | Count rate plots | Images |
|---|---|---|
| Comparison with Poisson distribution Blue bars denote a histogram of data divided into 1 sec bins. Red curve is a Poisson curve with rate = median count rate of data. |
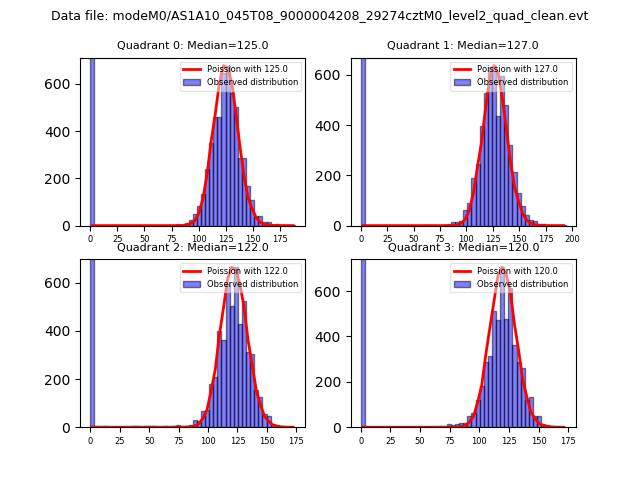 |
 |
| Quadrant-wise count rates Data is divided into 100 sec bins |
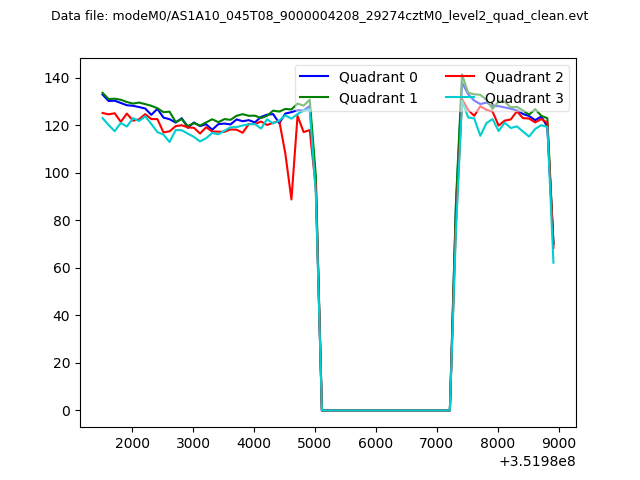 |
|
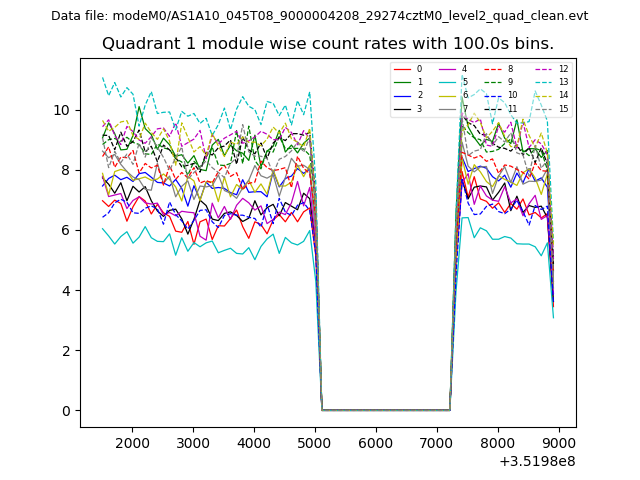
| Module-wise count rates for Quadrant A Data is divided into 100 sec bins |
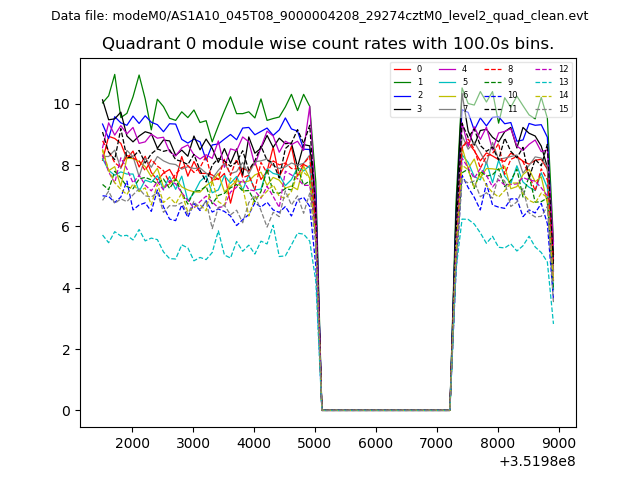 |
 |
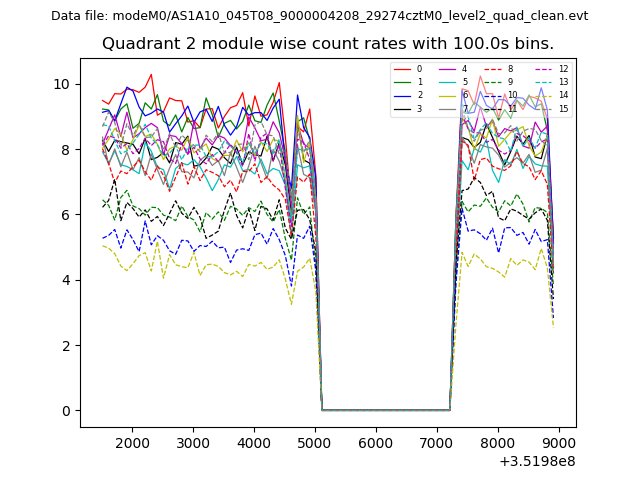
| Module-wise count rates for Quadrant B Data is divided into 100 sec bins |
 |
 |
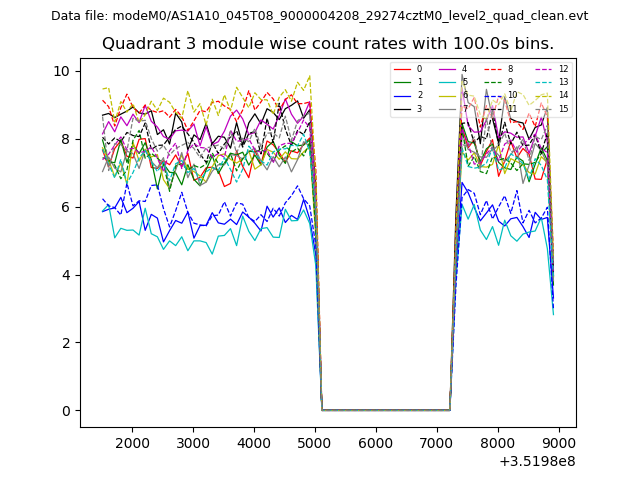
| Module-wise count rates for Quadrant C Data is divided into 100 sec bins |
 |
 |
| Module-wise count rates for Quadrant D Data is divided into 100 sec bins |
 |
 |
| Parameter | Plot |
|---|---|
| CZT HV Monitor | 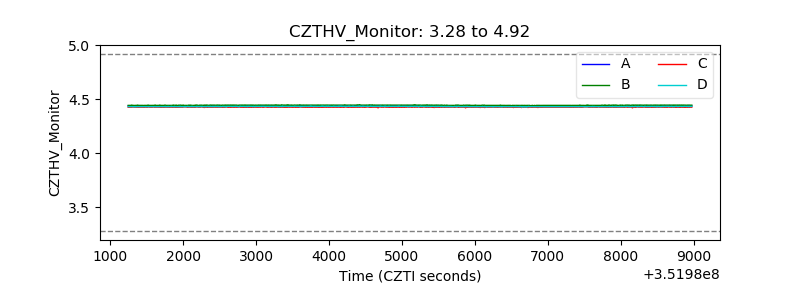 |
| D_VDD |  |
| Temperature 1 | 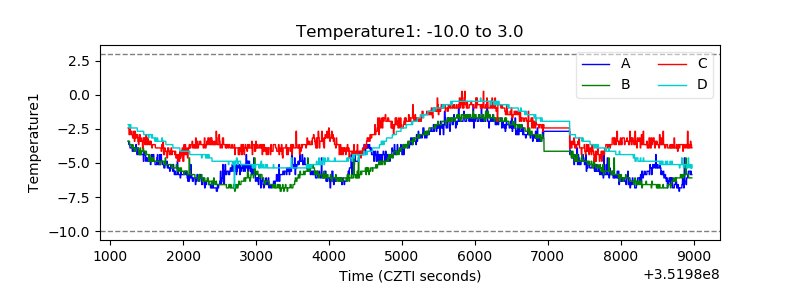 |
| Veto HV Monitor | 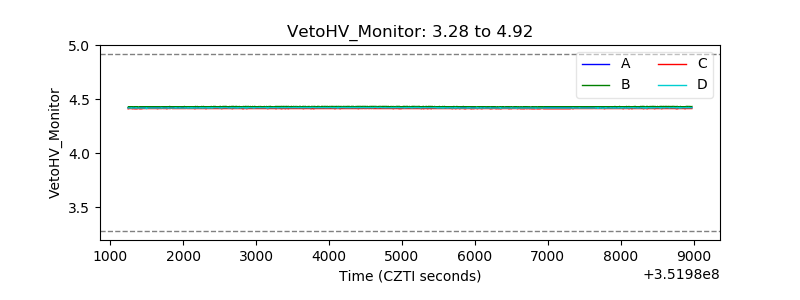 |
| Veto LLD | 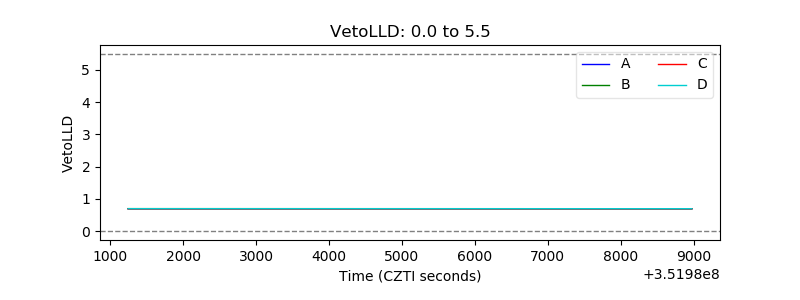 |
| Alpha Counter | 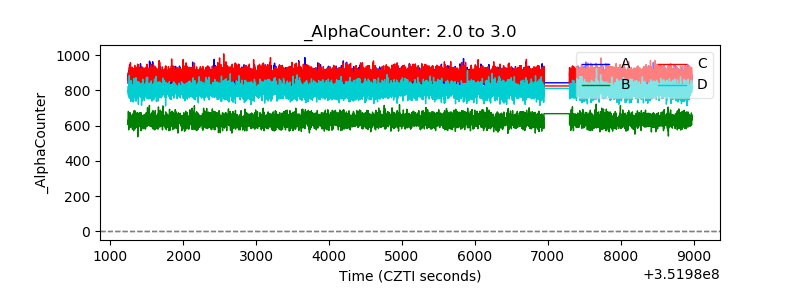 |
| _CPM_Rate | 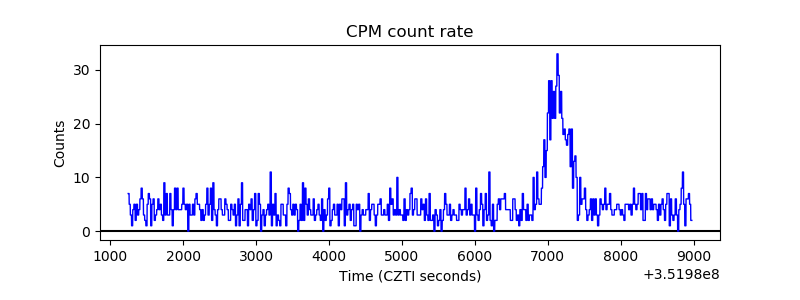 |
| CZT Counter | 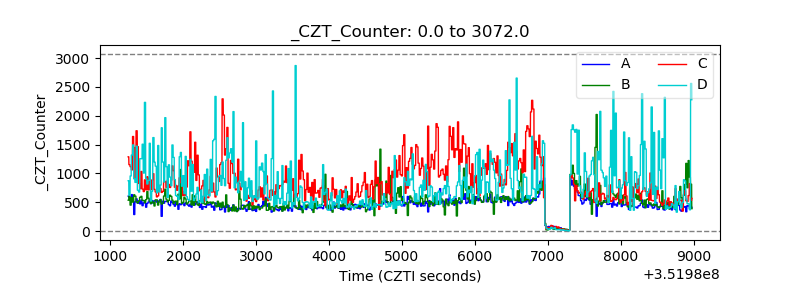 |
| +2.5 Volts monitor |  |
| +5 Volts monitor |  |
| _ROLL_ROT | 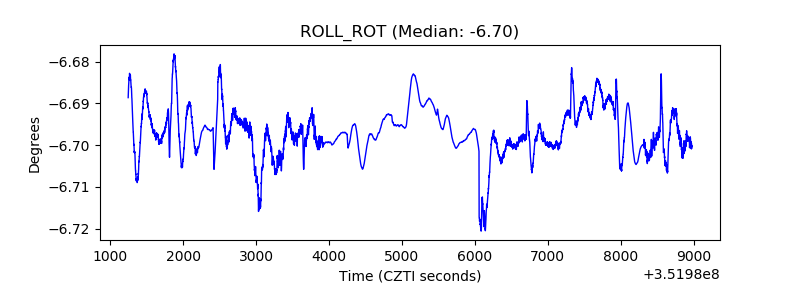 |
| _Roll_DEC |  |
| _Roll_RA | 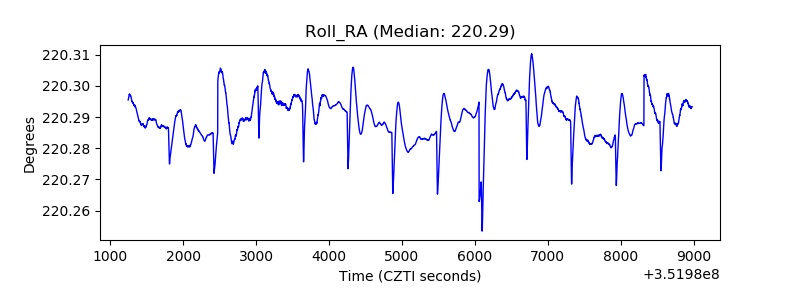 |
| Veto Counter | 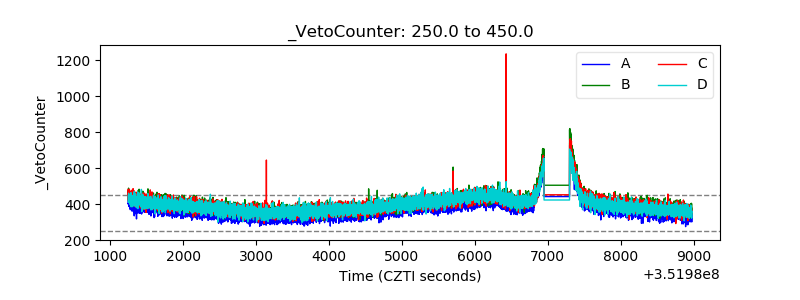 |