| Param | Original file | Final file |
|---|---|---|
| Filename | modeM0/AS1A10_045T08_9000004208_29277cztM0_level2.evt | modeM0/AS1A10_045T08_9000004208_29277cztM0_level2_quad_clean.evt |
| Size (bytes) | 510,223,680 | 70,600,320 |
| Size | 486.6 MB | 67.3 MB |
| Events in quadrant A | 2,626,929 | 441,931 |
| Events in quadrant B | 3,020,493 | 449,899 |
| Events in quadrant C | 4,285,497 | 431,139 |
| Events in quadrant D | 5,141,751 | 425,105 |
| Mode SS | |||
|---|---|---|---|
| Quadrant | BADHDUFLAG | Total packets | Discarded packets |
| A | 0 | 112 | 0 |
| B | 0 | 112 | 0 |
| C | 0 | 112 | 0 |
| D | 0 | 112 | 0 |
| Mode M0 | |||
|---|---|---|---|
| Quadrant | BADHDUFLAG | Total packets | Discarded packets |
| A | 0 | 11539 | 1 |
| B | 0 | 12737 | 1 |
| C | 0 | 16706 | 1 |
| D | 0 | 19190 | 1 |
| Mode M9 | |||
|---|---|---|---|
| Quadrant | BADHDUFLAG | Total packets | Discarded packets |
| A | 0 | 4 | 0 |
| B | 0 | 4 | 0 |
| C | 0 | 4 | 0 |
| D | 0 | 4 | 0 |
| Quadrant | Total seconds | Saturated seconds | Saturation percentage |
|---|---|---|---|
| A | 5574 | 41 | 0.735558% |
| B | 5574 | 100 | 1.794044% |
| C | 5574 | 431 | 7.732329% |
| D | 5574 | 487 | 8.736993% |
Noise dominated data is calculated using 1-second bins in cleaned event files. If a bin has >2000 counts, and if more than 50% of those come from <1% of pixels, then it is considered to be noise-dominated and hence unusable.
| Quadrant | # 1 sec bins | Bins with >0 counts | Bins with >2000 counts | High rate bins dominated by noise | Noise dominated (total time) | Noise dominated (detector-on time) | Marked lightcurve |
|---|---|---|---|---|---|---|---|
| A | 5924 | 5575 | 0 | 0 | 0.00% | 0.00% | 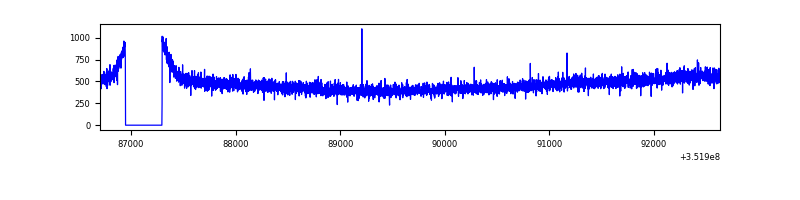 |
| B | 5924 | 5575 | 7 | 7 | 0.12% | 0.13% | 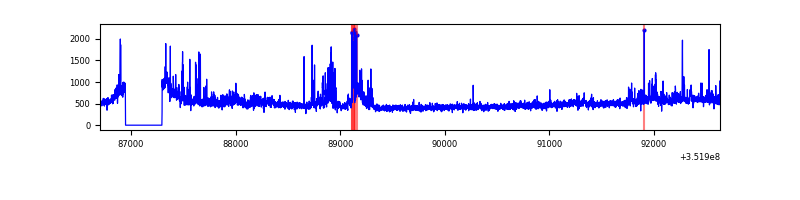 |
| C | 5924 | 5574 | 37 | 37 | 0.62% | 0.66% |  |
| D | 5924 | 5575 | 295 | 295 | 4.98% | 5.29% | 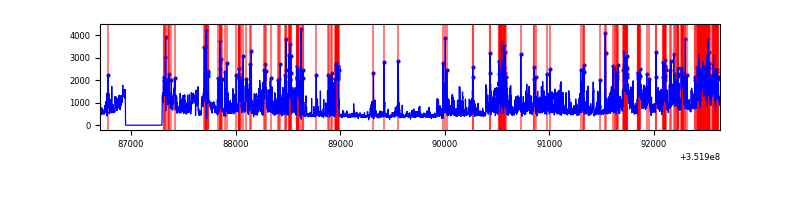 |
Top three noisy pixels from each quadrant. If the there are fewer than three noisy pixels in the level2.evt file, extra rows are filled as -1
| Pixel properties | Quadrant properties | ||||||
|---|---|---|---|---|---|---|---|
| Quadrant | DetID | PixID | Counts | Sigma | Mean | Median | Sigma |
| A | 13 | 254 | 10226 | 68.69 | 680 | 666 | 139.2 |
| A | 3 | 137 | 6959 | 45.22 | 680 | 666 | 139.2 |
| A | 0 | 226 | 5824 | 37.06 | 680 | 666 | 139.2 |
| B | 10 | 245 | 174173 | 1315.69 | 674 | 657 | 131.9 |
| B | 0 | 229 | 103959 | 783.29 | 674 | 657 | 131.9 |
| B | 0 | 183 | 70786 | 531.76 | 674 | 657 | 131.9 |
| C | 3 | 233 | 1525784 | 10204.09 | 632 | 636 | 149.5 |
| C | 14 | 238 | 162572 | 1083.44 | 632 | 636 | 149.5 |
| C | 14 | 254 | 90668 | 602.36 | 632 | 636 | 149.5 |
| D | 8 | 195 | 1004792 | 5967.83 | 638 | 626 | 168.3 |
| D | 1 | 52 | 995494 | 5912.57 | 638 | 626 | 168.3 |
| D | 7 | 80 | 341981 | 2028.7 | 638 | 626 | 168.3 |
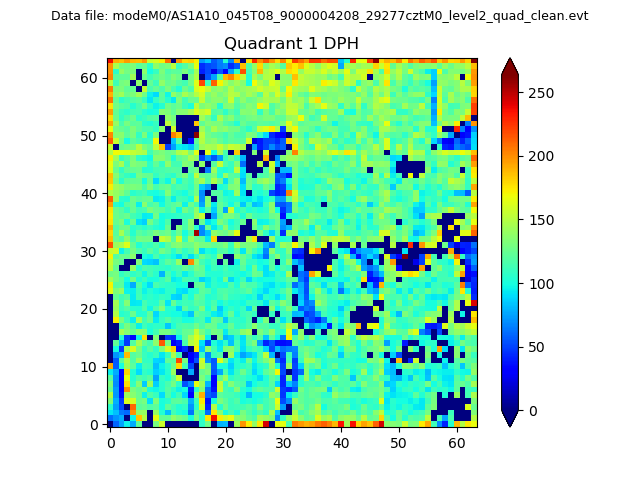
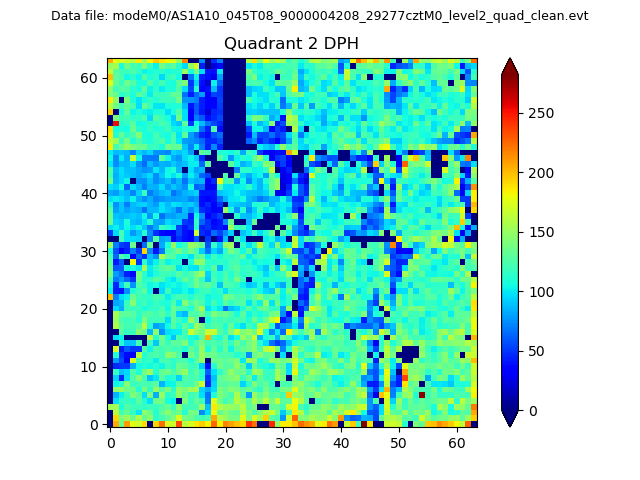
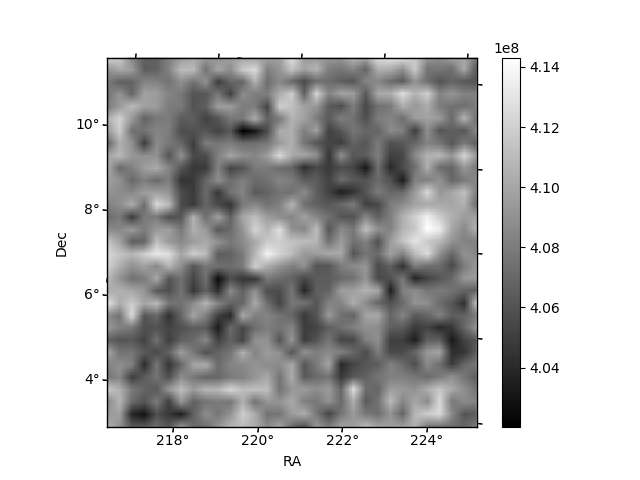
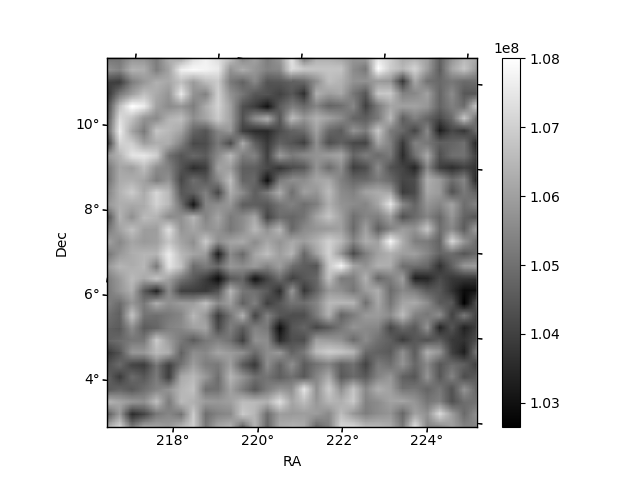
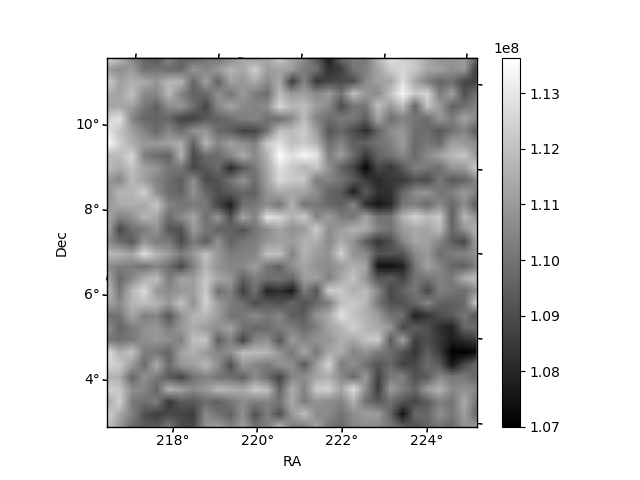
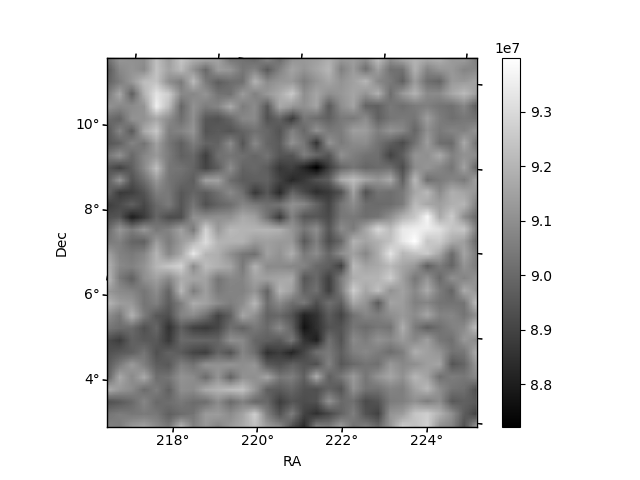
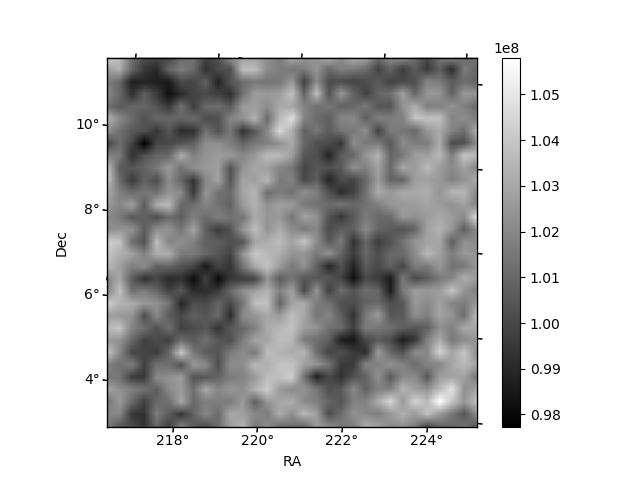
Histogram calculated using DETX and DETY for each event in the final _common_clean file
| Quadrant A | 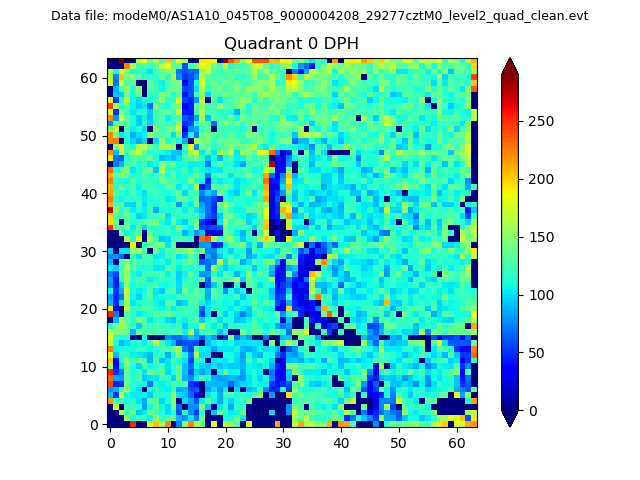 |
 |
Quadrant B |
|---|---|---|---|
| Quadrant D | 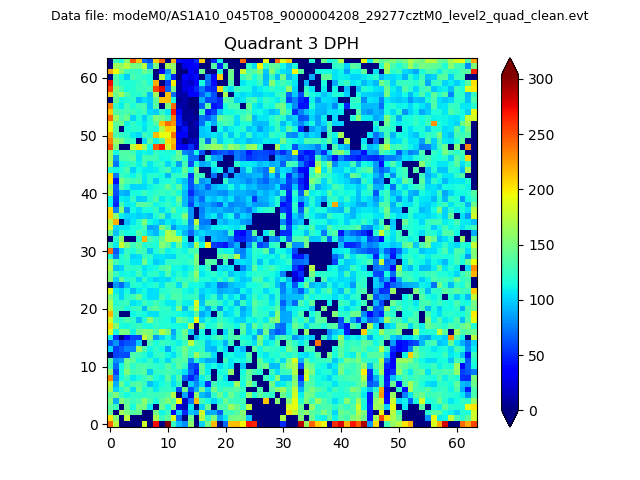 |
 |
Quadrant C |
| Plot type | Count rate plots | Images |
|---|---|---|
| Comparison with Poisson distribution Blue bars denote a histogram of data divided into 1 sec bins. Red curve is a Poisson curve with rate = median count rate of data. |
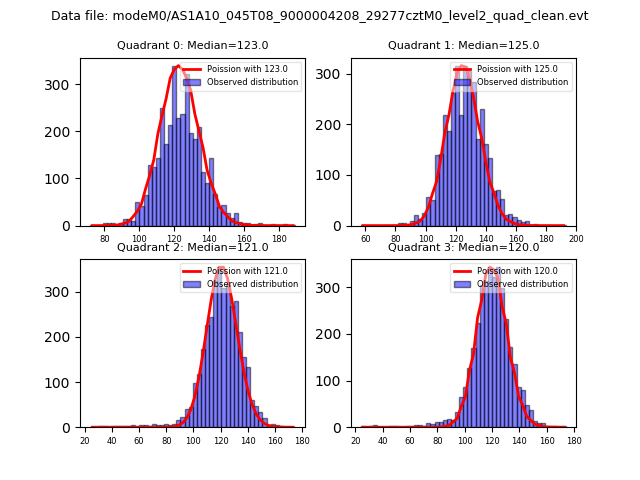 |
 |
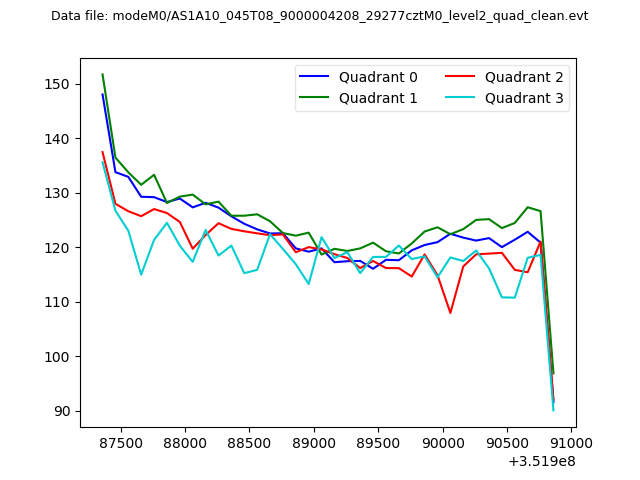
| Quadrant-wise count rates Data is divided into 100 sec bins |
 |
|
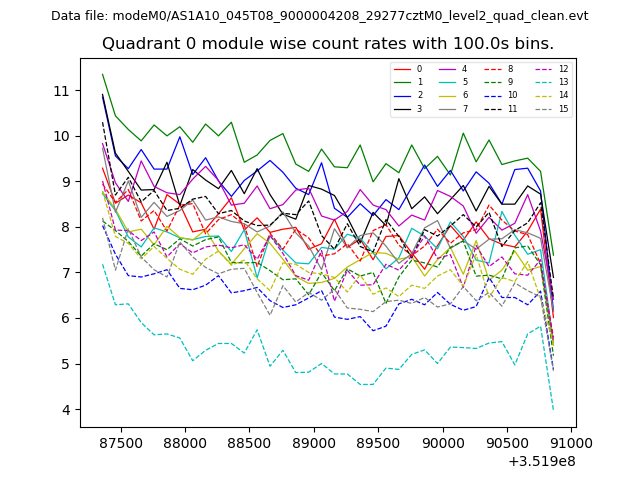
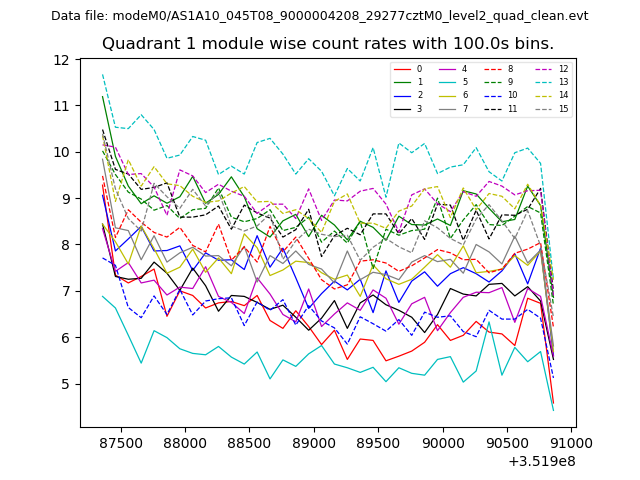
| Module-wise count rates for Quadrant A Data is divided into 100 sec bins |
 |
 |
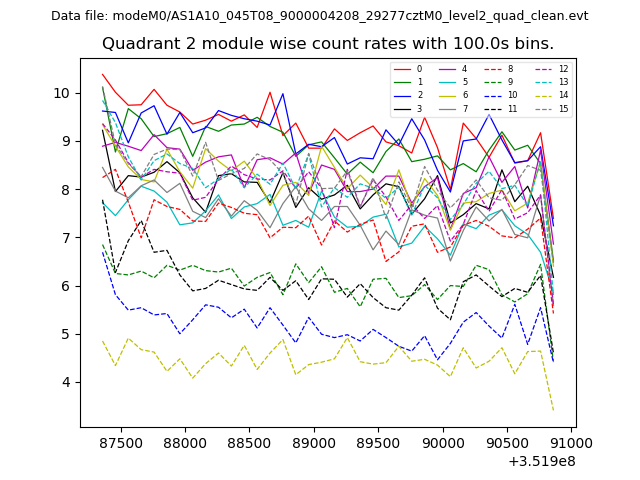
| Module-wise count rates for Quadrant B Data is divided into 100 sec bins |
 |
 |
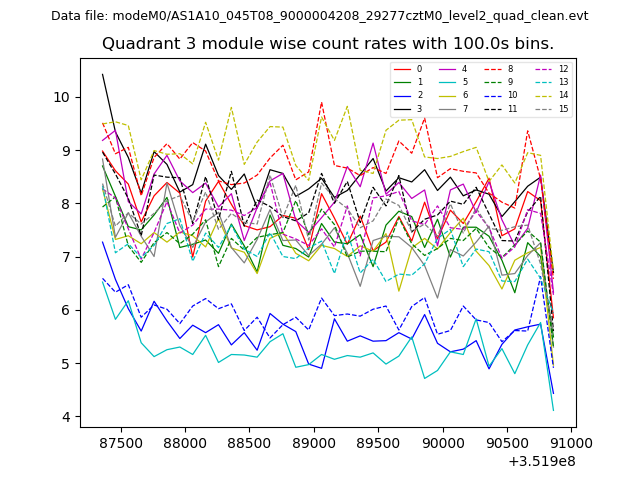
| Module-wise count rates for Quadrant C Data is divided into 100 sec bins |
 |
 |
| Module-wise count rates for Quadrant D Data is divided into 100 sec bins |
 |
 |
| Parameter | Plot |
|---|---|
| CZT HV Monitor | 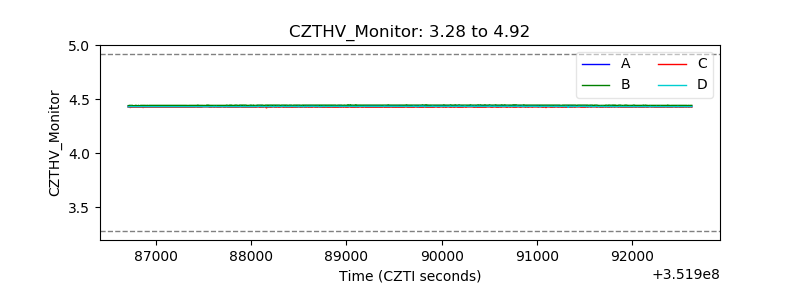 |
| D_VDD | 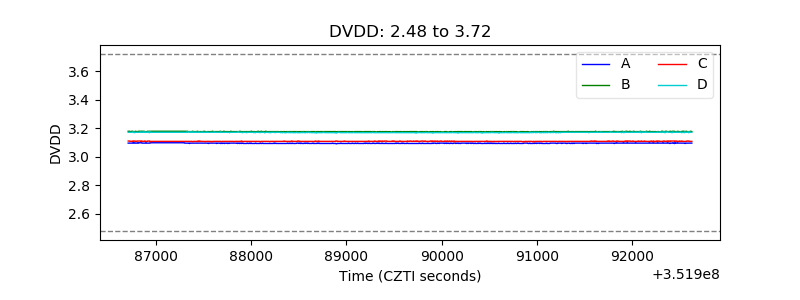 |
| Temperature 1 | 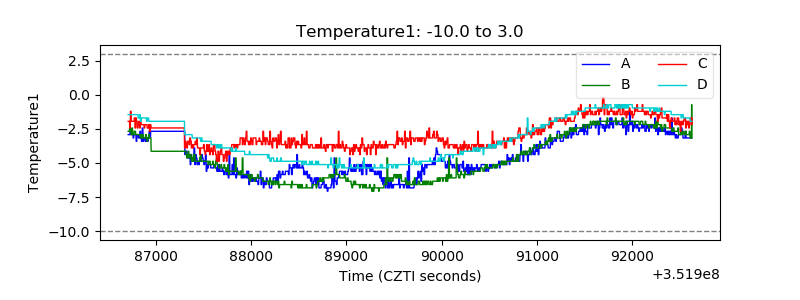 |
| Veto HV Monitor | 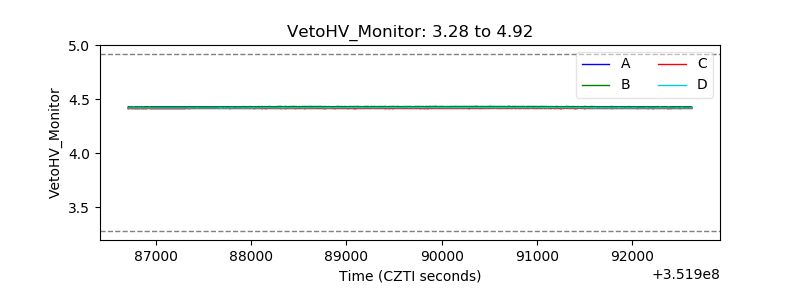 |
| Veto LLD | 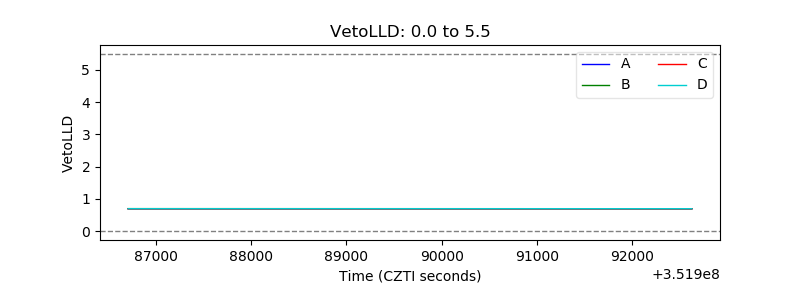 |
| Alpha Counter | 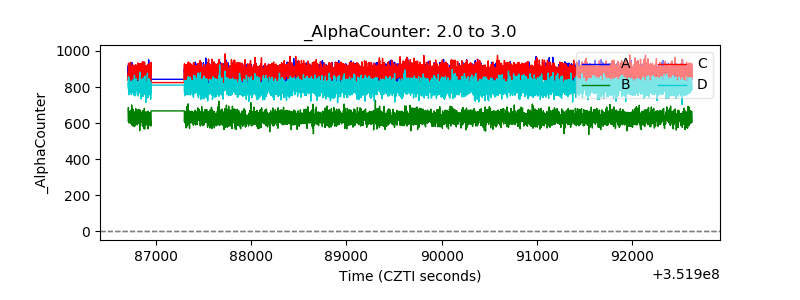 |
| _CPM_Rate | 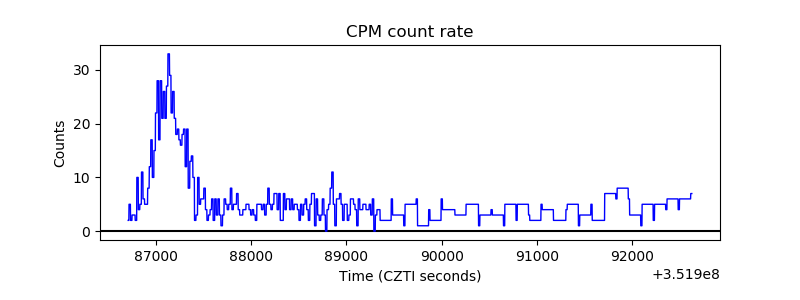 |
| CZT Counter | 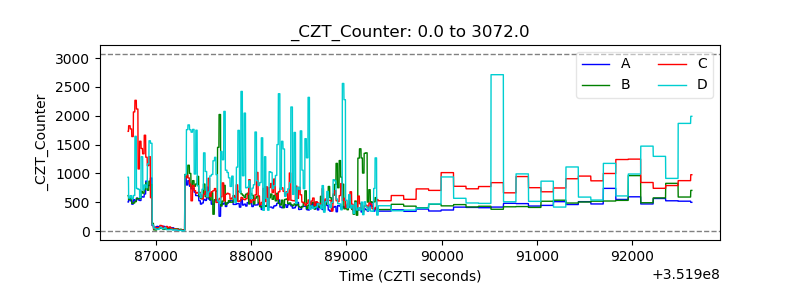 |
| +2.5 Volts monitor |  |
| +5 Volts monitor | 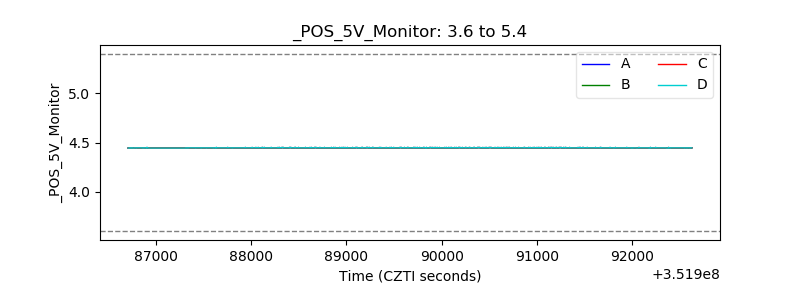 |
| _ROLL_ROT |  |
| _Roll_DEC |  |
| _Roll_RA | 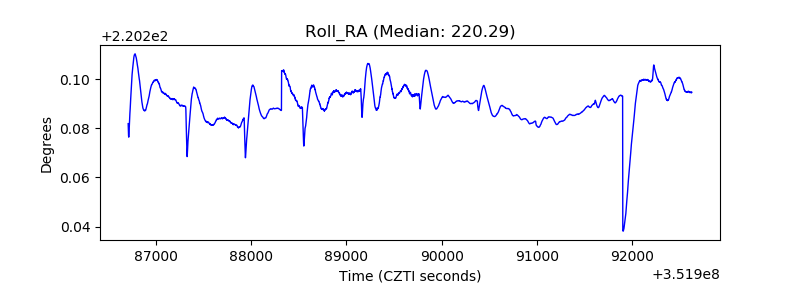 |
| Veto Counter | 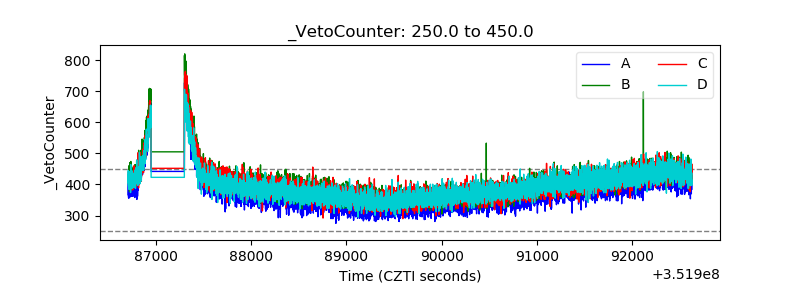 |