| Param | Original file | Final file |
|---|---|---|
| Filename | modeM0/AS1A10_045T08_9000004208_29278cztM0_level2.evt | modeM0/AS1A10_045T08_9000004208_29278cztM0_level2_quad_clean.evt |
| Size (bytes) | 1,755,662,400 | 232,606,080 |
| Size | 1.6 GB | 221.8 MB |
| Events in quadrant A | 9,063,254 | 1,457,703 |
| Events in quadrant B | 10,546,358 | 1,489,237 |
| Events in quadrant C | 14,024,107 | 1,385,173 |
| Events in quadrant D | 18,254,135 | 1,399,185 |
| Mode SS | |||
|---|---|---|---|
| Quadrant | BADHDUFLAG | Total packets | Discarded packets |
| A | 0 | 390 | 0 |
| B | 0 | 390 | 0 |
| C | 0 | 390 | 0 |
| D | 0 | 390 | 0 |
| Mode M0 | |||
|---|---|---|---|
| Quadrant | BADHDUFLAG | Total packets | Discarded packets |
| A | 0 | 39109 | 4 |
| B | 0 | 43891 | 4 |
| C | 0 | 55332 | 4 |
| D | 0 | 67547 | 4 |
| Mode M9 | |||
|---|---|---|---|
| Quadrant | BADHDUFLAG | Total packets | Discarded packets |
| A | 0 | 30 | 0 |
| B | 0 | 30 | 0 |
| C | 0 | 30 | 0 |
| D | 0 | 30 | 0 |
| Quadrant | Total seconds | Saturated seconds | Saturation percentage |
|---|---|---|---|
| A | 19057 | 116 | 0.608700% |
| B | 19057 | 359 | 1.883822% |
| C | 19058 | 1359 | 7.130864% |
| D | 19057 | 1338 | 7.021042% |
Noise dominated data is calculated using 1-second bins in cleaned event files. If a bin has >2000 counts, and if more than 50% of those come from <1% of pixels, then it is considered to be noise-dominated and hence unusable.
| Quadrant | # 1 sec bins | Bins with >0 counts | Bins with >2000 counts | High rate bins dominated by noise | Noise dominated (total time) | Noise dominated (detector-on time) | Marked lightcurve |
|---|---|---|---|---|---|---|---|
| A | 22062 | 19061 | 0 | 0 | 0.00% | 0.00% | 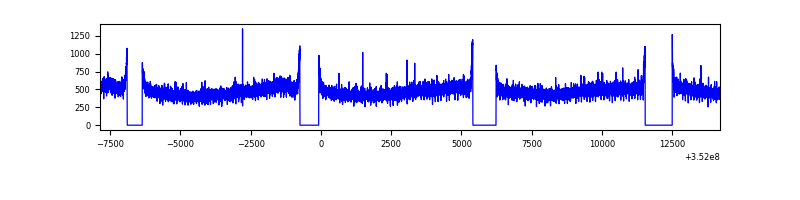 |
| B | 22062 | 19061 | 66 | 66 | 0.30% | 0.35% | 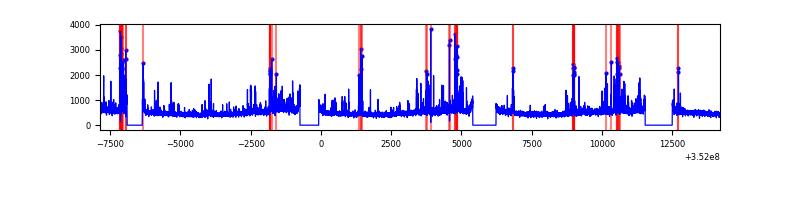 |
| C | 22063 | 19062 | 16 | 16 | 0.07% | 0.08% | 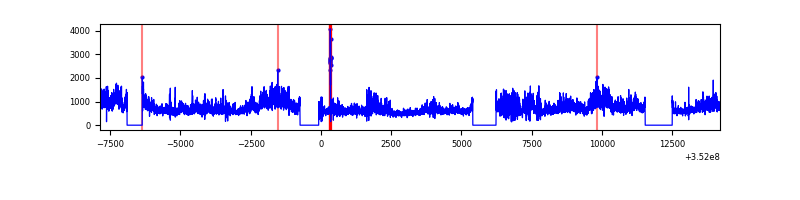 |
| D | 22062 | 19060 | 945 | 945 | 4.28% | 4.96% | 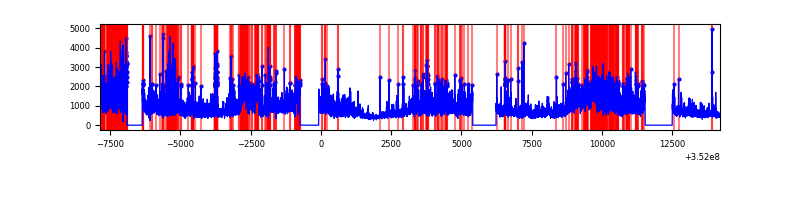 |
Top three noisy pixels from each quadrant. If the there are fewer than three noisy pixels in the level2.evt file, extra rows are filled as -1
| Pixel properties | Quadrant properties | ||||||
|---|---|---|---|---|---|---|---|
| Quadrant | DetID | PixID | Counts | Sigma | Mean | Median | Sigma |
| A | 13 | 254 | 35590 | 70.72 | 2347 | 2300 | 470.7 |
| A | 3 | 137 | 23477 | 44.99 | 2347 | 2300 | 470.7 |
| A | 0 | 226 | 19661 | 36.88 | 2347 | 2300 | 470.7 |
| B | 0 | 229 | 714307 | 1609.7 | 2318 | 2256 | 442.4 |
| B | 10 | 245 | 286790 | 643.23 | 2318 | 2256 | 442.4 |
| B | 0 | 183 | 275384 | 617.45 | 2318 | 2256 | 442.4 |
| C | 3 | 233 | 4376352 | 8541.83 | 2196 | 2209 | 512.1 |
| C | 14 | 238 | 590977 | 1149.75 | 2196 | 2209 | 512.1 |
| C | 14 | 254 | 346090 | 671.53 | 2196 | 2209 | 512.1 |
| D | 7 | 80 | 3827734 | 6605.2 | 2212 | 2171 | 579.2 |
| D | 8 | 195 | 2768686 | 4776.65 | 2212 | 2171 | 579.2 |
| D | 1 | 52 | 2073196 | 3575.82 | 2212 | 2171 | 579.2 |
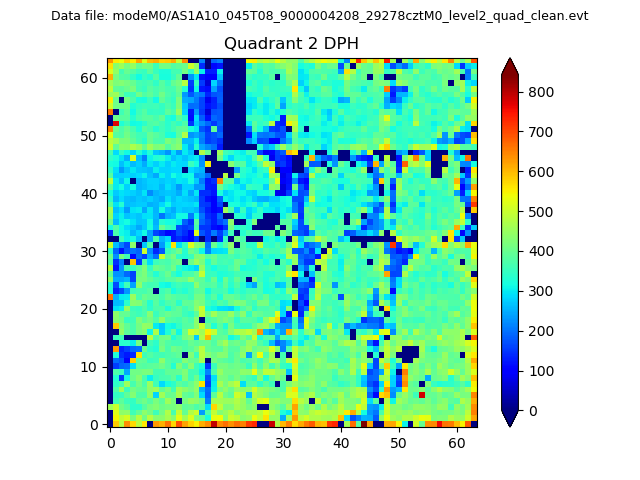
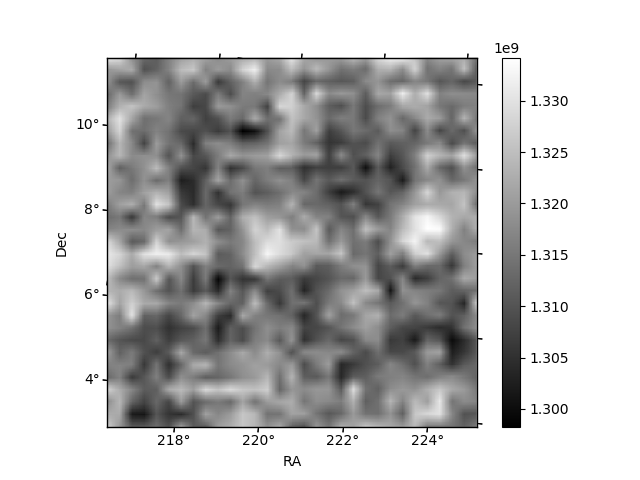
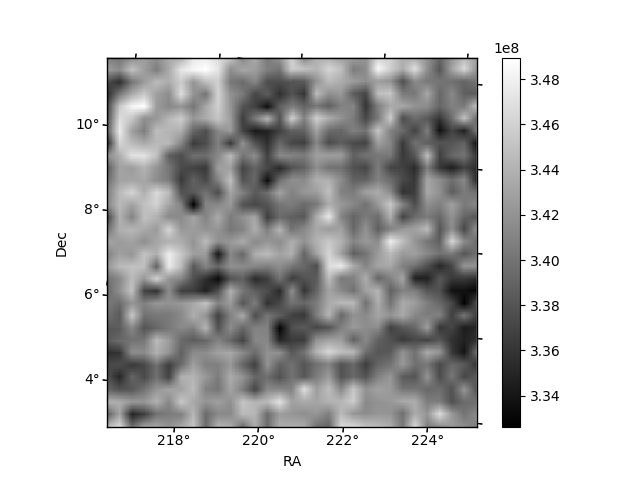
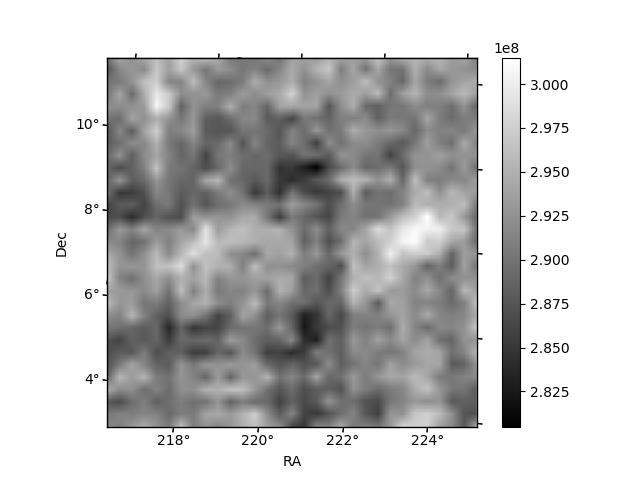
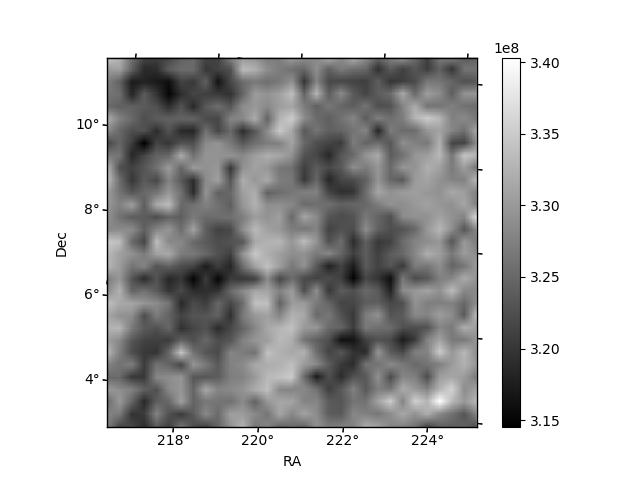
Histogram calculated using DETX and DETY for each event in the final _common_clean file
| Quadrant A | 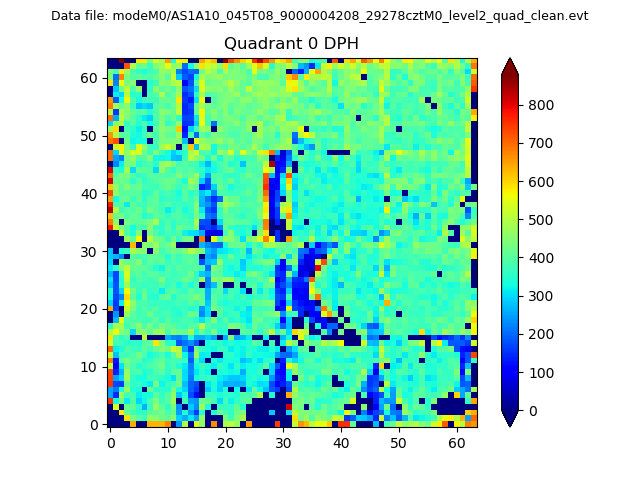 |
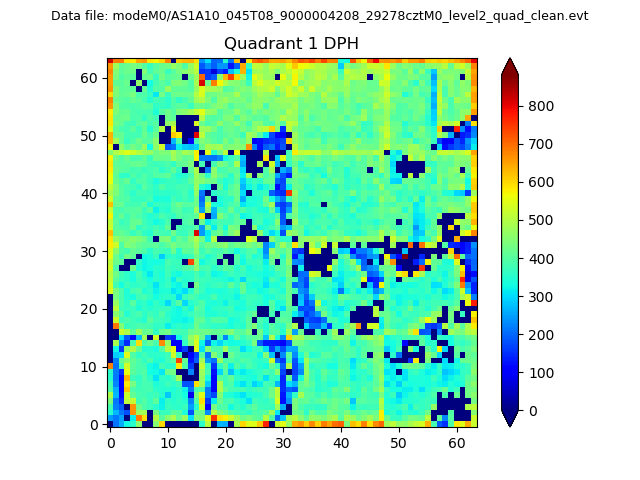 |
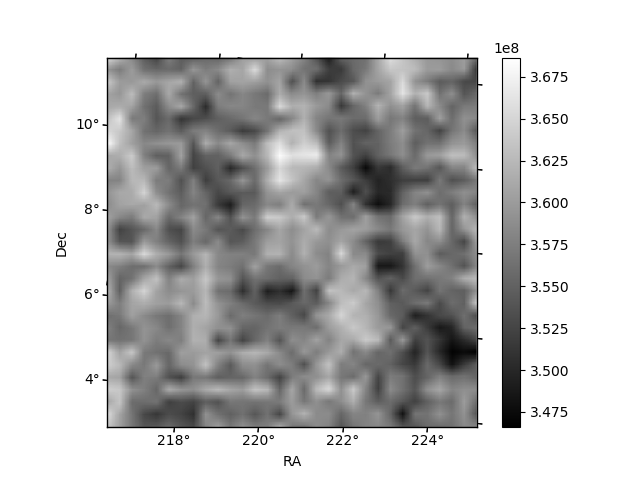
Quadrant B |
|---|---|---|---|
| Quadrant D | 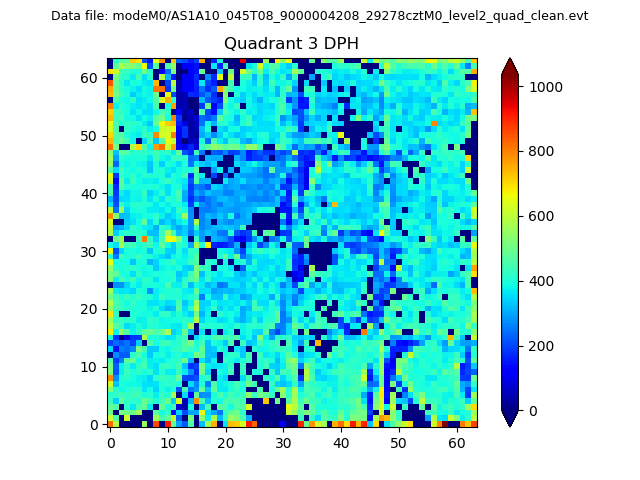 |
 |
Quadrant C |
| Plot type | Count rate plots | Images |
|---|---|---|
| Comparison with Poisson distribution Blue bars denote a histogram of data divided into 1 sec bins. Red curve is a Poisson curve with rate = median count rate of data. |
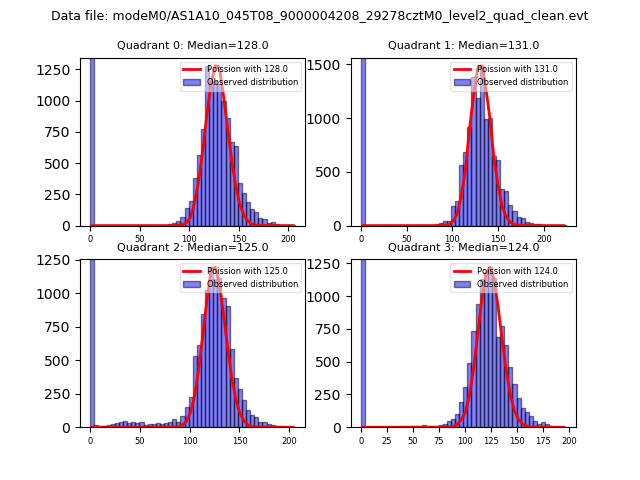 |
 |
| Quadrant-wise count rates Data is divided into 100 sec bins |
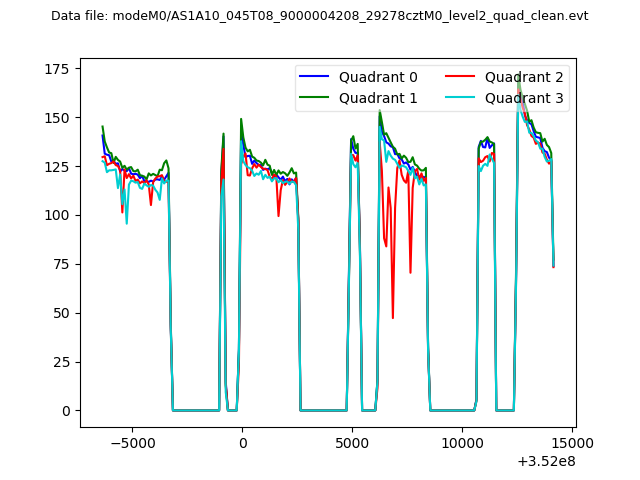 |
|
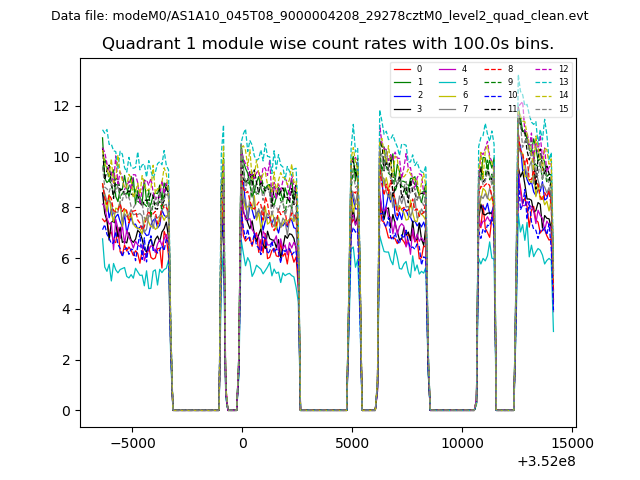
| Module-wise count rates for Quadrant A Data is divided into 100 sec bins |
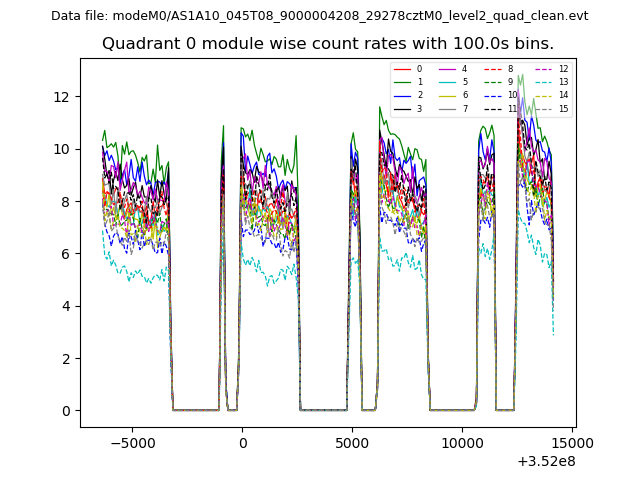 |
 |
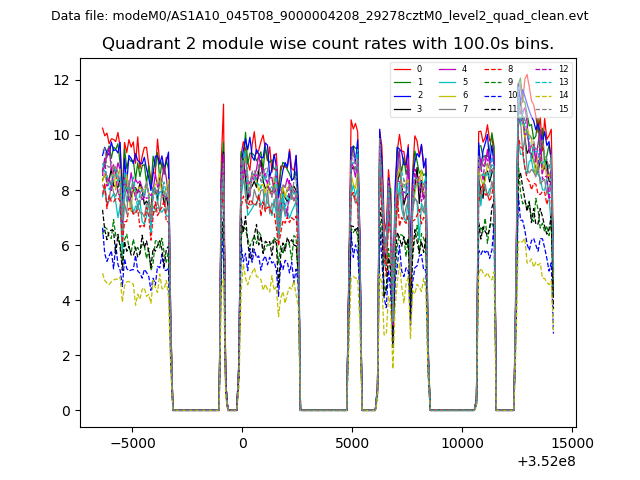
| Module-wise count rates for Quadrant B Data is divided into 100 sec bins |
 |
 |
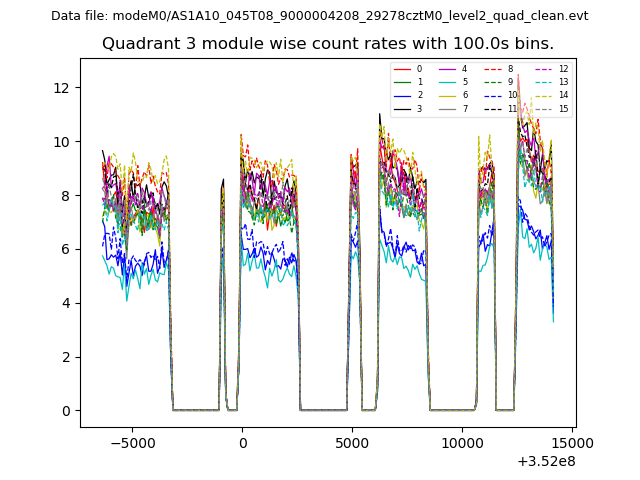
| Module-wise count rates for Quadrant C Data is divided into 100 sec bins |
 |
 |
| Module-wise count rates for Quadrant D Data is divided into 100 sec bins |
 |
 |
| Parameter | Plot |
|---|---|
| CZT HV Monitor | 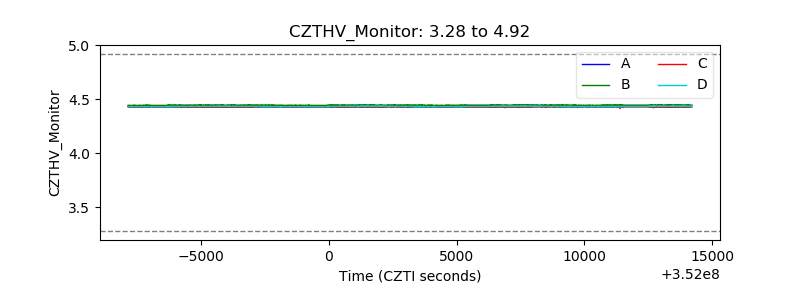 |
| D_VDD | 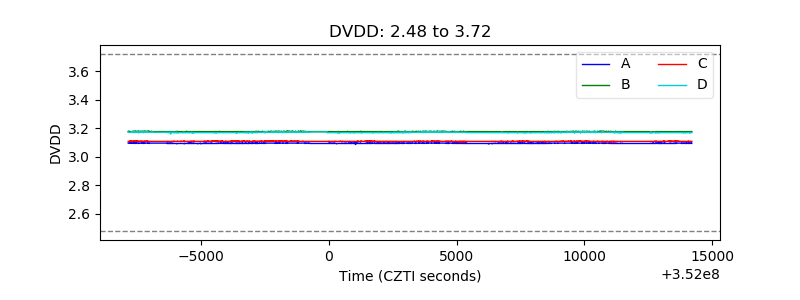 |
| Temperature 1 | 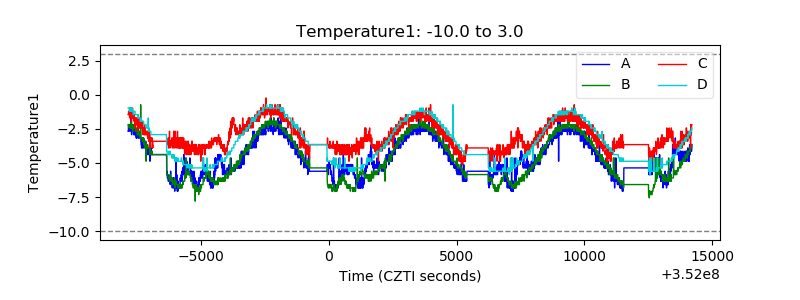 |
| Veto HV Monitor | 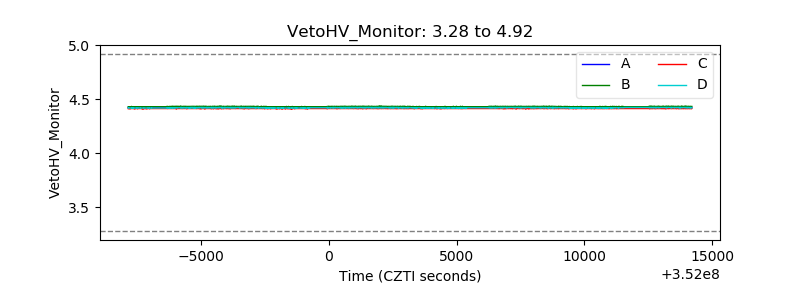 |
| Veto LLD | 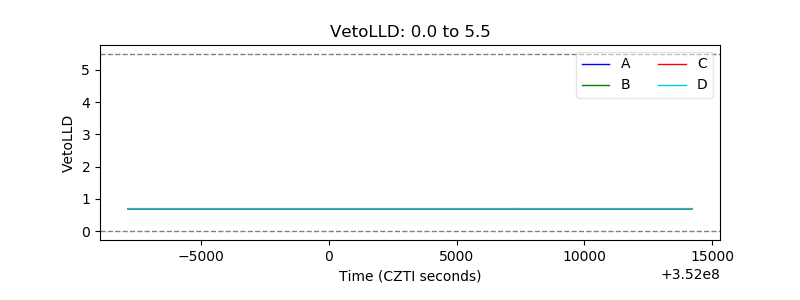 |
| Alpha Counter | 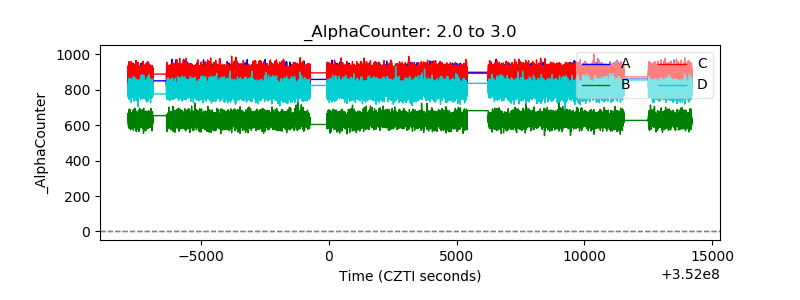 |
| _CPM_Rate | 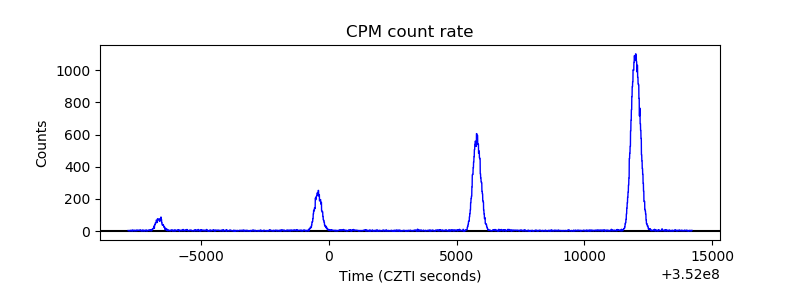 |
| CZT Counter | 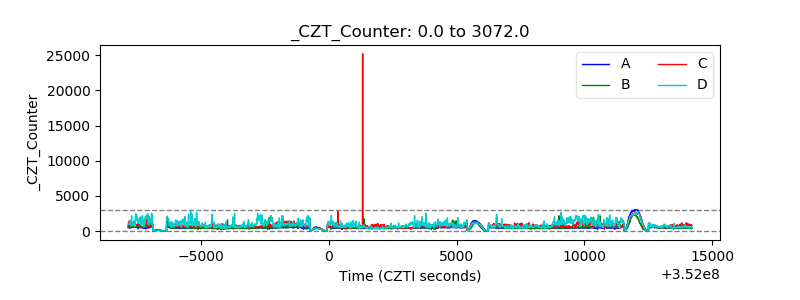 |
| +2.5 Volts monitor | 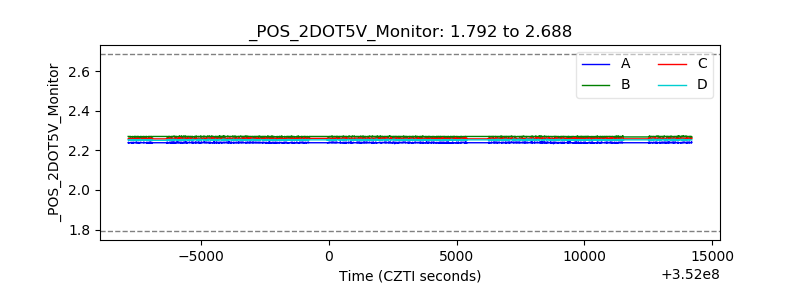 |
| +5 Volts monitor | 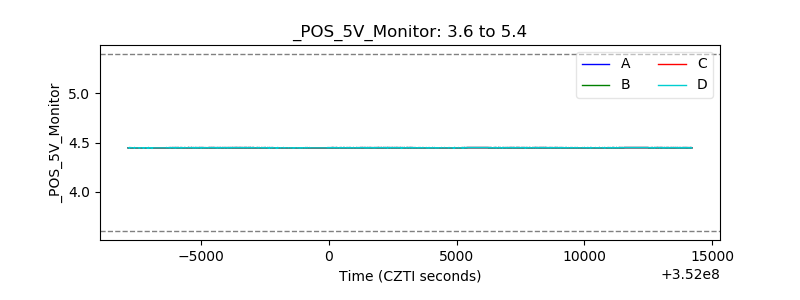 |
| _ROLL_ROT | 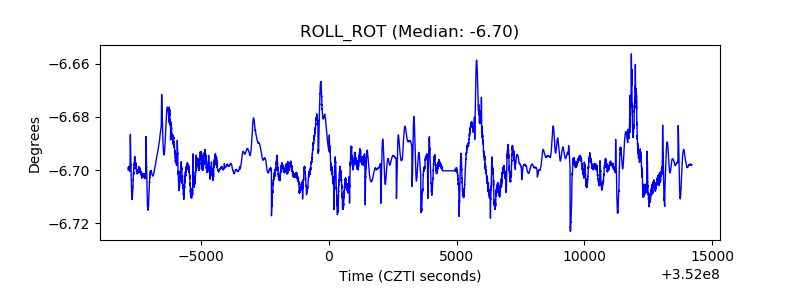 |
| _Roll_DEC | 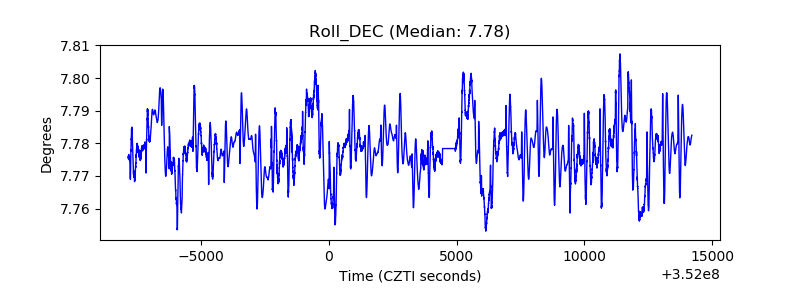 |
| _Roll_RA | 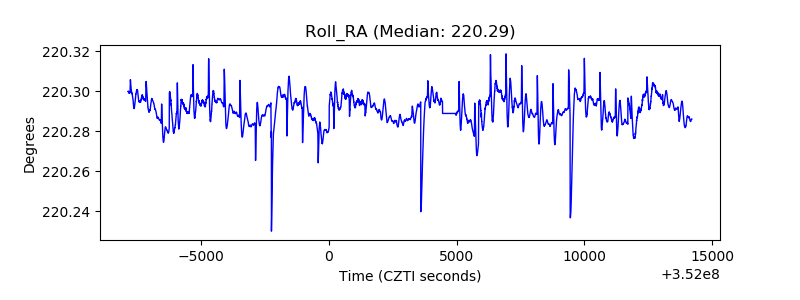 |
| Veto Counter | 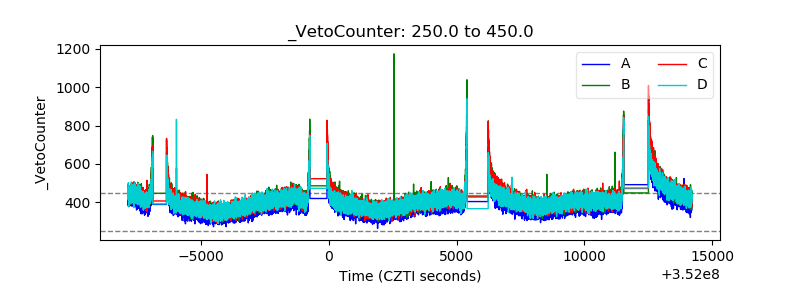 |