| Param | Original file | Final file |
|---|---|---|
| Filename | modeM0/AS1A10_045T08_9000004208_29280cztM0_level2.evt | modeM0/AS1A10_045T08_9000004208_29280cztM0_level2_quad_clean.evt |
| Size (bytes) | 409,962,240 | 59,417,280 |
| Size | 391.0 MB | 56.7 MB |
| Events in quadrant A | 2,367,914 | 368,067 |
| Events in quadrant B | 2,555,291 | 375,688 |
| Events in quadrant C | 3,173,109 | 360,465 |
| Events in quadrant D | 3,987,224 | 351,516 |
| Mode SS | |||
|---|---|---|---|
| Quadrant | BADHDUFLAG | Total packets | Discarded packets |
| A | 0 | 98 | 0 |
| B | 0 | 98 | 0 |
| C | 0 | 98 | 0 |
| D | 0 | 98 | 0 |
| Mode M0 | |||
|---|---|---|---|
| Quadrant | BADHDUFLAG | Total packets | Discarded packets |
| A | 0 | 9928 | 1 |
| B | 0 | 10503 | 1 |
| C | 0 | 12762 | 1 |
| D | 0 | 15248 | 1 |
| Quadrant | Total seconds | Saturated seconds | Saturation percentage |
|---|---|---|---|
| A | 4889 | 11 | 0.224995% |
| B | 4889 | 27 | 0.552260% |
| C | 4890 | 57 | 1.165644% |
| D | 4890 | 262 | 5.357873% |
Noise dominated data is calculated using 1-second bins in cleaned event files. If a bin has >2000 counts, and if more than 50% of those come from <1% of pixels, then it is considered to be noise-dominated and hence unusable.
| Quadrant | # 1 sec bins | Bins with >0 counts | Bins with >2000 counts | High rate bins dominated by noise | Noise dominated (total time) | Noise dominated (detector-on time) | Marked lightcurve |
|---|---|---|---|---|---|---|---|
| A | 4889 | 4889 | 0 | 0 | 0.00% | 0.00% | 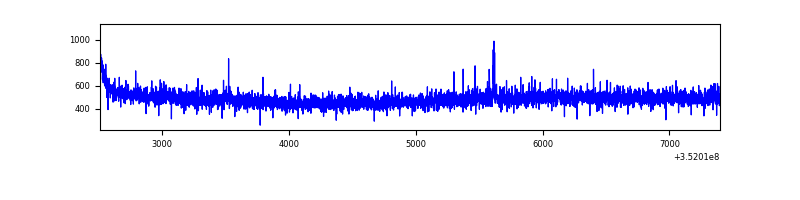 |
| B | 4889 | 4889 | 7 | 7 | 0.14% | 0.14% | 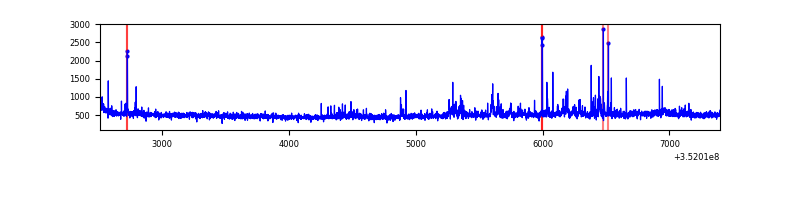 |
| C | 4890 | 4890 | 0 | 0 | 0.00% | 0.00% | 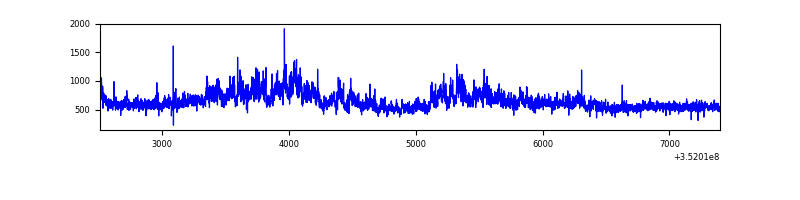 |
| D | 4890 | 4890 | 211 | 211 | 4.31% | 4.31% | 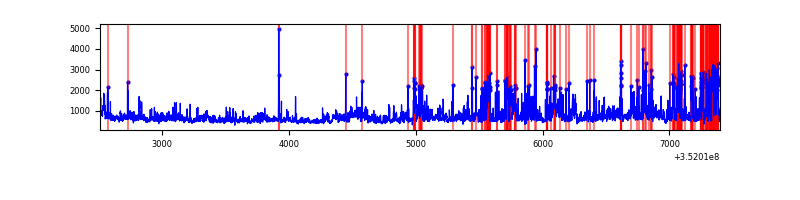 |
Top three noisy pixels from each quadrant. If the there are fewer than three noisy pixels in the level2.evt file, extra rows are filled as -1
| Pixel properties | Quadrant properties | ||||||
|---|---|---|---|---|---|---|---|
| Quadrant | DetID | PixID | Counts | Sigma | Mean | Median | Sigma |
| A | 13 | 254 | 8945 | 68.29 | 610 | 599 | 122.2 |
| A | 5 | 168 | 6928 | 51.78 | 610 | 599 | 122.2 |
| A | 3 | 137 | 5880 | 43.21 | 610 | 599 | 122.2 |
| B | 0 | 229 | 81392 | 695.73 | 600 | 586 | 116.1 |
| B | 0 | 183 | 78705 | 672.59 | 600 | 586 | 116.1 |
| B | 0 | 190 | 15852 | 131.44 | 600 | 586 | 116.1 |
| C | 3 | 233 | 749678 | 5471.45 | 582 | 584 | 136.9 |
| C | 14 | 238 | 96857 | 703.19 | 582 | 584 | 136.9 |
| C | 7 | 247 | 41948 | 302.13 | 582 | 584 | 136.9 |
| D | 1 | 52 | 780129 | 5184.68 | 581 | 568 | 150.4 |
| D | 7 | 80 | 344692 | 2288.69 | 581 | 568 | 150.4 |
| D | 8 | 195 | 317284 | 2106.41 | 581 | 568 | 150.4 |
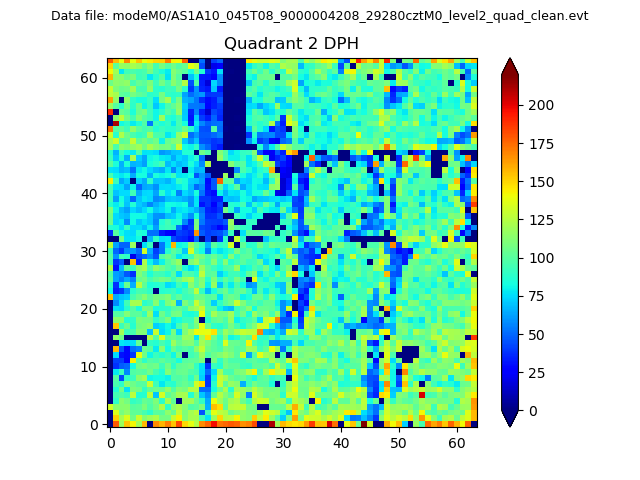
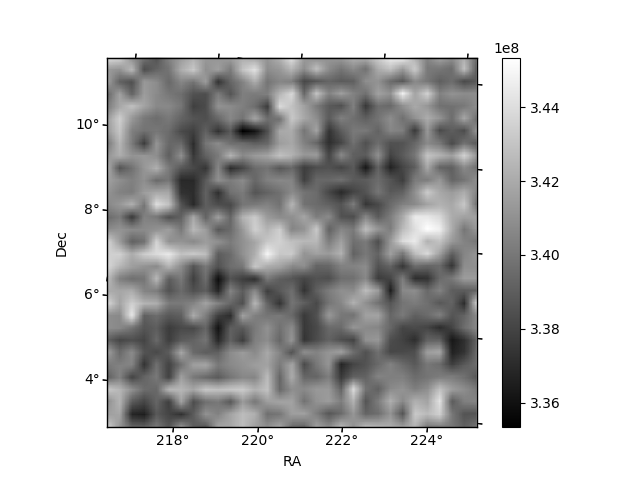
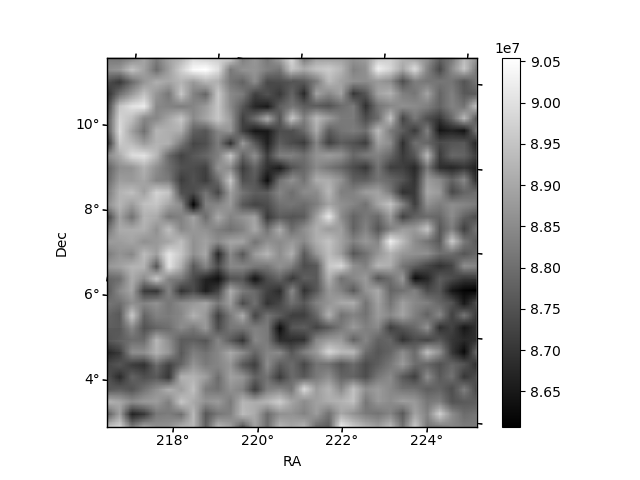
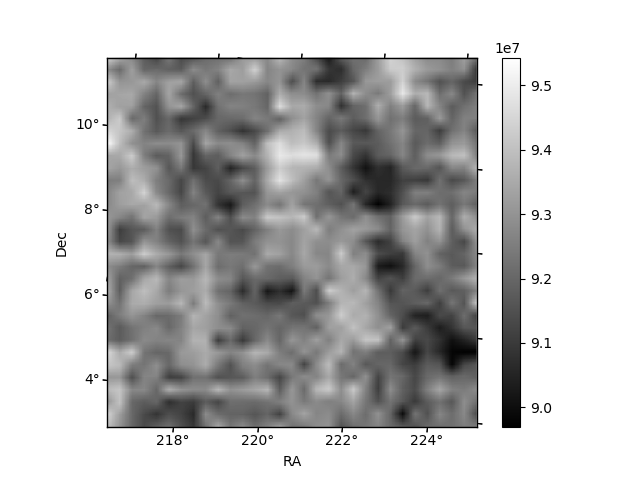
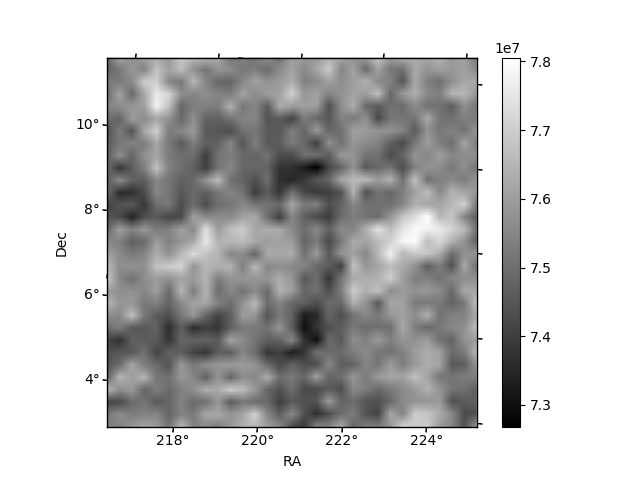
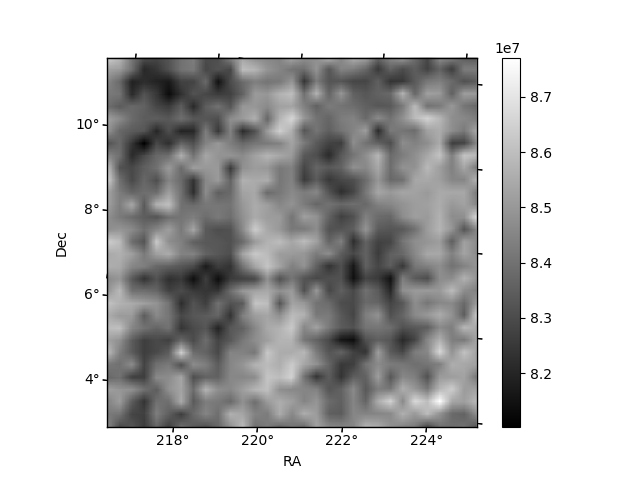
Histogram calculated using DETX and DETY for each event in the final _common_clean file
| Quadrant A | 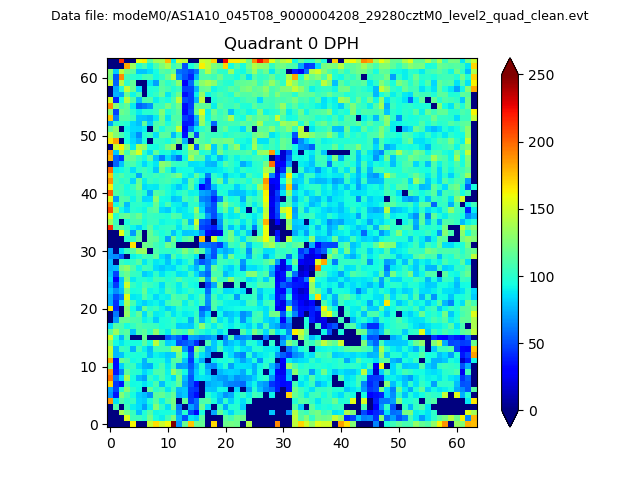 |
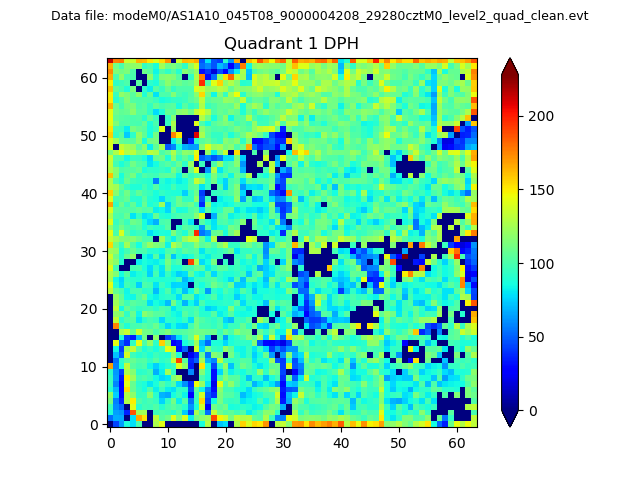 |
Quadrant B |
|---|---|---|---|
| Quadrant D | 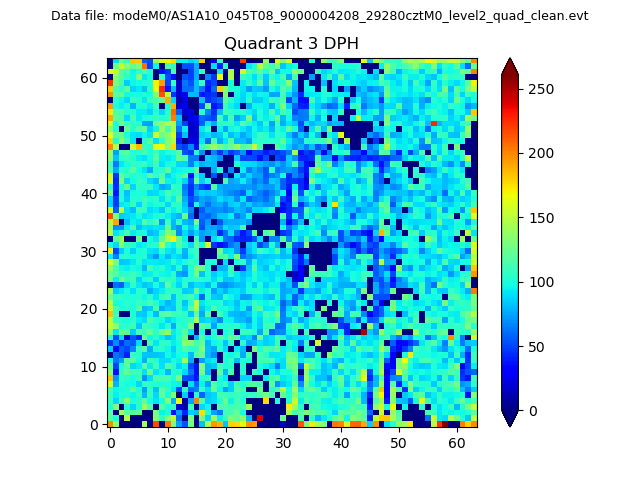 |
 |
Quadrant C |
| Plot type | Count rate plots | Images |
|---|---|---|
| Comparison with Poisson distribution Blue bars denote a histogram of data divided into 1 sec bins. Red curve is a Poisson curve with rate = median count rate of data. |
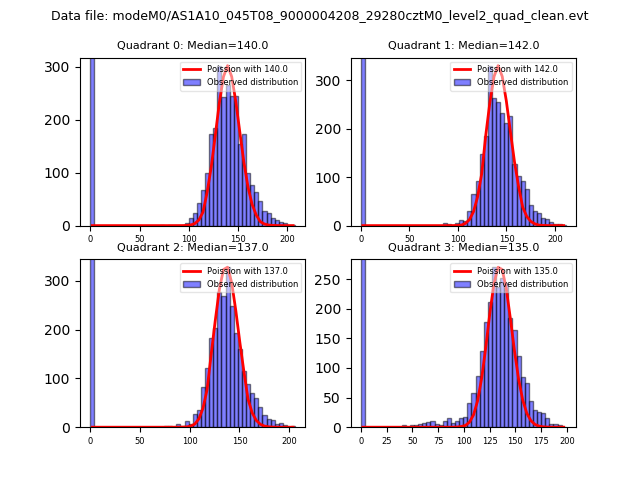 |
 |
| Quadrant-wise count rates Data is divided into 100 sec bins |
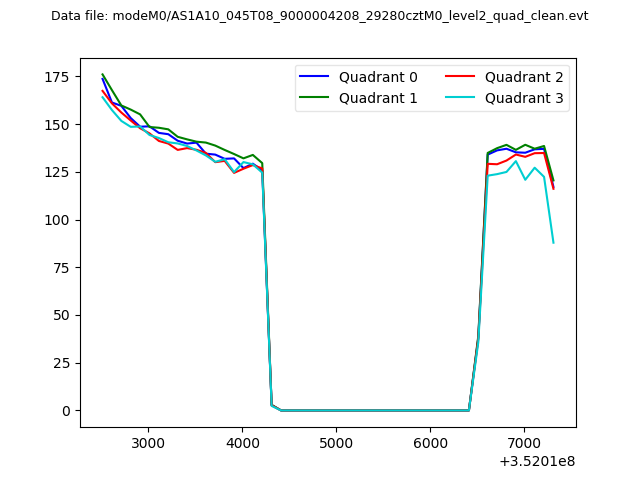 |
|
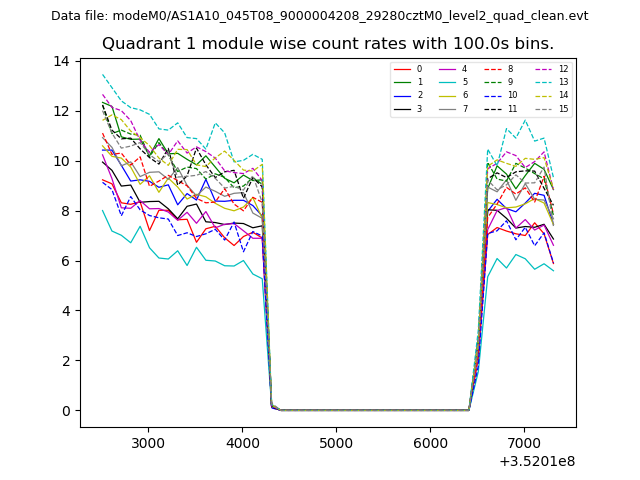
| Module-wise count rates for Quadrant A Data is divided into 100 sec bins |
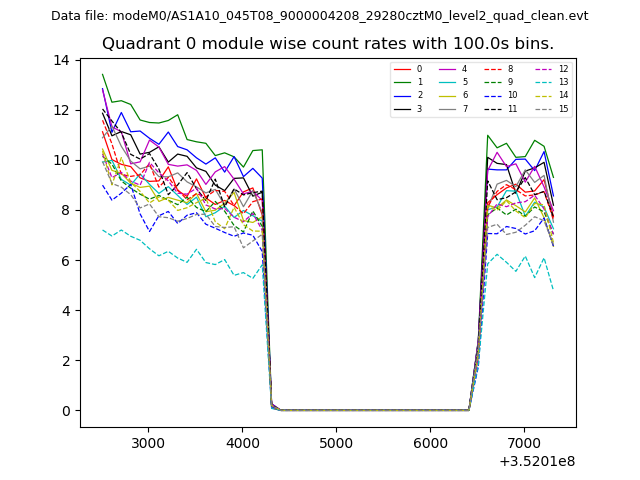 |
 |
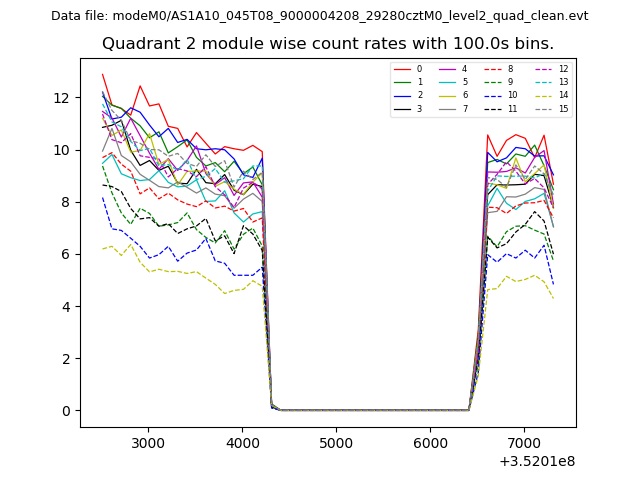
| Module-wise count rates for Quadrant B Data is divided into 100 sec bins |
 |
 |
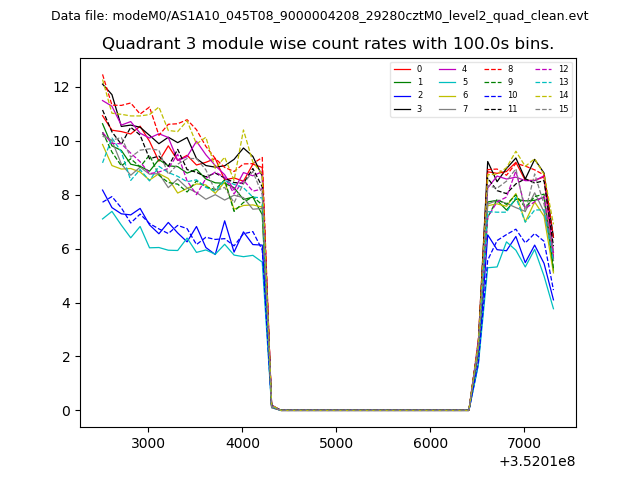
| Module-wise count rates for Quadrant C Data is divided into 100 sec bins |
 |
 |
| Module-wise count rates for Quadrant D Data is divided into 100 sec bins |
 |
 |
| Parameter | Plot |
|---|---|
| CZT HV Monitor | 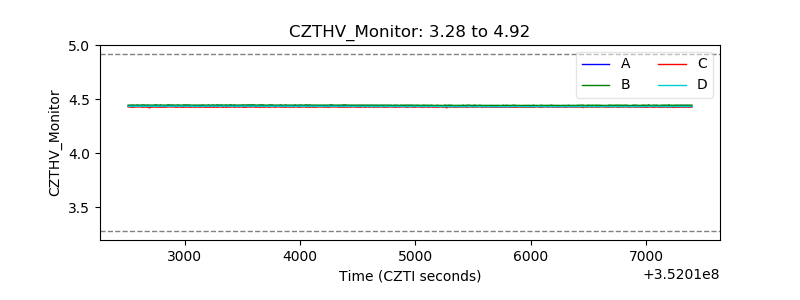 |
| D_VDD | 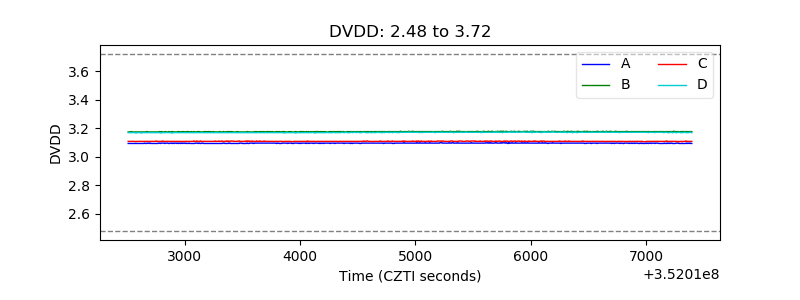 |
| Temperature 1 | 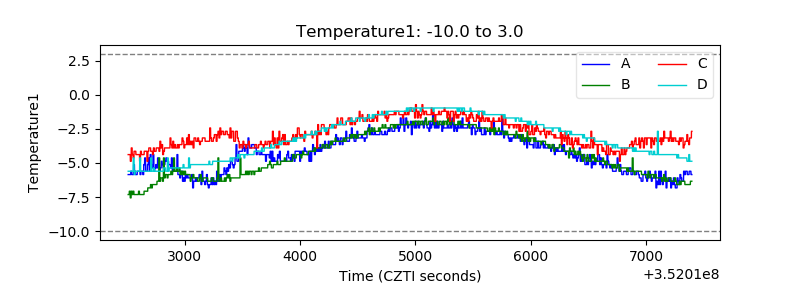 |
| Veto HV Monitor | 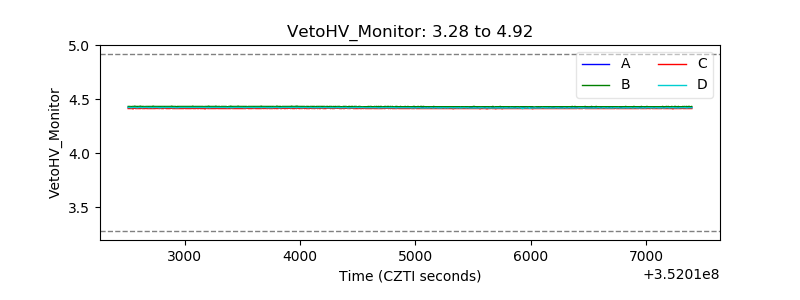 |
| Veto LLD | 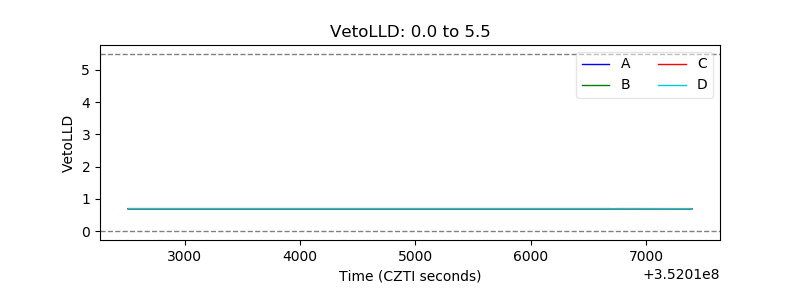 |
| Alpha Counter | 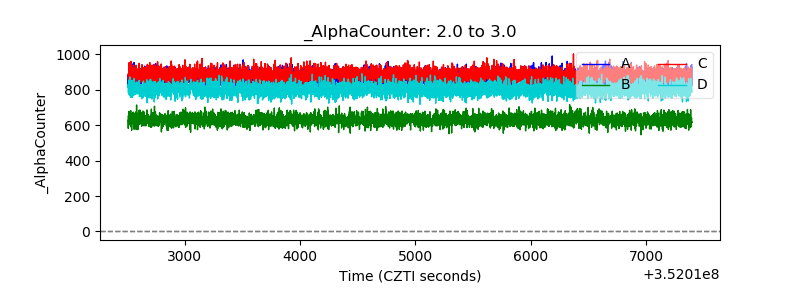 |
| _CPM_Rate | 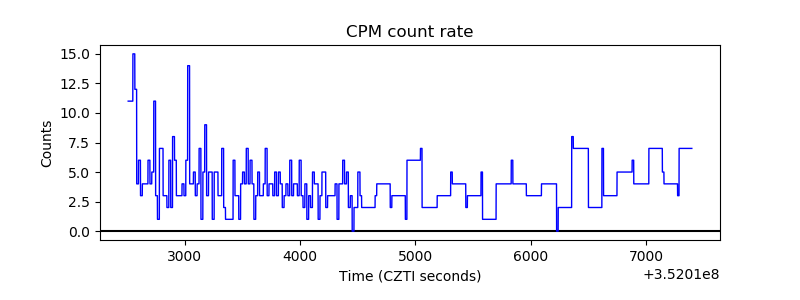 |
| CZT Counter | 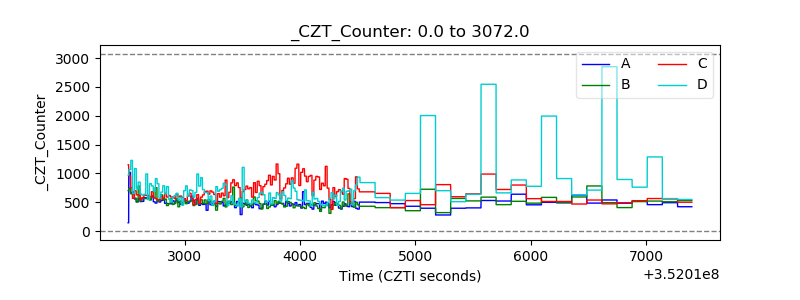 |
| +2.5 Volts monitor |  |
| +5 Volts monitor |  |
| _ROLL_ROT | 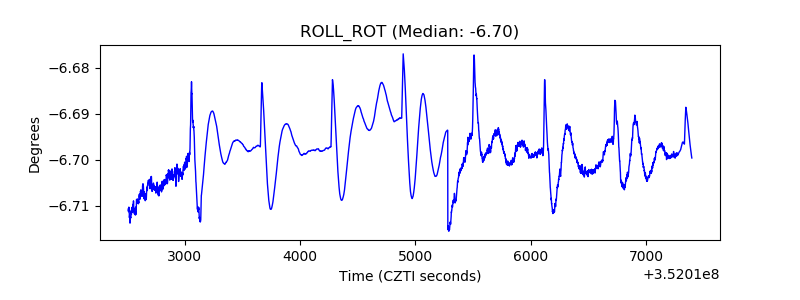 |
| _Roll_DEC | 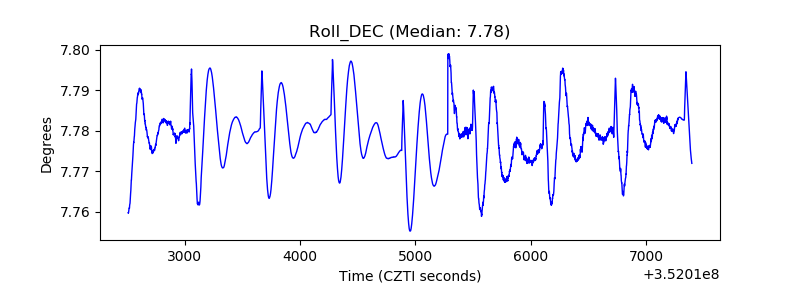 |
| _Roll_RA | 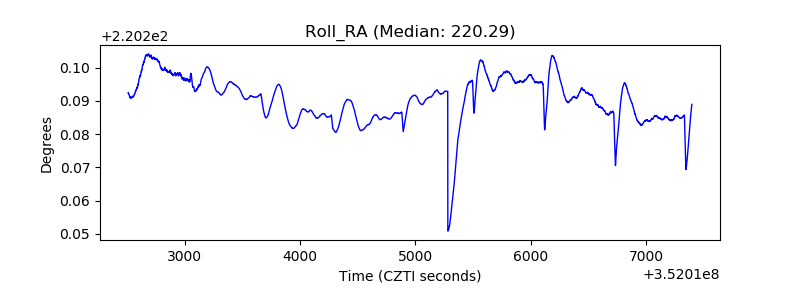 |
| Veto Counter | 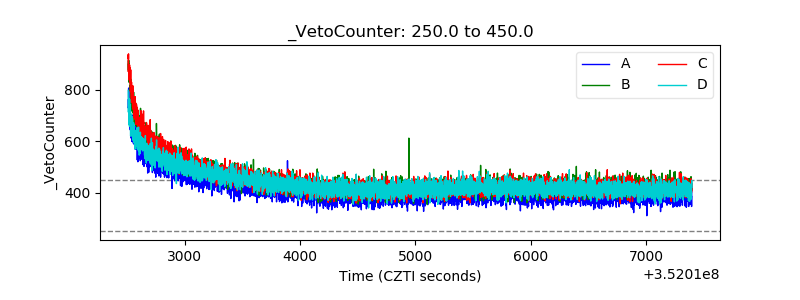 |