| Param | Original file | Final file |
|---|---|---|
| Filename | modeM0/AS1A10_045T08_9000004208_29442cztM0_level2.evt | modeM0/AS1A10_045T08_9000004208_29442cztM0_level2_quad_clean.evt |
| Size (bytes) | 83,180,160 | 21,504,960 |
| Size | 79.3 MB | 20.5 MB |
| Events in quadrant A | 545,773 | 149,807 |
| Events in quadrant B | 550,418 | 154,263 |
| Events in quadrant C | 788,361 | 135,176 |
| Events in quadrant D | 567,307 | 138,323 |
| Mode SS | |||
|---|---|---|---|
| Quadrant | BADHDUFLAG | Total packets | Discarded packets |
| A | 0 | 64 | 44 |
| B | 0 | 64 | 42 |
| C | 0 | 64 | 46 |
| D | 0 | 69 | 51 |
| Mode M0 | |||
|---|---|---|---|
| Quadrant | BADHDUFLAG | Total packets | Discarded packets |
| A | 0 | 8081 | 5957 |
| B | 0 | 7437 | 5287 |
| C | 0 | 11044 | 8065 |
| D | 0 | 11779 | 9496 |
| Mode M9 | |||
|---|---|---|---|
| Quadrant | BADHDUFLAG | Total packets | Discarded packets |
| A | 0 | 14 | 0 |
| B | 0 | 14 | 1 |
| C | 0 | 14 | 0 |
| D | 0 | 15 | 1 |
| Quadrant | Total seconds | Saturated seconds | Saturation percentage |
|---|---|---|---|
| A | 960 | 4 | 0.416667% |
| B | 982 | 6 | 0.610998% |
| C | 919 | 27 | 2.937976% |
| D | 925 | 3 | 0.324324% |
Noise dominated data is calculated using 1-second bins in cleaned event files. If a bin has >2000 counts, and if more than 50% of those come from <1% of pixels, then it is considered to be noise-dominated and hence unusable.
| Quadrant | # 1 sec bins | Bins with >0 counts | Bins with >2000 counts | High rate bins dominated by noise | Noise dominated (total time) | Noise dominated (detector-on time) | Marked lightcurve |
|---|---|---|---|---|---|---|---|
| A | 4364 | 1063 | 0 | 0 | 0.00% | 0.00% | 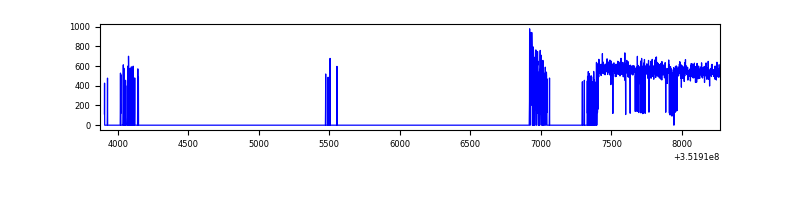 |
| B | 4396 | 1086 | 0 | 0 | 0.00% | 0.00% | 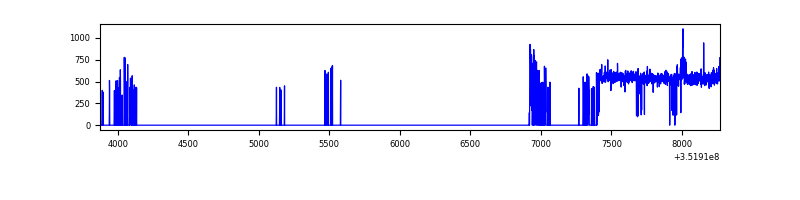 |
| C | 4206 | 1009 | 0 | 0 | 0.00% | 0.00% | 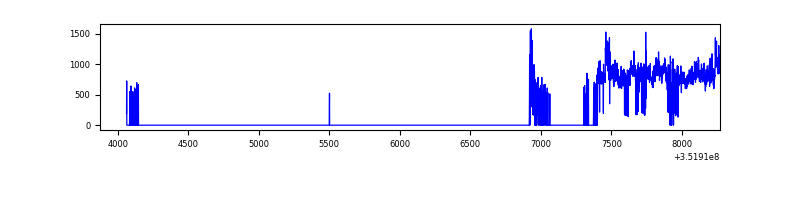 |
| D | 4232 | 1011 | 0 | 0 | 0.00% | 0.00% | 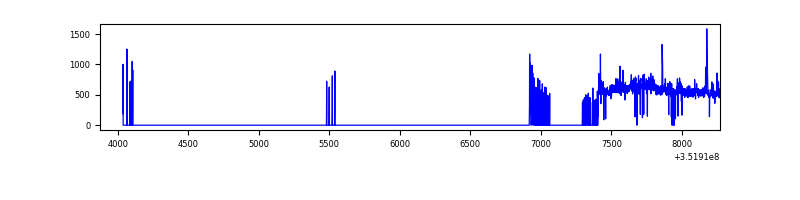 |
Top three noisy pixels from each quadrant. If the there are fewer than three noisy pixels in the level2.evt file, extra rows are filled as -1
| Pixel properties | Quadrant properties | ||||||
|---|---|---|---|---|---|---|---|
| Quadrant | DetID | PixID | Counts | Sigma | Mean | Median | Sigma |
| A | 1 | 113 | 3623 | 117.91 | 140 | 138 | 29.6 |
| A | 13 | 254 | 1631 | 50.51 | 140 | 138 | 29.6 |
| A | 3 | 137 | 1228 | 36.88 | 140 | 138 | 29.6 |
| B | 0 | 230 | 4396 | 151.25 | 137 | 134 | 28.2 |
| B | 12 | 111 | 3033 | 102.88 | 137 | 134 | 28.2 |
| B | 11 | 111 | 2770 | 93.55 | 137 | 134 | 28.2 |
| C | 3 | 233 | 282073 | 9516.76 | 122 | 123 | 29.6 |
| C | 14 | 238 | 23106 | 775.75 | 122 | 123 | 29.6 |
| C | 14 | 254 | 4561 | 149.8 | 122 | 123 | 29.6 |
| D | 8 | 195 | 49540 | 1561.72 | 128 | 125 | 31.6 |
| D | 1 | 52 | 19298 | 605.95 | 128 | 125 | 31.6 |
| D | 7 | 80 | 5864 | 181.38 | 128 | 125 | 31.6 |
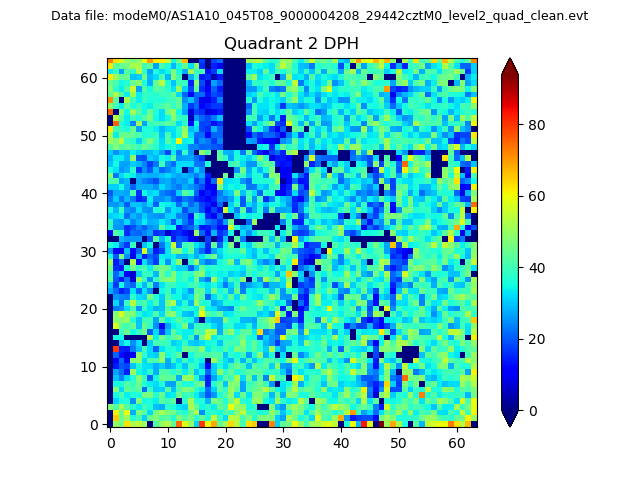
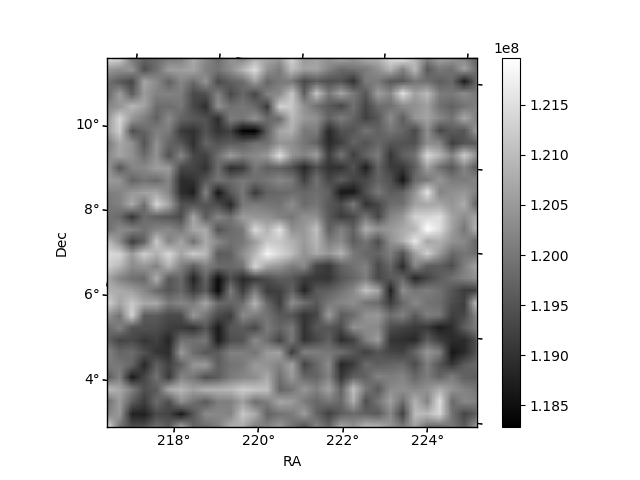
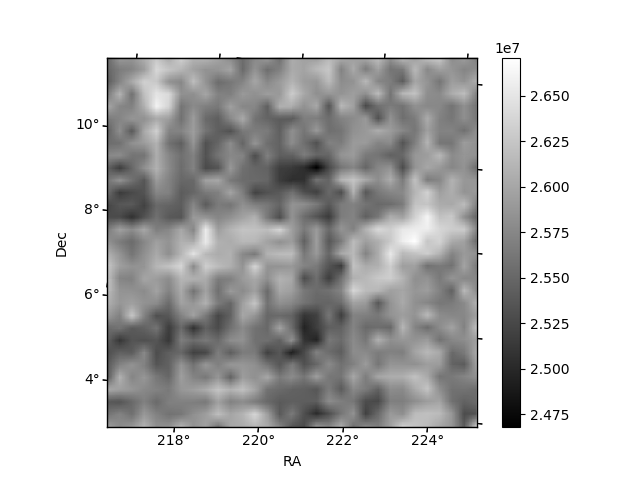
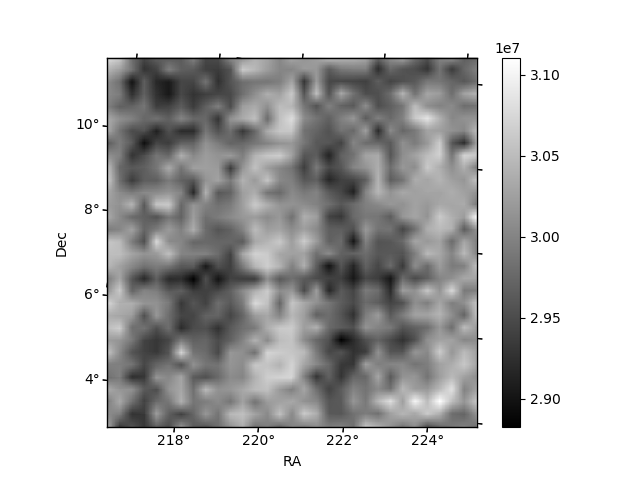
Histogram calculated using DETX and DETY for each event in the final _common_clean file
| Quadrant A | 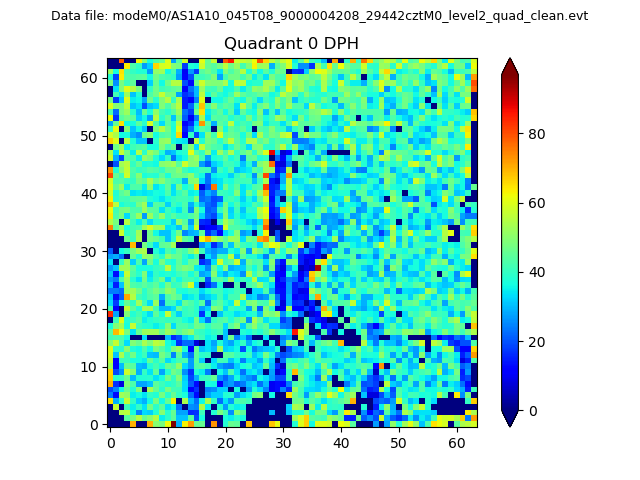 |
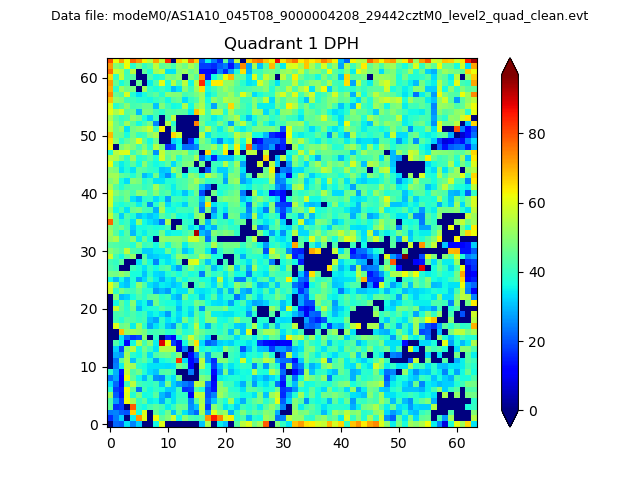 |
Quadrant B |
|---|---|---|---|
| Quadrant D | 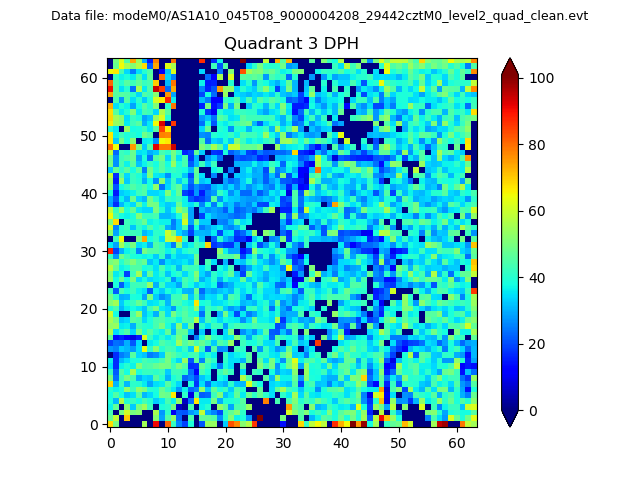 |
 |
Quadrant C |
| Plot type | Count rate plots | Images |
|---|---|---|
| Comparison with Poisson distribution Blue bars denote a histogram of data divided into 1 sec bins. Red curve is a Poisson curve with rate = median count rate of data. |
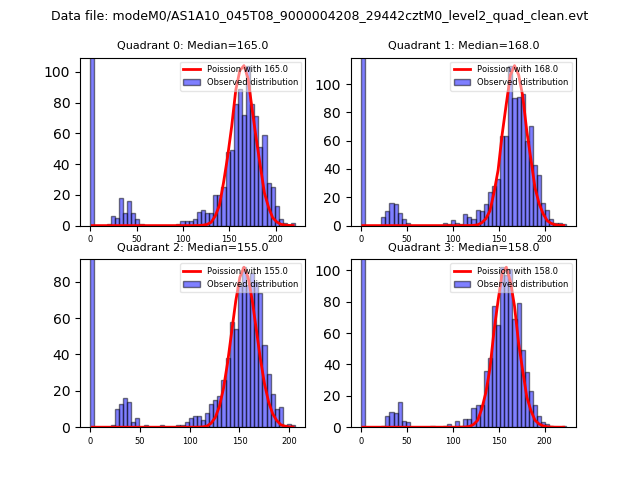 |
 |
| Quadrant-wise count rates Data is divided into 100 sec bins |
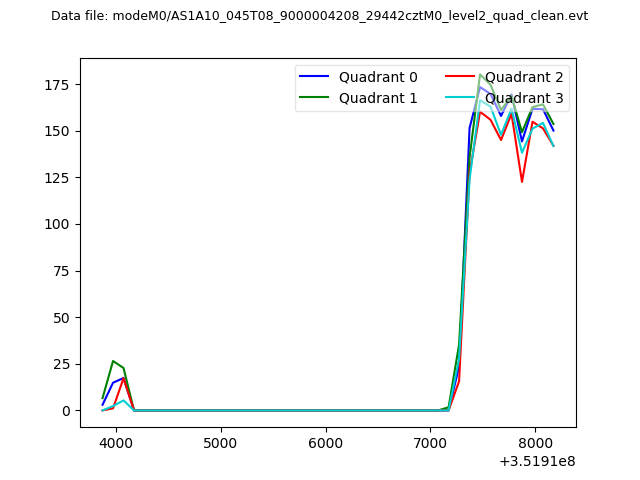 |
|
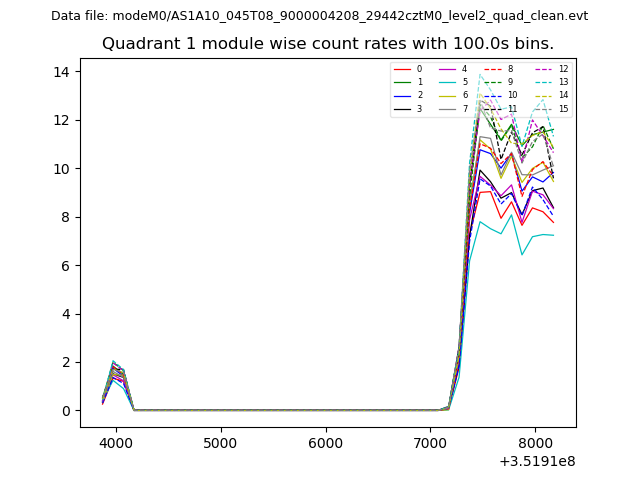
| Module-wise count rates for Quadrant A Data is divided into 100 sec bins |
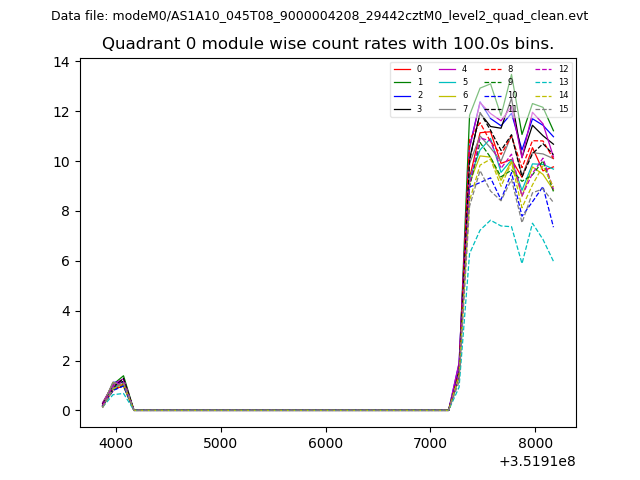 |
 |
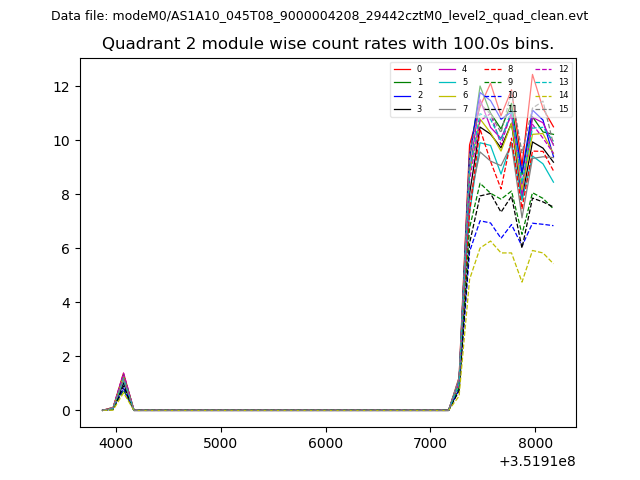
| Module-wise count rates for Quadrant B Data is divided into 100 sec bins |
 |
 |
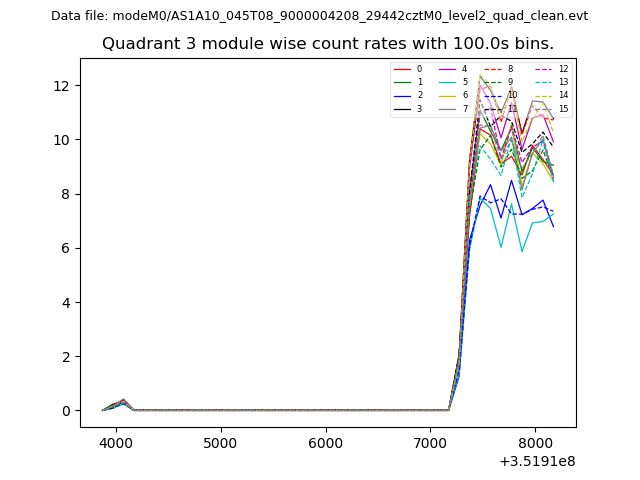
| Module-wise count rates for Quadrant C Data is divided into 100 sec bins |
 |
 |
| Module-wise count rates for Quadrant D Data is divided into 100 sec bins |
 |
 |
| Parameter | Plot |
|---|---|
| CZT HV Monitor | 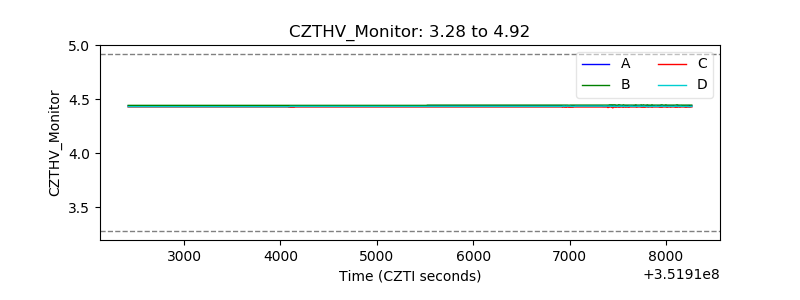 |
| D_VDD | 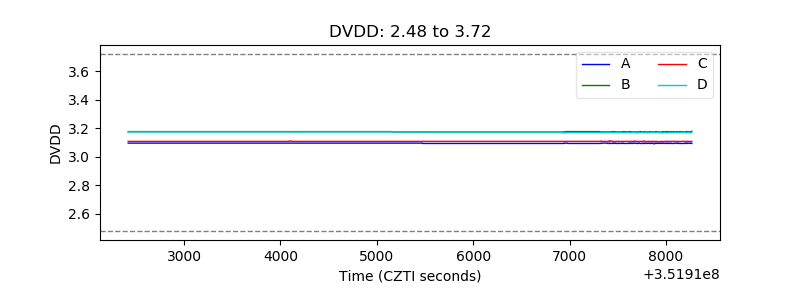 |
| Temperature 1 |  |
| Veto HV Monitor | 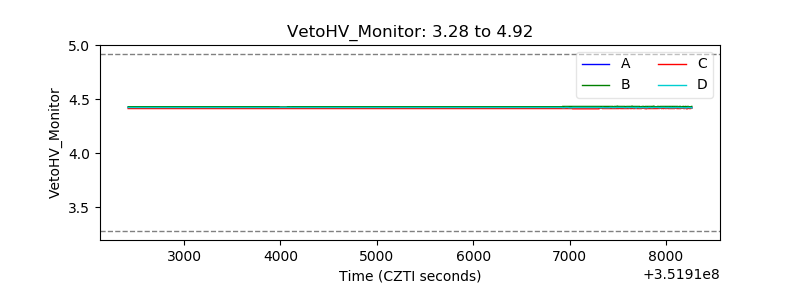 |
| Veto LLD |  |
| Alpha Counter | 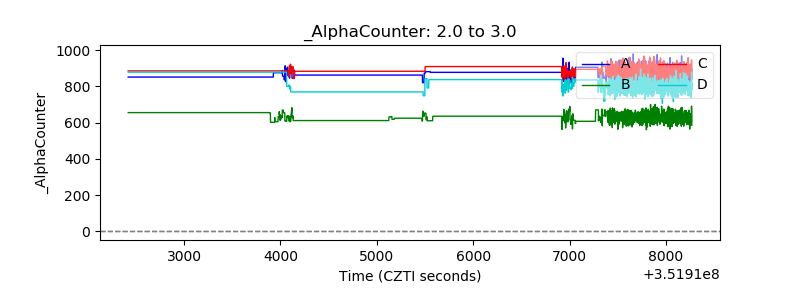 |
| _CPM_Rate | 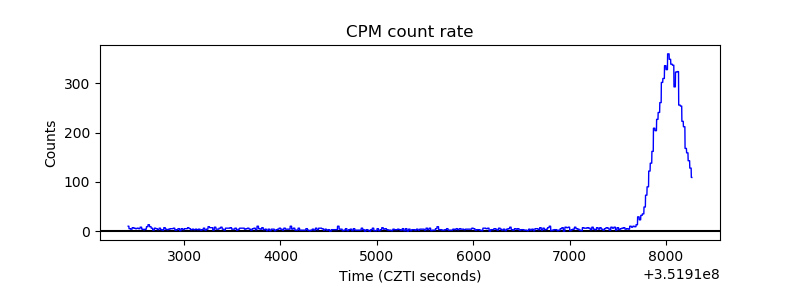 |
| CZT Counter | 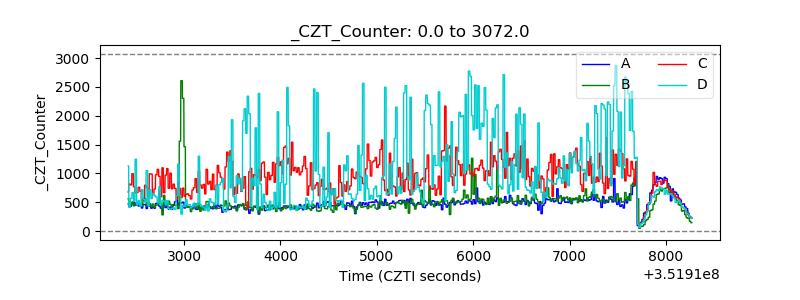 |
| +2.5 Volts monitor |  |
| +5 Volts monitor | 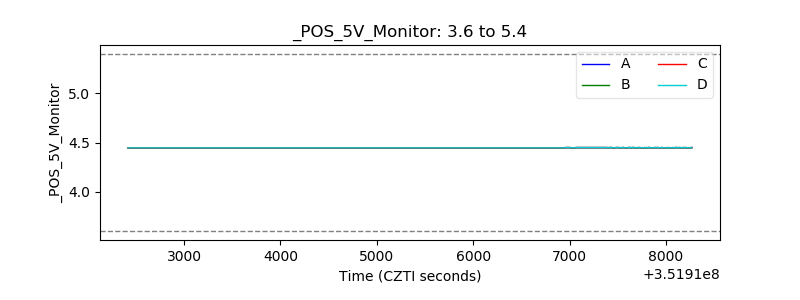 |
| _ROLL_ROT | 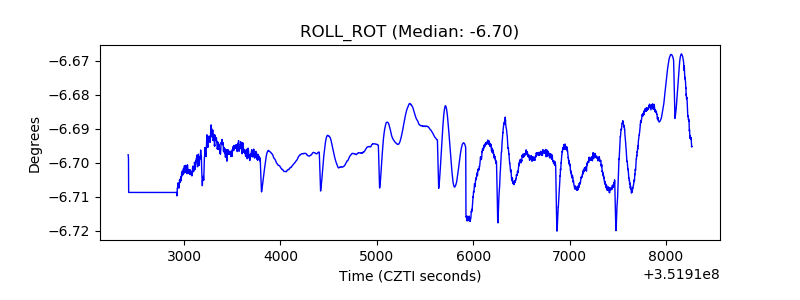 |
| _Roll_DEC |  |
| _Roll_RA | 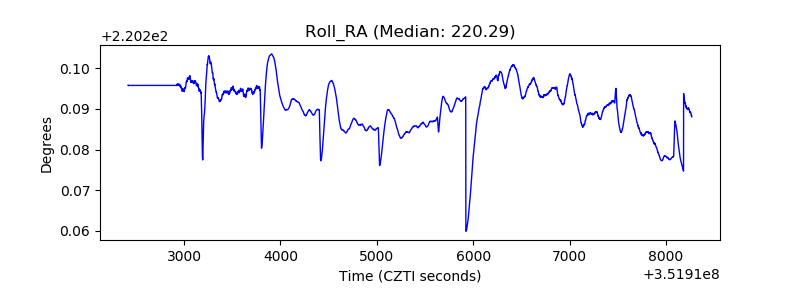 |
| Veto Counter |  |