| Param | Original file | Final file |
|---|---|---|
| Filename | modeM0/AS1A10_045T08_9000004208_29443cztM0_level2.evt | modeM0/AS1A10_045T08_9000004208_29443cztM0_level2_quad_clean.evt |
| Size (bytes) | 88,263,360 | 26,150,400 |
| Size | 84.2 MB | 24.9 MB |
| Events in quadrant A | 618,905 | 179,709 |
| Events in quadrant B | 619,956 | 183,747 |
| Events in quadrant C | 615,996 | 172,570 |
| Events in quadrant D | 738,026 | 169,176 |
| Mode SS | |||
|---|---|---|---|
| Quadrant | BADHDUFLAG | Total packets | Discarded packets |
| A | 0 | 52 | 32 |
| B | 0 | 51 | 27 |
| C | 0 | 54 | 32 |
| D | 0 | 52 | 28 |
| Mode M0 | |||
|---|---|---|---|
| Quadrant | BADHDUFLAG | Total packets | Discarded packets |
| A | 0 | 5217 | 2802 |
| B | 0 | 5286 | 2844 |
| C | 0 | 5916 | 3512 |
| D | 0 | 7642 | 4755 |
| Mode M9 | |||
|---|---|---|---|
| Quadrant | BADHDUFLAG | Total packets | Discarded packets |
| A | 0 | 8 | 8 |
| B | 0 | 8 | 8 |
| C | 0 | 9 | 9 |
| D | 0 | 10 | 9 |
| Quadrant | Total seconds | Saturated seconds | Saturation percentage |
|---|---|---|---|
| A | 1134 | 3 | 0.264550% |
| B | 1140 | 0 | 0.000000% |
| C | 1137 | 5 | 0.439754% |
| D | 1134 | 14 | 1.234568% |
Noise dominated data is calculated using 1-second bins in cleaned event files. If a bin has >2000 counts, and if more than 50% of those come from <1% of pixels, then it is considered to be noise-dominated and hence unusable.
| Quadrant | # 1 sec bins | Bins with >0 counts | Bins with >2000 counts | High rate bins dominated by noise | Noise dominated (total time) | Noise dominated (detector-on time) | Marked lightcurve |
|---|---|---|---|---|---|---|---|
| A | 3697 | 1187 | 0 | 0 | 0.00% | 0.00% | 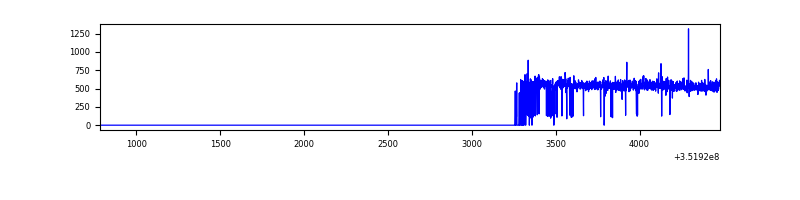 |
| B | 3674 | 1185 | 0 | 0 | 0.00% | 0.00% | 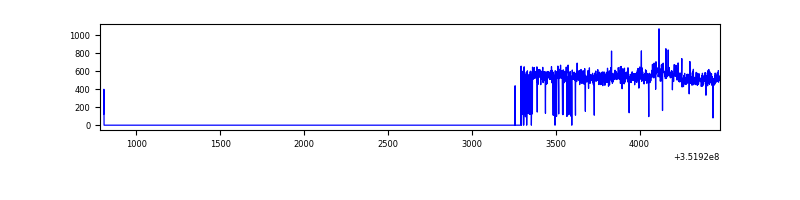 |
| C | 1209 | 1181 | 0 | 0 | 0.00% | 0.00% | 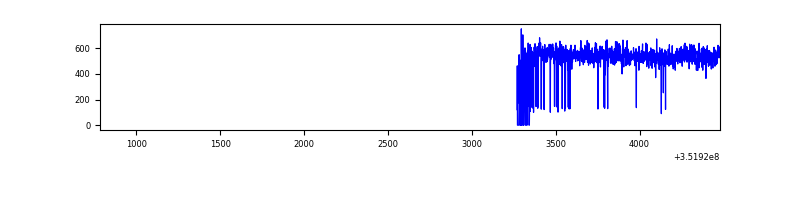 |
| D | 1208 | 1172 | 6 | 6 | 0.50% | 0.51% | 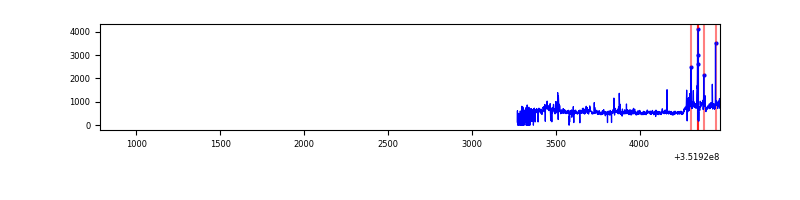 |
Top three noisy pixels from each quadrant. If the there are fewer than three noisy pixels in the level2.evt file, extra rows are filled as -1
| Pixel properties | Quadrant properties | ||||||
|---|---|---|---|---|---|---|---|
| Quadrant | DetID | PixID | Counts | Sigma | Mean | Median | Sigma |
| A | 0 | 13 | 3319 | 94.98 | 158 | 156 | 33.3 |
| A | 1 | 113 | 2952 | 83.96 | 158 | 156 | 33.3 |
| A | 13 | 254 | 1868 | 51.41 | 158 | 156 | 33.3 |
| B | 0 | 183 | 9414 | 294.37 | 154 | 151 | 31.5 |
| B | 12 | 111 | 3333 | 101.12 | 154 | 151 | 31.5 |
| B | 11 | 111 | 3130 | 94.67 | 154 | 151 | 31.5 |
| C | 14 | 238 | 24012 | 669.89 | 148 | 149 | 35.6 |
| C | 3 | 233 | 11627 | 322.21 | 148 | 149 | 35.6 |
| C | 2 | 114 | 2459 | 64.85 | 148 | 149 | 35.6 |
| D | 7 | 80 | 54549 | 1465.88 | 151 | 147 | 37.1 |
| D | 13 | 104 | 38631 | 1036.97 | 151 | 147 | 37.1 |
| D | 13 | 153 | 29412 | 788.56 | 151 | 147 | 37.1 |
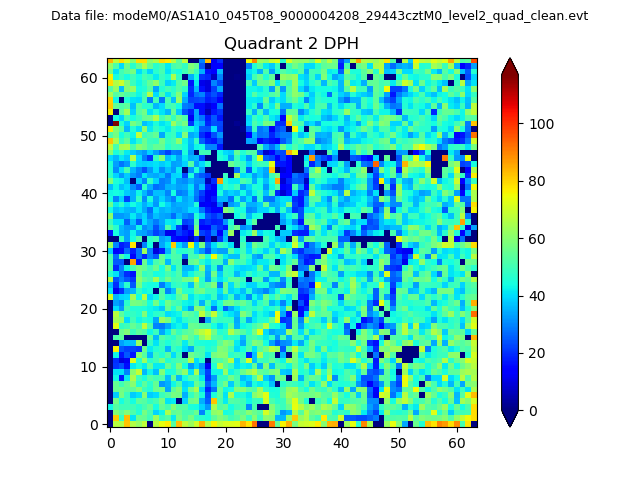
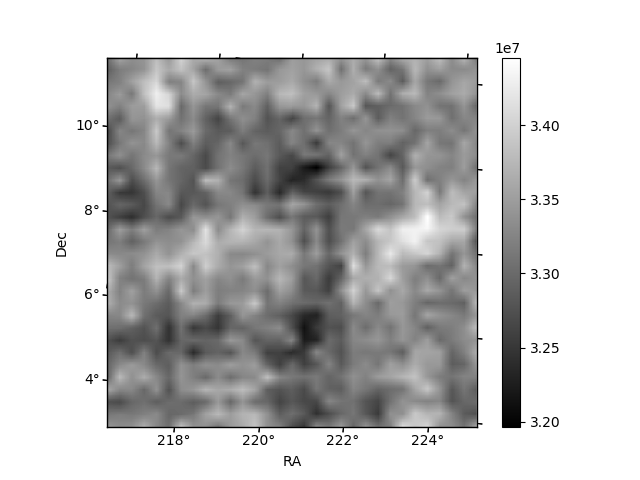
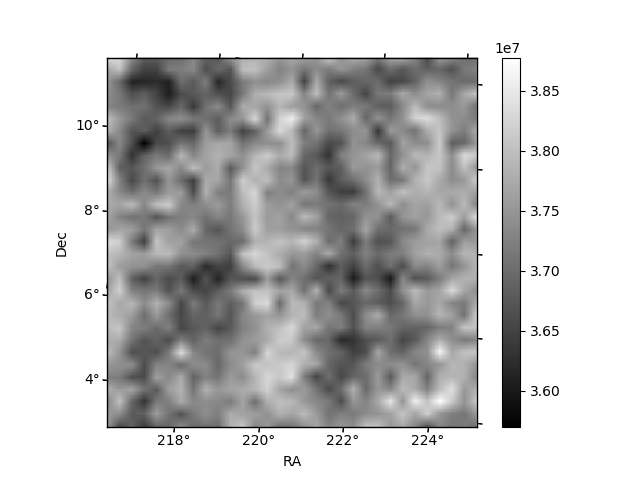
Histogram calculated using DETX and DETY for each event in the final _common_clean file
| Quadrant A |  |
 |
Quadrant B |
|---|---|---|---|
| Quadrant D | 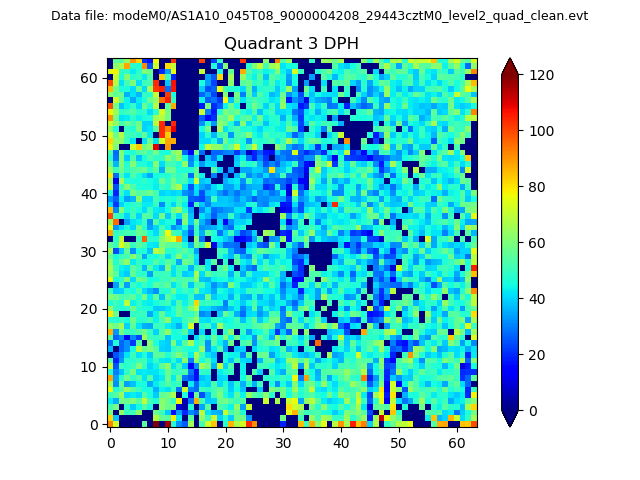 |
 |
Quadrant C |
| Plot type | Count rate plots | Images |
|---|---|---|
| Comparison with Poisson distribution Blue bars denote a histogram of data divided into 1 sec bins. Red curve is a Poisson curve with rate = median count rate of data. |
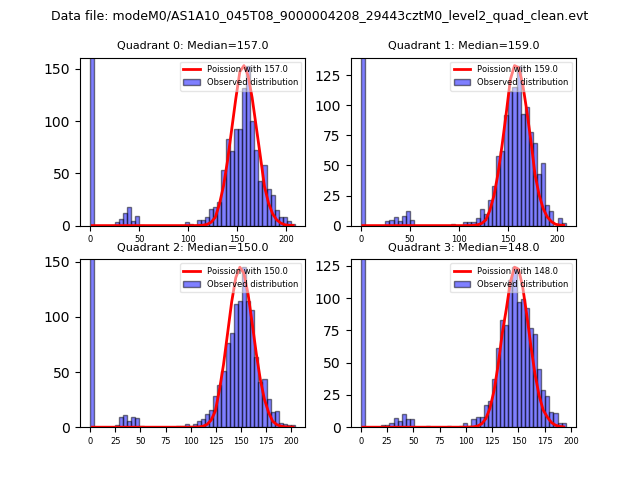 |
 |
| Quadrant-wise count rates Data is divided into 100 sec bins |
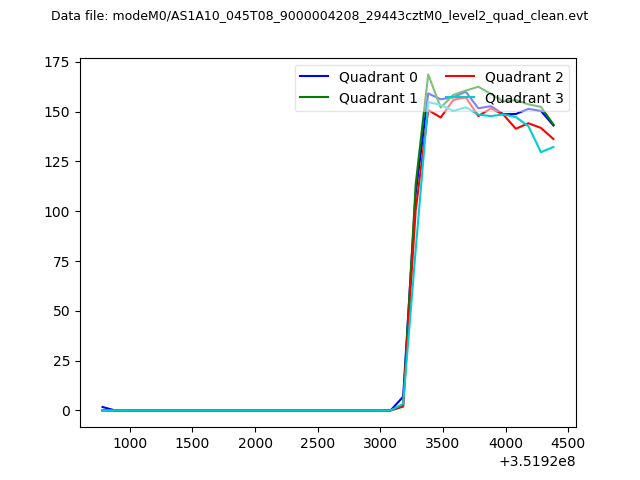 |
|
| Module-wise count rates for Quadrant A Data is divided into 100 sec bins |
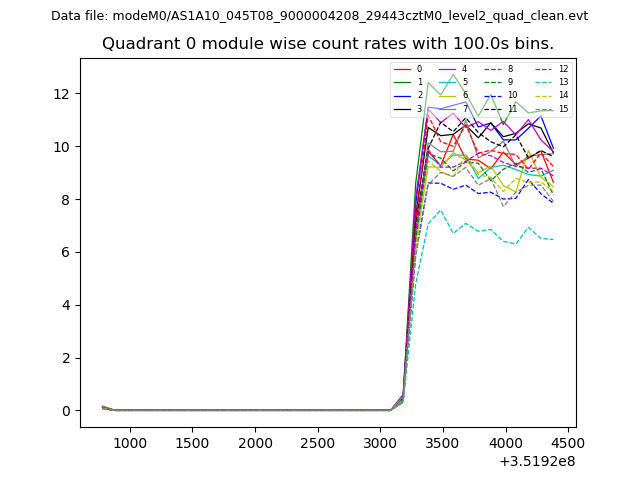 |
 |
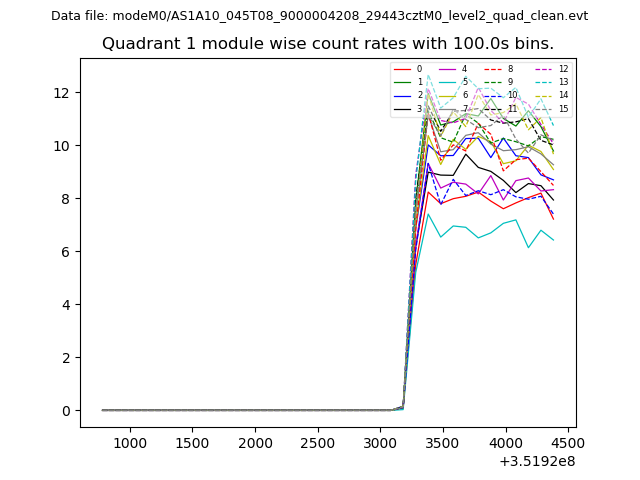
| Module-wise count rates for Quadrant B Data is divided into 100 sec bins |
 |
 |
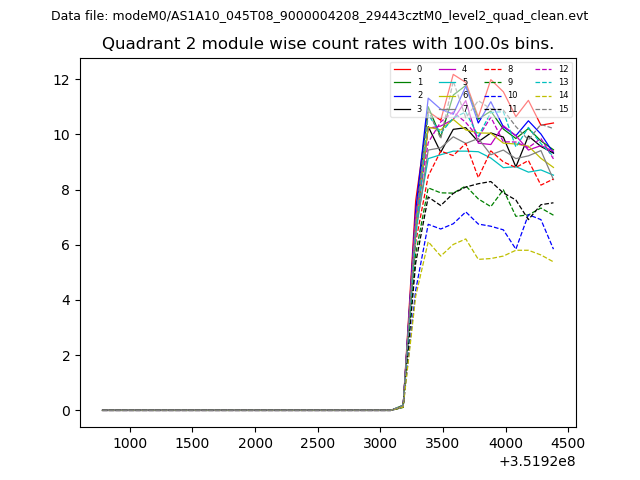
| Module-wise count rates for Quadrant C Data is divided into 100 sec bins |
 |
 |
| Module-wise count rates for Quadrant D Data is divided into 100 sec bins |
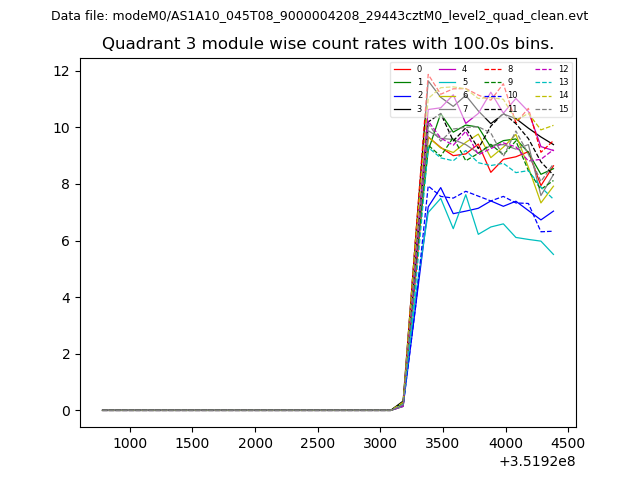 |
 |
| Parameter | Plot |
|---|---|
| CZT HV Monitor | 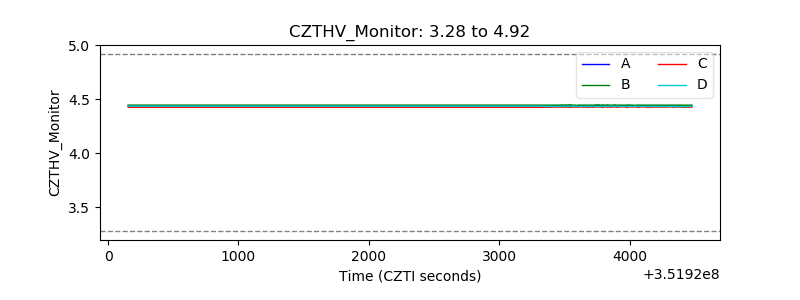 |
| D_VDD | 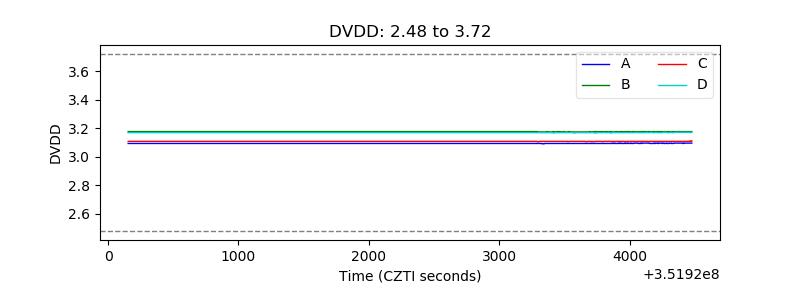 |
| Temperature 1 | 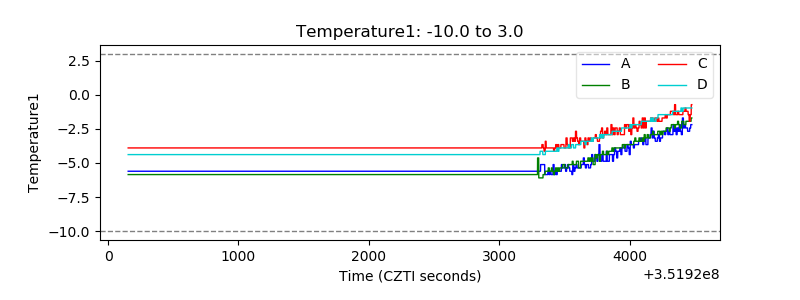 |
| Veto HV Monitor | 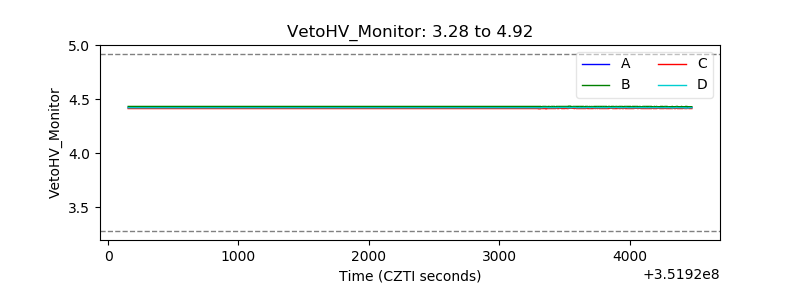 |
| Veto LLD | 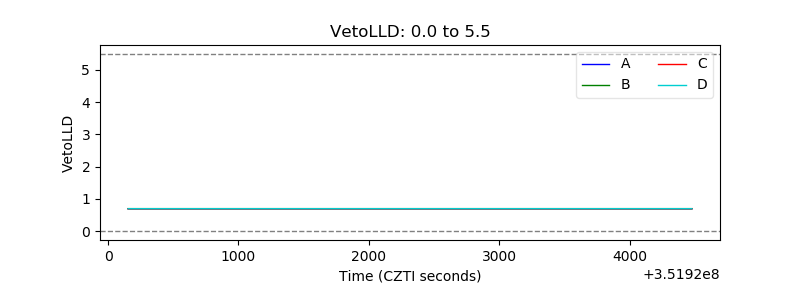 |
| Alpha Counter | 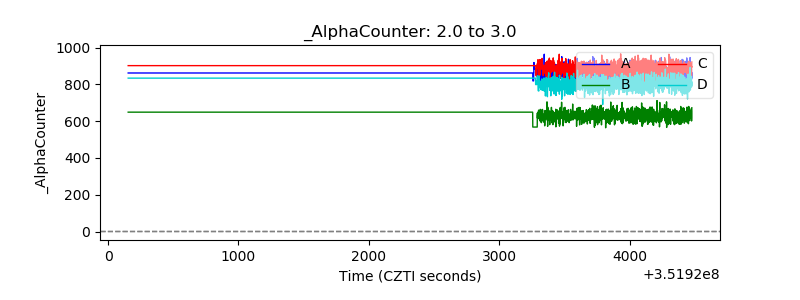 |
| _CPM_Rate | 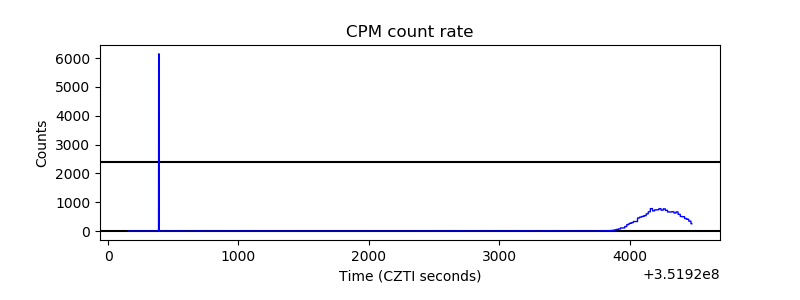 |
| CZT Counter | 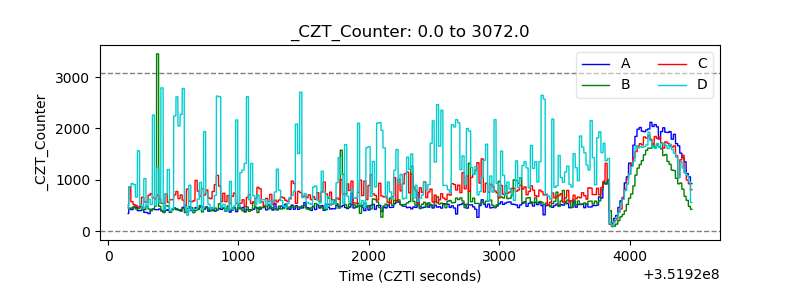 |
| +2.5 Volts monitor |  |
| +5 Volts monitor | 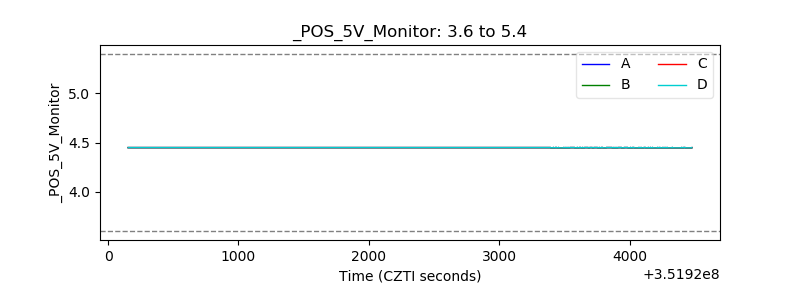 |
| _ROLL_ROT | 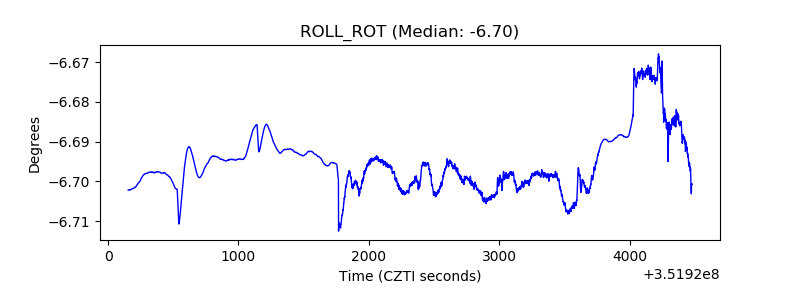 |
| _Roll_DEC |  |
| _Roll_RA | 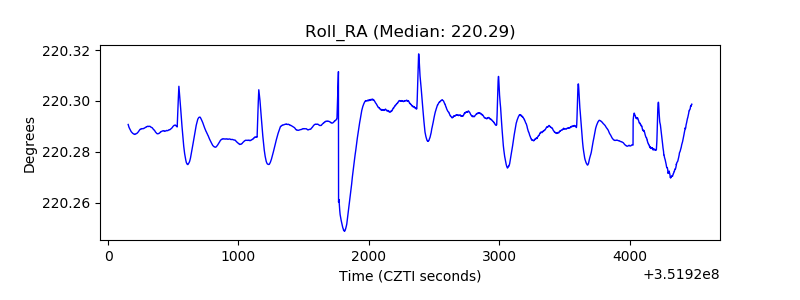 |
| Veto Counter | 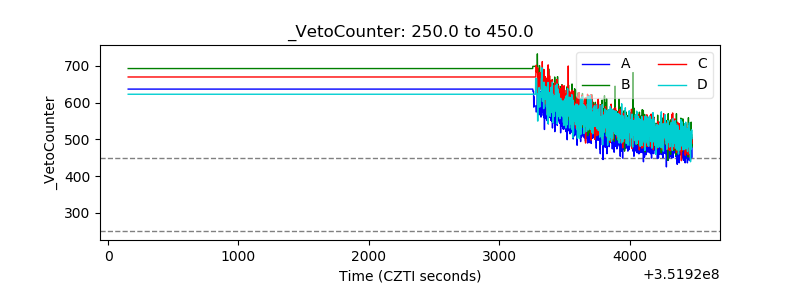 |