| Param | Original file | Final file |
|---|---|---|
| Filename | modeM0/AS1A10_115T01_9000004206cztM0_level2.fits | modeM0/AS1A10_115T01_9000004206cztM0_level2_quad_clean.evt |
| Size (bytes) | 264,882,240 | 191,030,400 |
| Size | 252.6 MB | 182.2 MB |
| Events in quadrant A | 1,826,444 | 1,313,383 |
| Events in quadrant B | 1,709,326 | 1,291,321 |
| Events in quadrant C | 1,214,144 | 312,133 |
| Events in quadrant D | 1,462,818 | 1,066,680 |
| Mode SS | |||
|---|---|---|---|
| Quadrant | BADHDUFLAG | Total packets | Discarded packets |
| A | 0 | 536 | 0 |
| B | 0 | 536 | 0 |
| C | 0 | 536 | 0 |
| D | 0 | 536 | 0 |
| Mode M9 | |||
|---|---|---|---|
| Quadrant | BADHDUFLAG | Total packets | Discarded packets |
| A | 0 | 57 | 0 |
| B | 0 | 57 | 0 |
| C | 0 | 57 | 0 |
| D | 0 | 57 | 0 |
| Mode M0 | |||
|---|---|---|---|
| Quadrant | BADHDUFLAG | Total packets | Discarded packets |
| A | 0 | 56662 | 0 |
| B | 0 | 67482 | 0 |
| C | 0 | 170271 | 0 |
| D | 0 | 87823 | 0 |
| Quadrant | Total seconds | Saturated seconds | Saturation percentage |
|---|---|---|---|
| A | 26158 | 394 | 1.506231% |
| B | 26158 | 927 | 3.543849% |
| C | 26158 | 17944 | 68.598517% |
| D | 26158 | 2669 | 10.203379% |
Noise dominated data is calculated using 1-second bins in cleaned event files. If a bin has >2000 counts, and if more than 50% of those come from <1% of pixels, then it is considered to be noise-dominated and hence unusable.
| Quadrant | # 1 sec bins | Bins with >0 counts | Bins with >2000 counts | High rate bins dominated by noise | Noise dominated (total time) | Noise dominated (detector-on time) | Marked lightcurve |
|---|---|---|---|---|---|---|---|
| A | 31923 | 26158 | 0 | 0 | 0.00% | 0.00% |  |
| B | 31923 | 26156 | 0 | 0 | 0.00% | 0.00% |  |
| C | 31923 | 26154 | 0 | 0 | 0.00% | 0.00% |  |
| D | 31923 | 25966 | 0 | 0 | 0.00% | 0.00% |  |
Top three noisy pixels from each quadrant. If the there are fewer than three noisy pixels in the level2.evt file, extra rows are filled as -1
| Pixel properties | Quadrant properties | ||||||
|---|---|---|---|---|---|---|---|
| Quadrant | DetID | PixID | Counts | Sigma | Mean | Median | Sigma |
| A | 0 | 29 | 1498 | 8.99 | 476 | 449 | 116.7 |
| A | 7 | 110 | 1430 | 8.41 | 476 | 449 | 116.7 |
| A | 9 | 19 | 1317 | 7.44 | 476 | 449 | 116.7 |
| B | 2 | 9 | 1310 | 9.68 | 453 | 435 | 90.4 |
| B | 5 | 225 | 1130 | 7.68 | 453 | 435 | 90.4 |
| B | 5 | 128 | 1096 | 7.31 | 453 | 435 | 90.4 |
| C | 3 | 202 | 1004 | 8.54 | 320 | 303 | 82.1 |
| C | 3 | 203 | 908 | 7.37 | 320 | 303 | 82.1 |
| C | 1 | 81 | 901 | 7.28 | 320 | 303 | 82.1 |
| D | 15 | 46 | 1056 | 6.14 | 418 | 385 | 109.2 |
| D | 10 | 189 | 1034 | 5.94 | 418 | 385 | 109.2 |
| D | 3 | 14 | 1015 | 5.77 | 418 | 385 | 109.2 |
Histogram calculated using DETX and DETY for each event in the final _common_clean file
| Quadrant A |  |
 |
Quadrant B |
|---|---|---|---|
| Quadrant D | 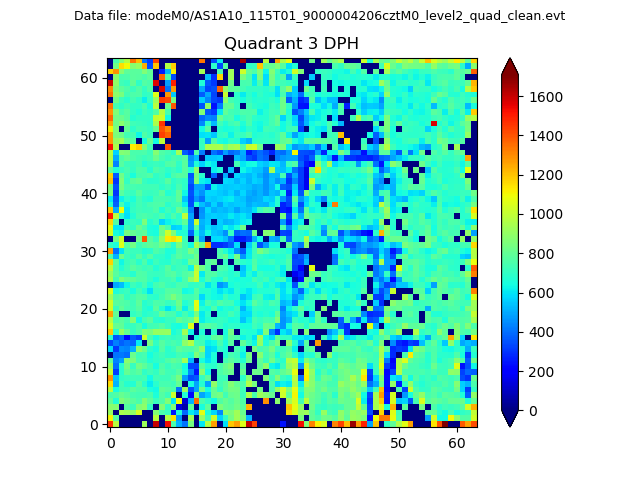 |
 |
Quadrant C |
| Plot type | Count rate plots | Images |
|---|---|---|
| Comparison with Poisson distribution Blue bars denote a histogram of data divided into 1 sec bins. Red curve is a Poisson curve with rate = median count rate of data. |
 |
 |
| Quadrant-wise count rates Data is divided into 100 sec bins |
 |
|
| Module-wise count rates for Quadrant A Data is divided into 100 sec bins |
 |
 |
| Module-wise count rates for Quadrant B Data is divided into 100 sec bins |
 |
 |
| Module-wise count rates for Quadrant C Data is divided into 100 sec bins |
 |
 |
| Module-wise count rates for Quadrant D Data is divided into 100 sec bins |
 |
 |
| Parameter | Plot |
|---|---|
| CZT HV Monitor |  |
| D_VDD | 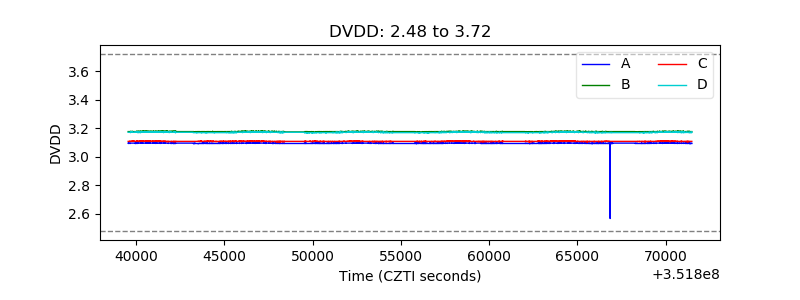 |
| Temperature 1 |  |
| Veto HV Monitor |  |
| Veto LLD |  |
| Alpha Counter |  |
| _CPM_Rate |  |
| CZT Counter |  |
| +2.5 Volts monitor |  |
| +5 Volts monitor |  |
| _ROLL_ROT |  |
| _Roll_DEC |  |
| _Roll_RA |  |
| Veto Counter |  |