| Param | Original file | Final file |
|---|---|---|
| Filename | modeM0/AS1A10_115T01_9000004206_29249cztM0_level2.evt | modeM0/AS1A10_115T01_9000004206_29249cztM0_level2_quad_clean.evt |
| Size (bytes) | 597,536,640 | 48,435,840 |
| Size | 569.9 MB | 46.2 MB |
| Events in quadrant A | 2,064,257 | 351,632 |
| Events in quadrant B | 2,847,314 | 342,426 |
| Events in quadrant C | 9,249,882 | 179,168 |
| Events in quadrant D | 3,655,744 | 301,469 |
| Mode SS | |||
|---|---|---|---|
| Quadrant | BADHDUFLAG | Total packets | Discarded packets |
| A | 0 | 84 | 0 |
| B | 0 | 84 | 0 |
| C | 0 | 84 | 0 |
| D | 0 | 84 | 0 |
| Mode M9 | |||
|---|---|---|---|
| Quadrant | BADHDUFLAG | Total packets | Discarded packets |
| A | 0 | 10 | 0 |
| B | 0 | 10 | 0 |
| C | 0 | 10 | 0 |
| D | 0 | 10 | 0 |
| Mode M0 | |||
|---|---|---|---|
| Quadrant | BADHDUFLAG | Total packets | Discarded packets |
| A | 0 | 8619 | 1 |
| B | 0 | 11041 | 1 |
| C | 0 | 30276 | 3 |
| D | 0 | 13514 | 1 |
| Quadrant | Total seconds | Saturated seconds | Saturation percentage |
|---|---|---|---|
| A | 4117 | 45 | 1.093029% |
| B | 4117 | 233 | 5.659461% |
| C | 4116 | 3648 | 88.629738% |
| D | 4116 | 548 | 13.313897% |
Noise dominated data is calculated using 1-second bins in cleaned event files. If a bin has >2000 counts, and if more than 50% of those come from <1% of pixels, then it is considered to be noise-dominated and hence unusable.
| Quadrant | # 1 sec bins | Bins with >0 counts | Bins with >2000 counts | High rate bins dominated by noise | Noise dominated (total time) | Noise dominated (detector-on time) | Marked lightcurve |
|---|---|---|---|---|---|---|---|
| A | 5082 | 4118 | 0 | 0 | 0.00% | 0.00% | 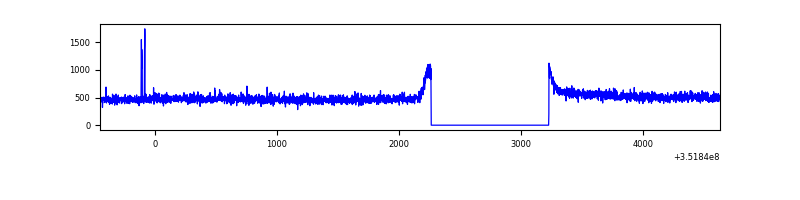 |
| B | 5082 | 4118 | 111 | 111 | 2.18% | 2.70% | 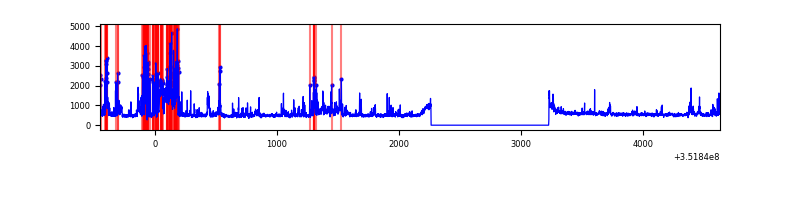 |
| C | 5081 | 4117 | 3043 | 3043 | 59.89% | 73.91% | 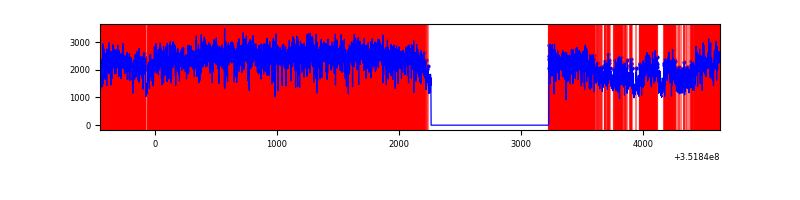 |
| D | 5081 | 4116 | 376 | 376 | 7.40% | 9.14% | 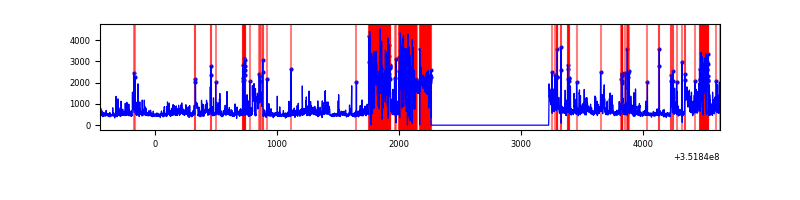 |
Top three noisy pixels from each quadrant. If the there are fewer than three noisy pixels in the level2.evt file, extra rows are filled as -1
| Pixel properties | Quadrant properties | ||||||
|---|---|---|---|---|---|---|---|
| Quadrant | DetID | PixID | Counts | Sigma | Mean | Median | Sigma |
| A | 1 | 113 | 14119 | 126.37 | 529 | 519 | 107.6 |
| A | 0 | 13 | 10357 | 91.41 | 529 | 519 | 107.6 |
| A | 13 | 254 | 7888 | 68.47 | 529 | 519 | 107.6 |
| B | 10 | 245 | 513048 | 5151.81 | 517 | 504 | 99.5 |
| B | 0 | 229 | 169467 | 1698.32 | 517 | 504 | 99.5 |
| B | 0 | 183 | 108899 | 1089.53 | 517 | 504 | 99.5 |
| C | 3 | 233 | 7892682 | 101357.17 | 332 | 335 | 77.9 |
| C | 14 | 238 | 51929 | 662.59 | 332 | 335 | 77.9 |
| C | 2 | 114 | 6598 | 80.43 | 332 | 335 | 77.9 |
| D | 1 | 52 | 1598902 | 14700.08 | 461 | 450 | 108.7 |
| D | 8 | 195 | 179849 | 1649.83 | 461 | 450 | 108.7 |
| D | 7 | 80 | 28355 | 256.63 | 461 | 450 | 108.7 |
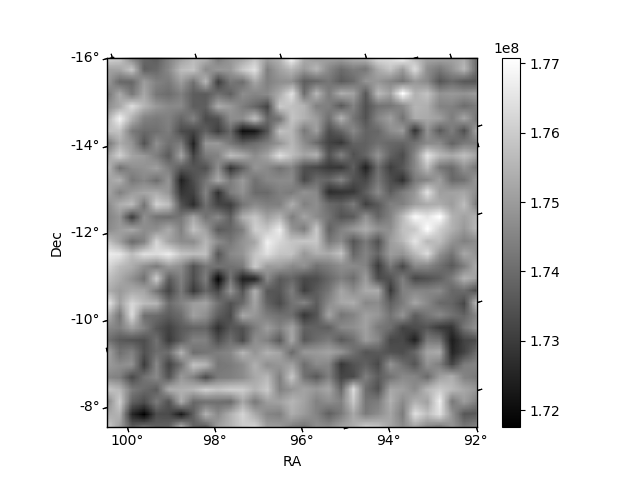
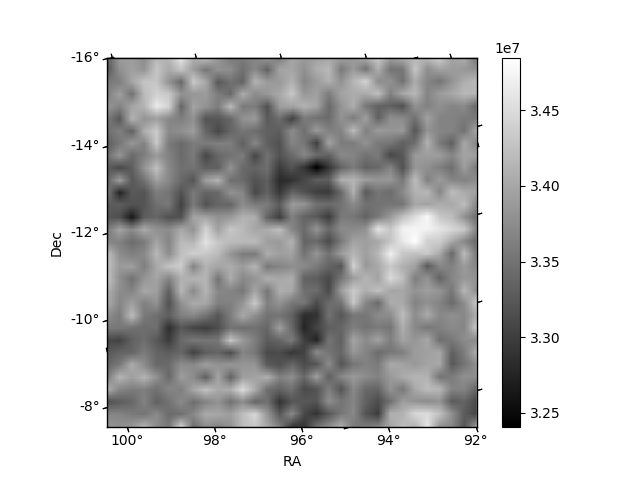
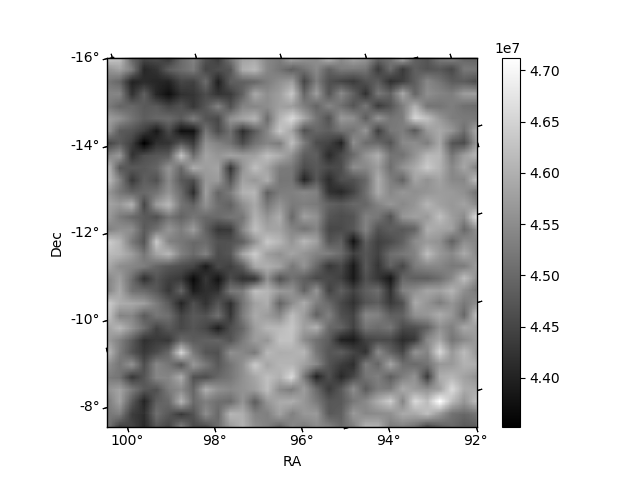
Histogram calculated using DETX and DETY for each event in the final _common_clean file
| Quadrant A | 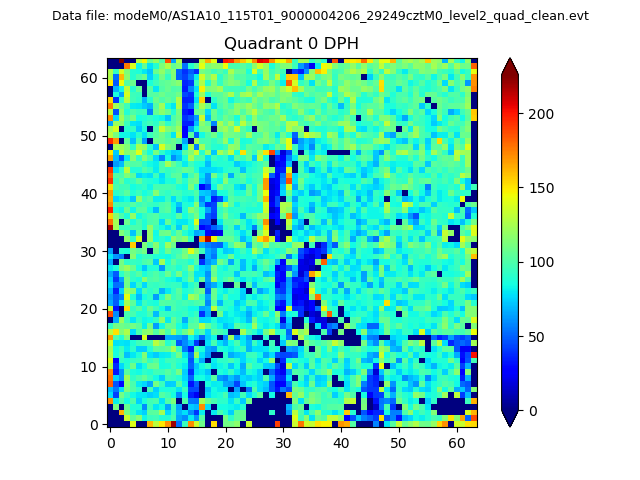 |
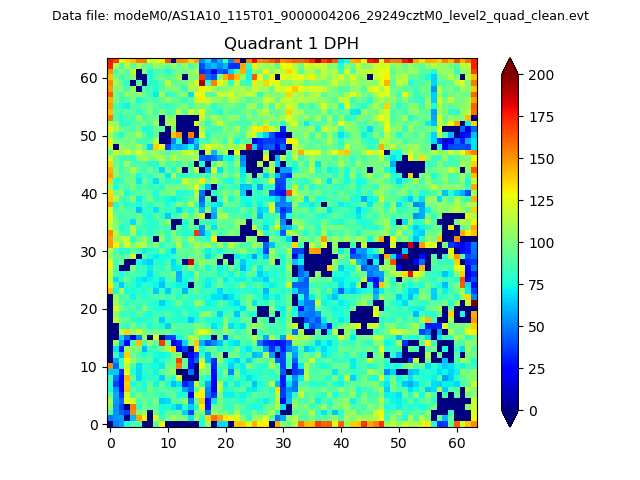 |
Quadrant B |
|---|---|---|---|
| Quadrant D | 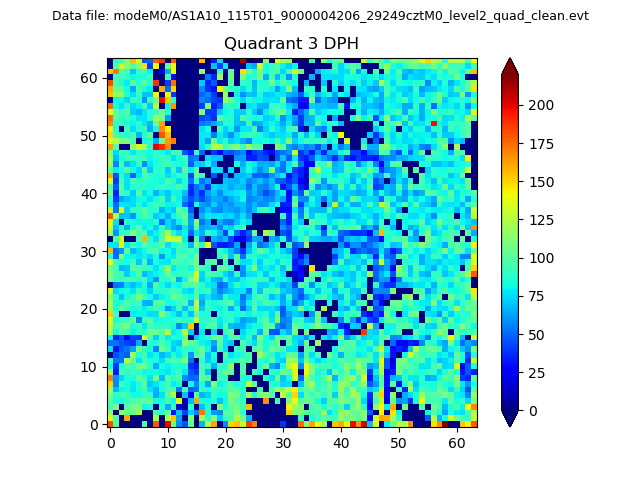 |
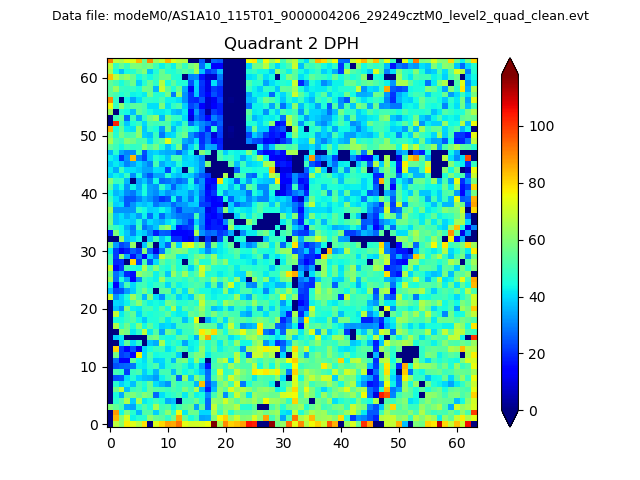 |
Quadrant C |
| Plot type | Count rate plots | Images |
|---|---|---|
| Comparison with Poisson distribution Blue bars denote a histogram of data divided into 1 sec bins. Red curve is a Poisson curve with rate = median count rate of data. |
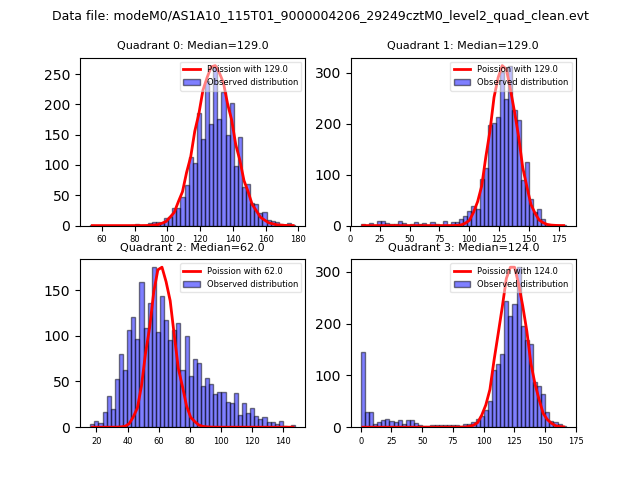 |
 |
| Quadrant-wise count rates Data is divided into 100 sec bins |
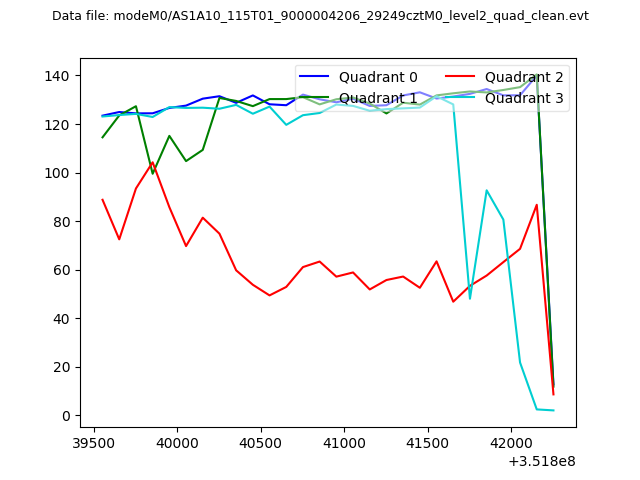 |
|
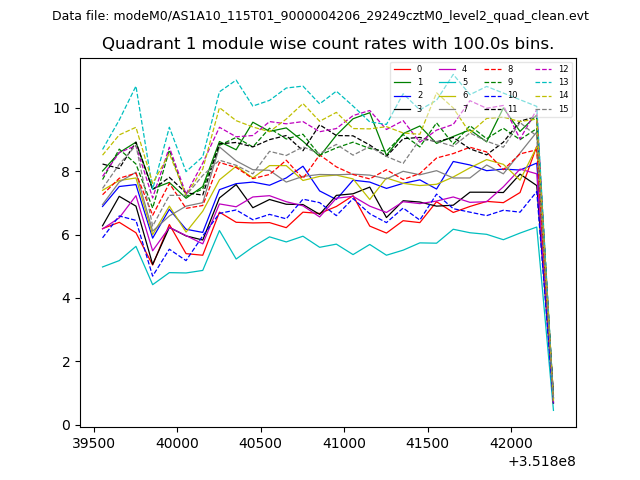
| Module-wise count rates for Quadrant A Data is divided into 100 sec bins |
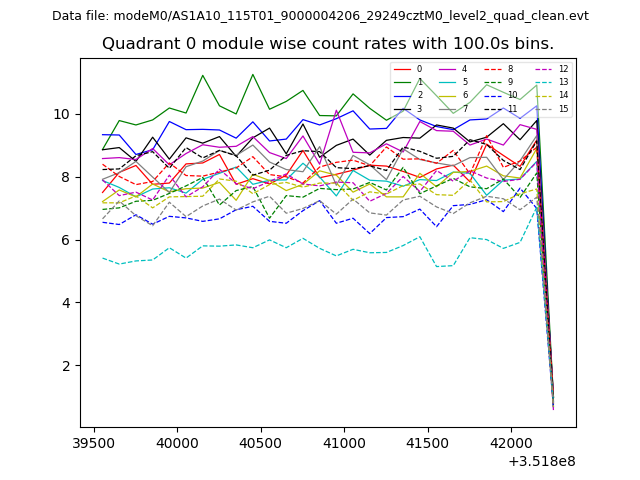 |
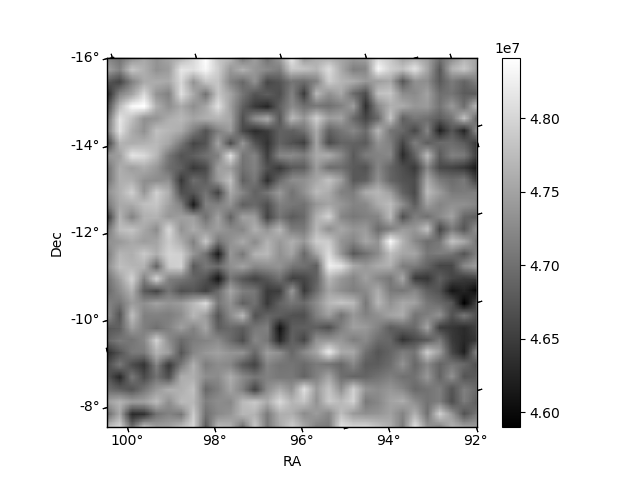 |
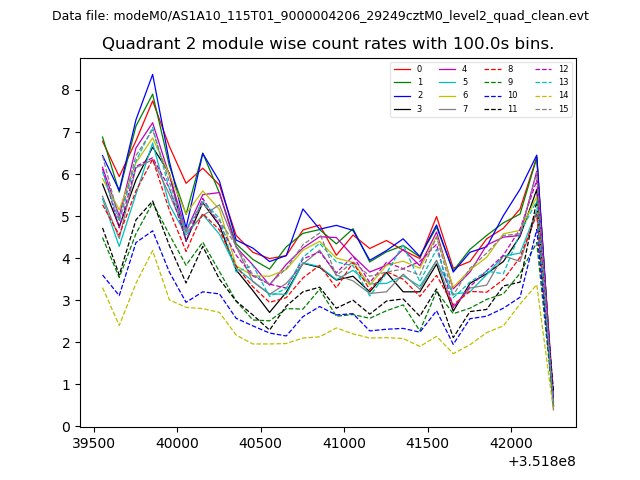
| Module-wise count rates for Quadrant B Data is divided into 100 sec bins |
 |
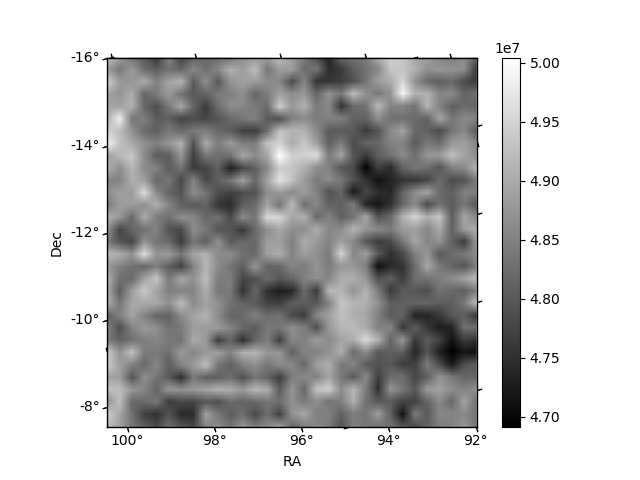 |
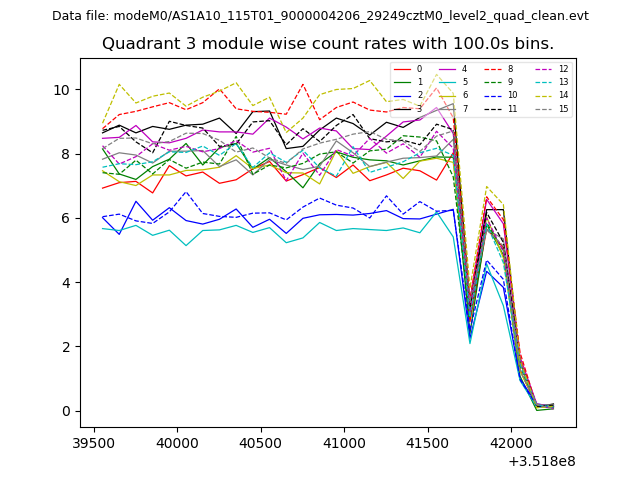
| Module-wise count rates for Quadrant C Data is divided into 100 sec bins |
 |
 |
| Module-wise count rates for Quadrant D Data is divided into 100 sec bins |
 |
 |
| Parameter | Plot |
|---|---|
| CZT HV Monitor | 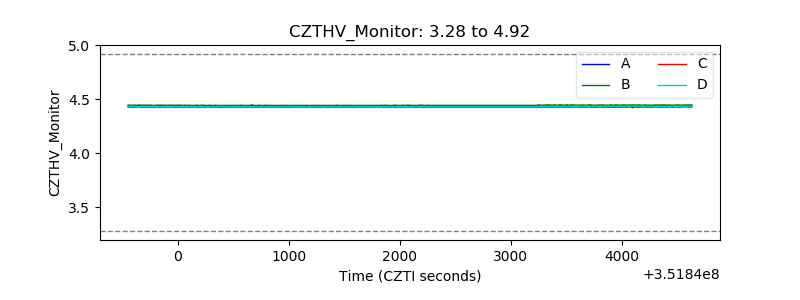 |
| D_VDD | 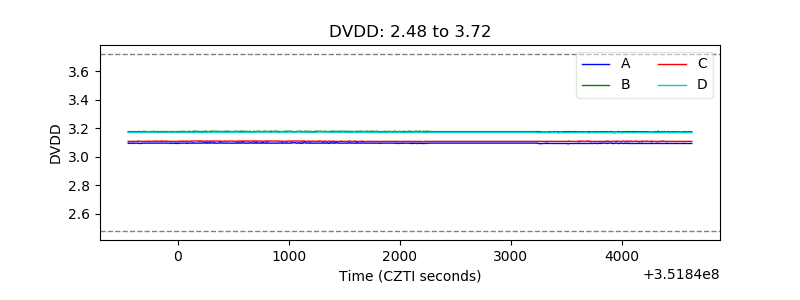 |
| Temperature 1 | 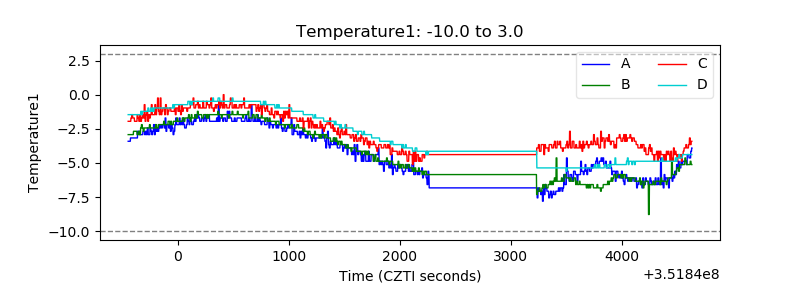 |
| Veto HV Monitor | 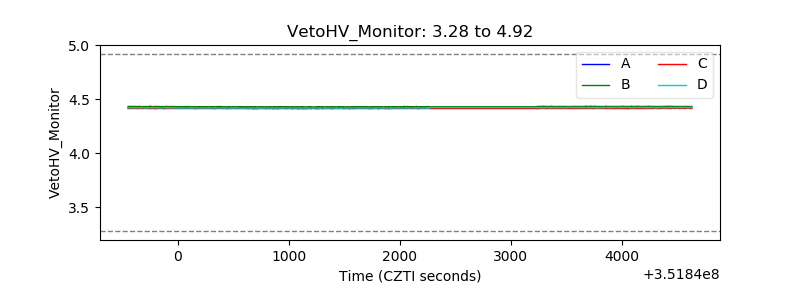 |
| Veto LLD | 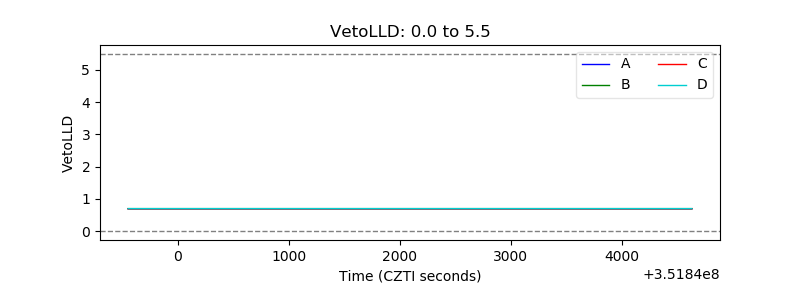 |
| Alpha Counter | 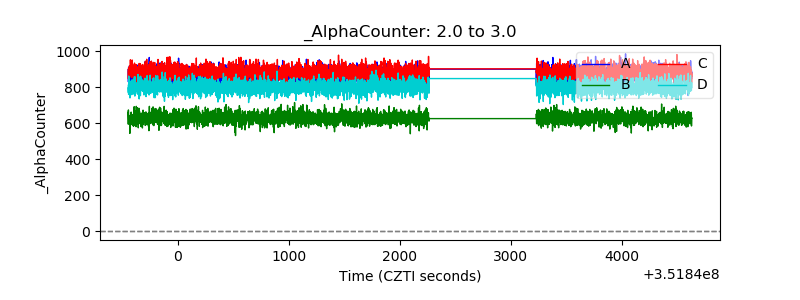 |
| _CPM_Rate | 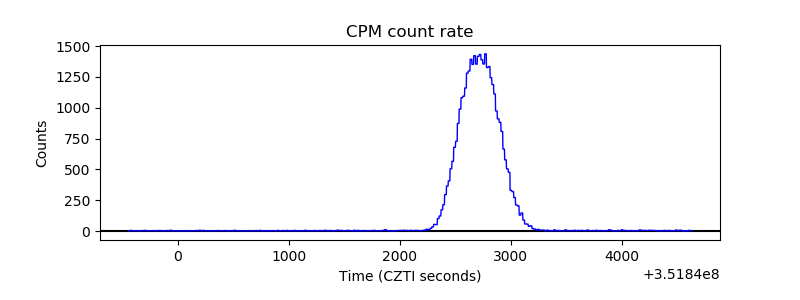 |
| CZT Counter | 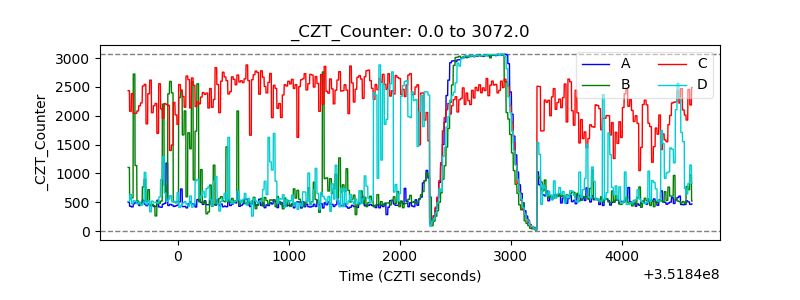 |
| +2.5 Volts monitor |  |
| +5 Volts monitor |  |
| _ROLL_ROT | 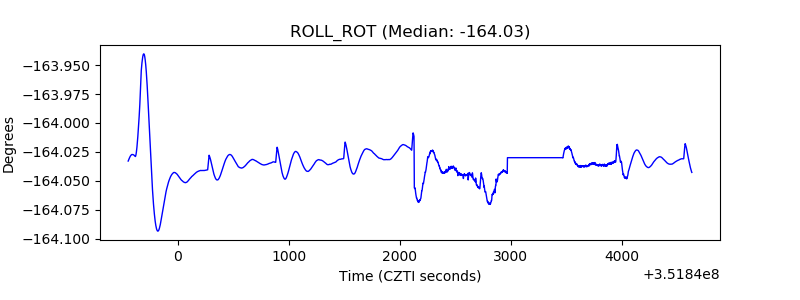 |
| _Roll_DEC | 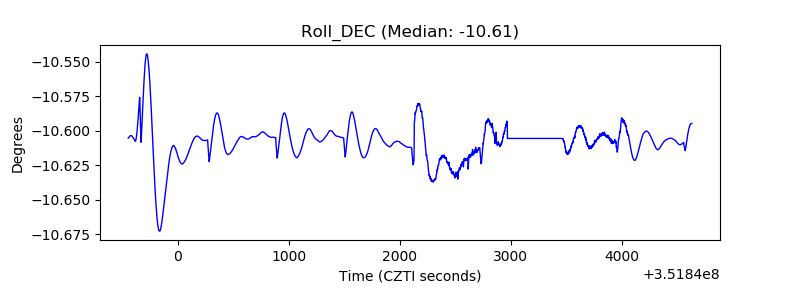 |
| _Roll_RA | 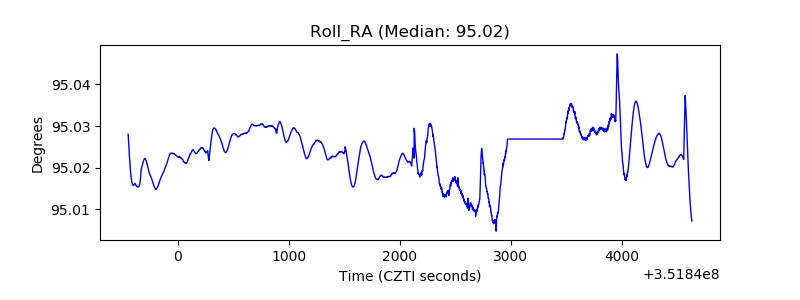 |
| Veto Counter | 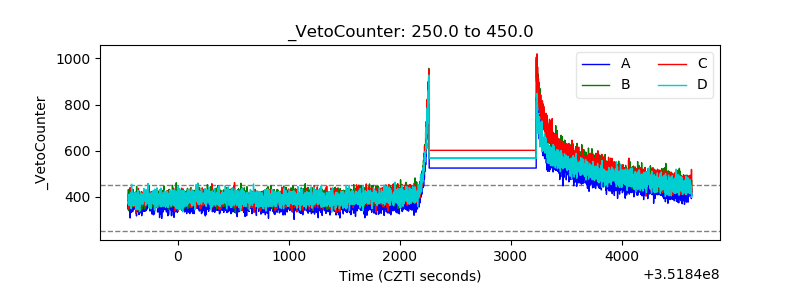 |