| Param | Original file | Final file |
|---|---|---|
| Filename | modeM0/AS1A10_115T01_9000004206_29251cztM0_level2.evt | modeM0/AS1A10_115T01_9000004206_29251cztM0_level2_quad_clean.evt |
| Size (bytes) | 893,638,080 | 64,149,120 |
| Size | 852.2 MB | 61.2 MB |
| Events in quadrant A | 3,239,562 | 444,342 |
| Events in quadrant B | 3,925,191 | 447,211 |
| Events in quadrant C | 14,606,049 | 184,918 |
| Events in quadrant D | 4,864,034 | 420,940 |
| Mode SS | |||
|---|---|---|---|
| Quadrant | BADHDUFLAG | Total packets | Discarded packets |
| A | 0 | 128 | 0 |
| B | 0 | 128 | 0 |
| C | 0 | 128 | 0 |
| D | 0 | 128 | 0 |
| Mode M9 | |||
|---|---|---|---|
| Quadrant | BADHDUFLAG | Total packets | Discarded packets |
| A | 0 | 11 | 0 |
| B | 0 | 11 | 0 |
| C | 0 | 11 | 0 |
| D | 0 | 11 | 0 |
| Mode M0 | |||
|---|---|---|---|
| Quadrant | BADHDUFLAG | Total packets | Discarded packets |
| A | 0 | 13440 | 1 |
| B | 0 | 15583 | 1 |
| C | 0 | 47760 | 1 |
| D | 0 | 18630 | 1 |
| Quadrant | Total seconds | Saturated seconds | Saturation percentage |
|---|---|---|---|
| A | 6354 | 43 | 0.676739% |
| B | 6353 | 176 | 2.770345% |
| C | 6353 | 5835 | 91.846372% |
| D | 6353 | 268 | 4.218479% |
Noise dominated data is calculated using 1-second bins in cleaned event files. If a bin has >2000 counts, and if more than 50% of those come from <1% of pixels, then it is considered to be noise-dominated and hence unusable.
| Quadrant | # 1 sec bins | Bins with >0 counts | Bins with >2000 counts | High rate bins dominated by noise | Noise dominated (total time) | Noise dominated (detector-on time) | Marked lightcurve |
|---|---|---|---|---|---|---|---|
| A | 7469 | 6355 | 0 | 0 | 0.00% | 0.00% | 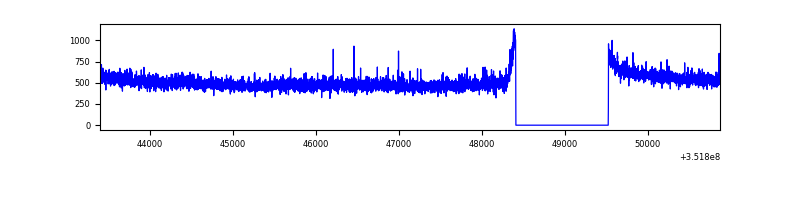 |
| B | 7468 | 6354 | 60 | 60 | 0.80% | 0.94% | 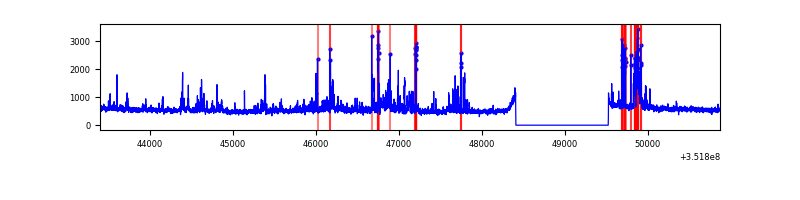 |
| C | 7468 | 6354 | 4826 | 4826 | 64.62% | 75.95% | 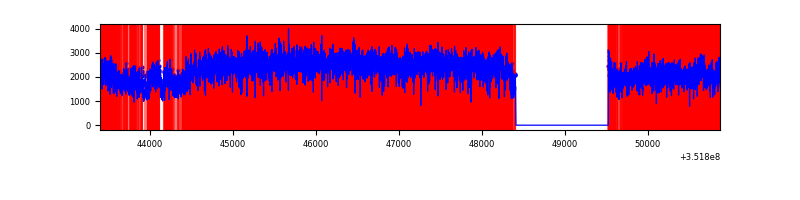 |
| D | 7468 | 6354 | 188 | 188 | 2.52% | 2.96% | 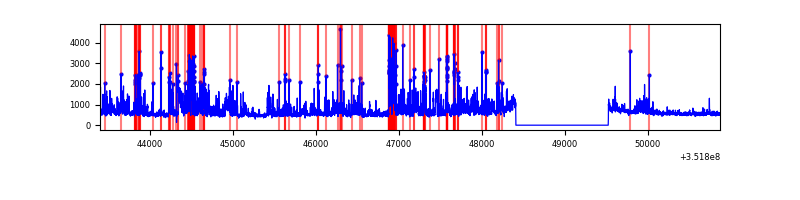 |
Top three noisy pixels from each quadrant. If the there are fewer than three noisy pixels in the level2.evt file, extra rows are filled as -1
| Pixel properties | Quadrant properties | ||||||
|---|---|---|---|---|---|---|---|
| Quadrant | DetID | PixID | Counts | Sigma | Mean | Median | Sigma |
| A | 0 | 13 | 20010 | 116.15 | 833 | 817 | 165.2 |
| A | 13 | 254 | 12420 | 70.22 | 833 | 817 | 165.2 |
| A | 3 | 137 | 7722 | 41.79 | 833 | 817 | 165.2 |
| B | 10 | 245 | 304180 | 1959.13 | 824 | 805 | 154.9 |
| B | 0 | 229 | 167567 | 1076.91 | 824 | 805 | 154.9 |
| B | 0 | 183 | 163546 | 1050.94 | 824 | 805 | 154.9 |
| C | 3 | 233 | 12585228 | 111059.2 | 494 | 500 | 113.3 |
| C | 14 | 238 | 78725 | 690.33 | 494 | 500 | 113.3 |
| C | 2 | 114 | 9335 | 77.97 | 494 | 500 | 113.3 |
| D | 1 | 52 | 1417177 | 7581.84 | 793 | 775 | 186.8 |
| D | 8 | 195 | 227391 | 1213.05 | 793 | 775 | 186.8 |
| D | 7 | 80 | 97849 | 519.63 | 793 | 775 | 186.8 |
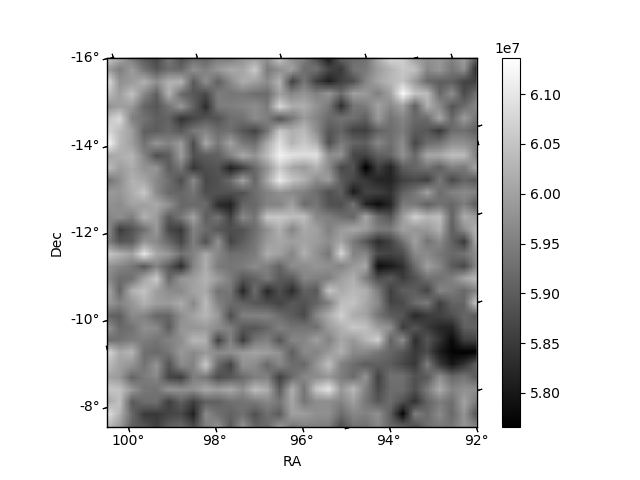
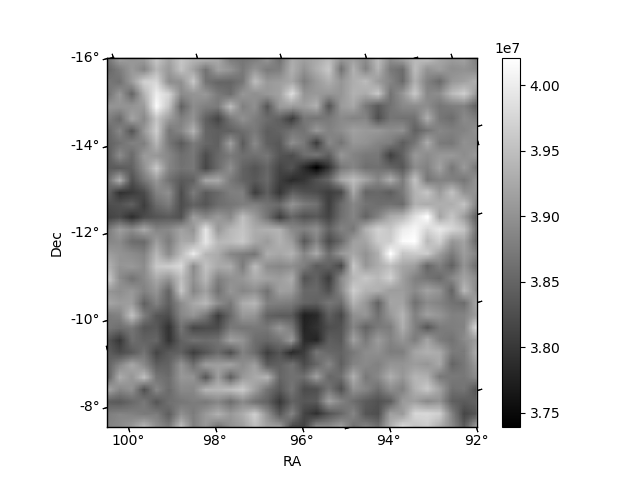
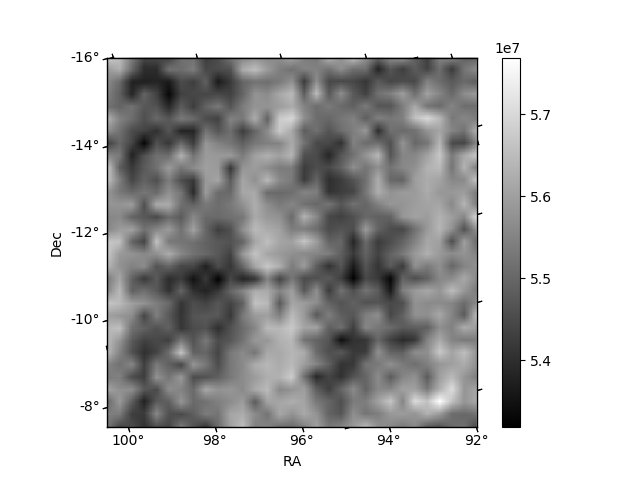
Histogram calculated using DETX and DETY for each event in the final _common_clean file
| Quadrant A | 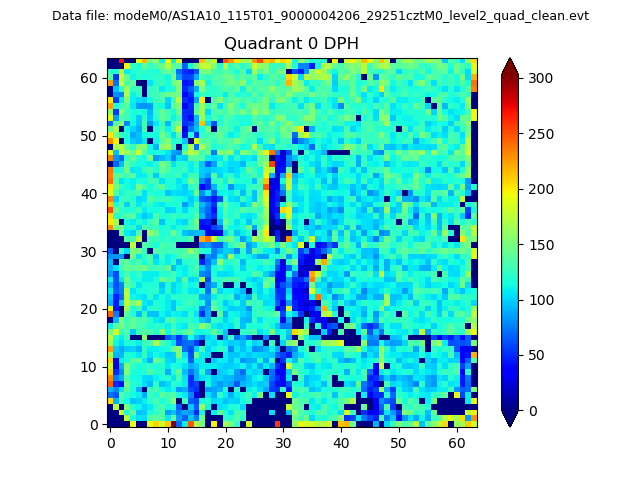 |
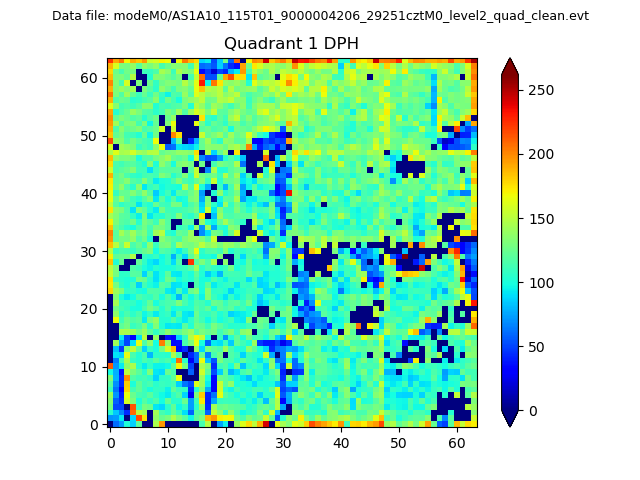 |
Quadrant B |
|---|---|---|---|
| Quadrant D | 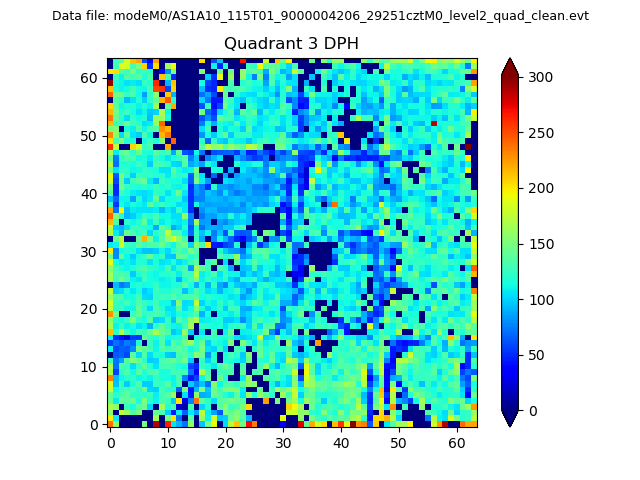 |
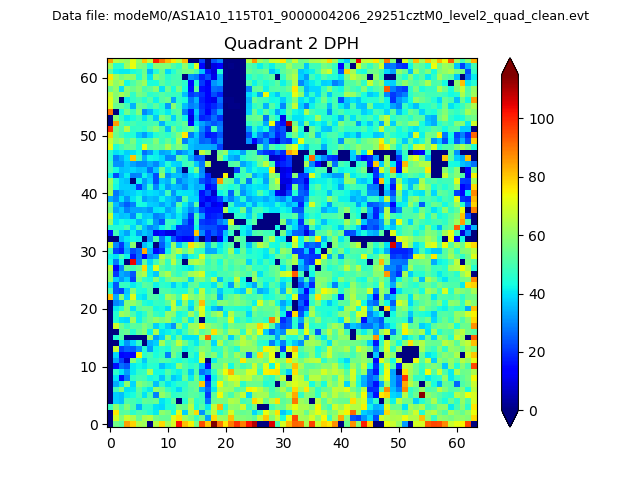 |
Quadrant C |
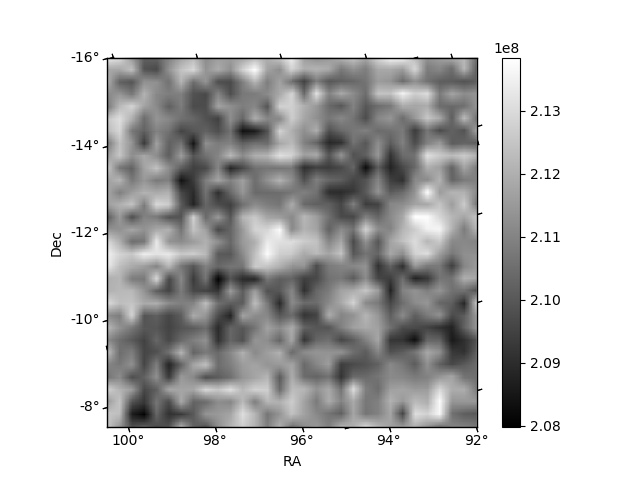
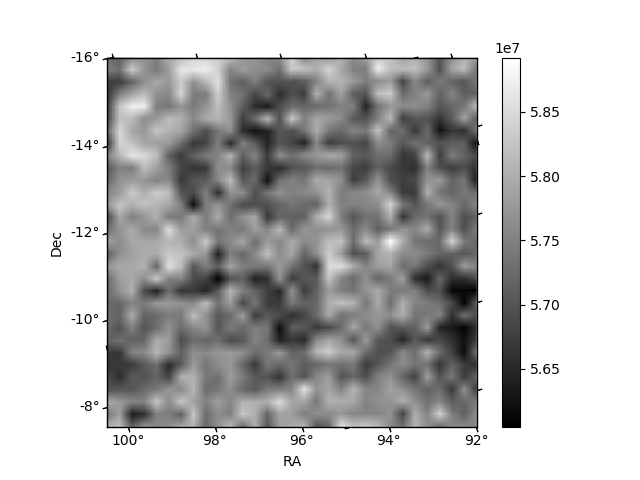
| Plot type | Count rate plots | Images |
|---|---|---|
| Comparison with Poisson distribution Blue bars denote a histogram of data divided into 1 sec bins. Red curve is a Poisson curve with rate = median count rate of data. |
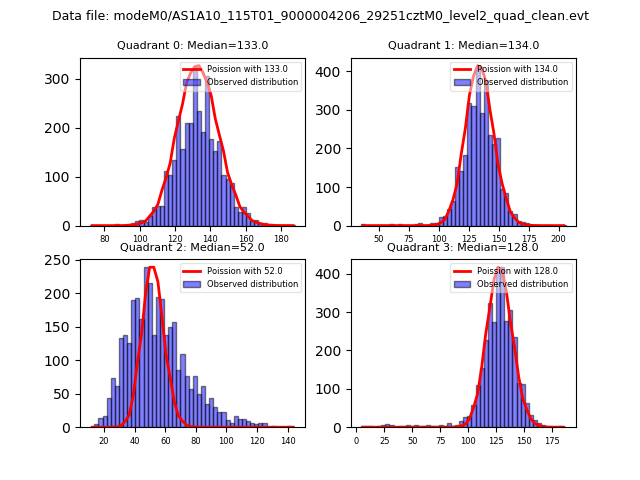 |
 |
| Quadrant-wise count rates Data is divided into 100 sec bins |
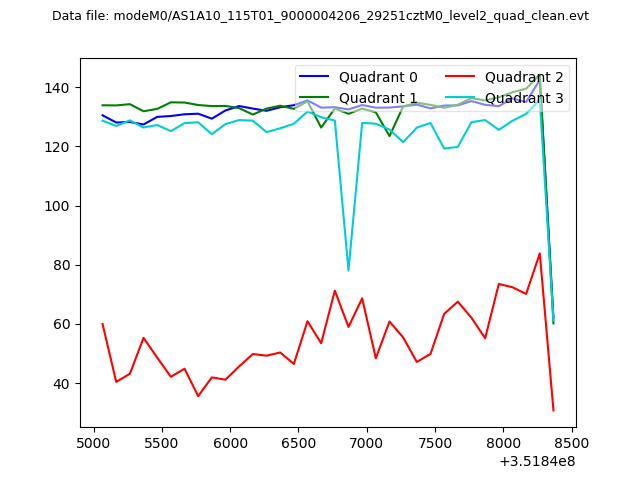 |
|
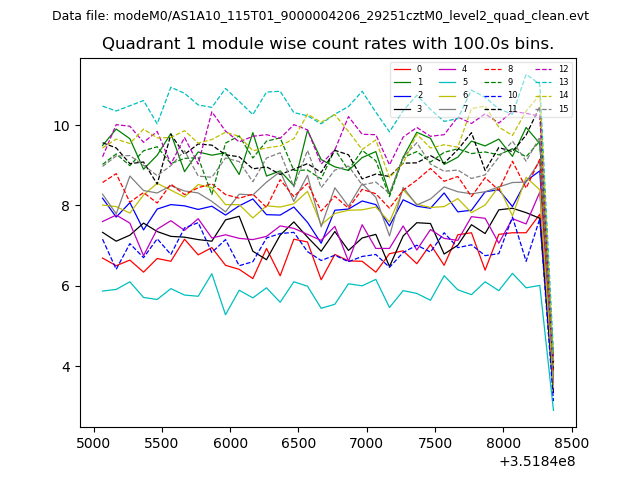
| Module-wise count rates for Quadrant A Data is divided into 100 sec bins |
 |
 |
| Module-wise count rates for Quadrant B Data is divided into 100 sec bins |
 |
 |
| Module-wise count rates for Quadrant C Data is divided into 100 sec bins |
 |
 |
| Module-wise count rates for Quadrant D Data is divided into 100 sec bins |
 |
 |
| Parameter | Plot |
|---|---|
| CZT HV Monitor |  |
| D_VDD | 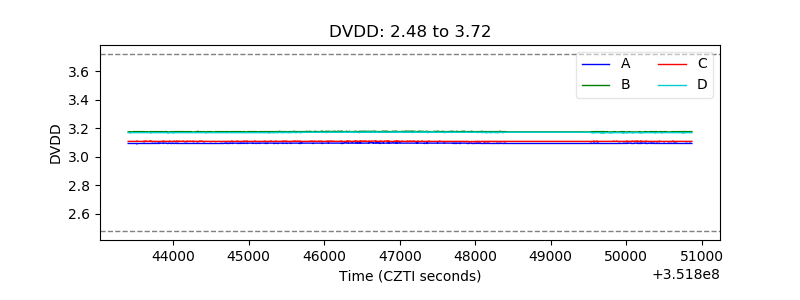 |
| Temperature 1 | 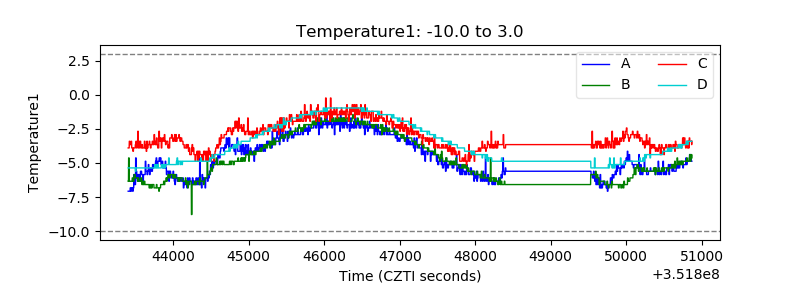 |
| Veto HV Monitor | 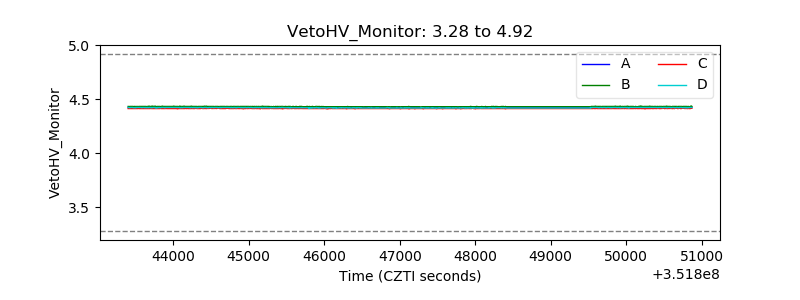 |
| Veto LLD | 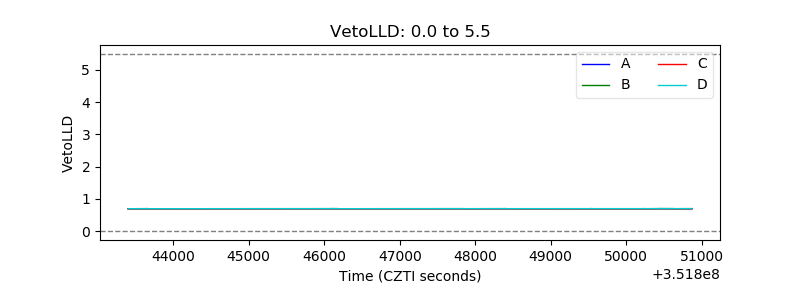 |
| Alpha Counter | 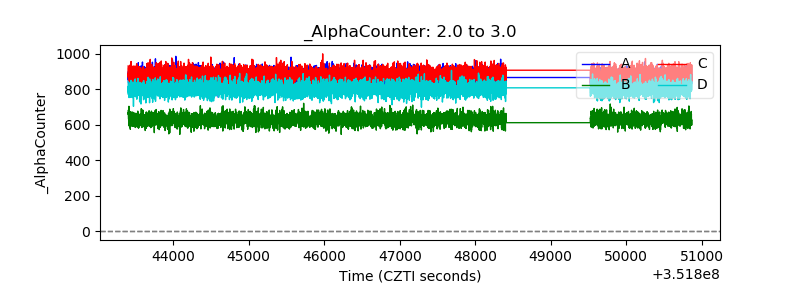 |
| _CPM_Rate | 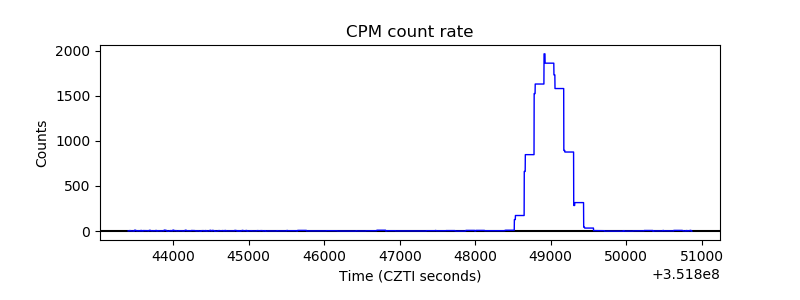 |
| CZT Counter | 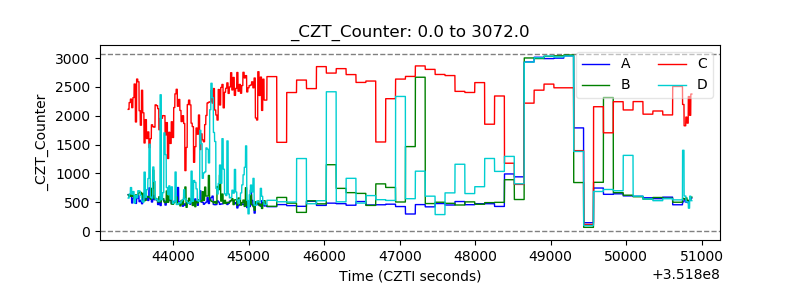 |
| +2.5 Volts monitor |  |
| +5 Volts monitor |  |
| _ROLL_ROT | 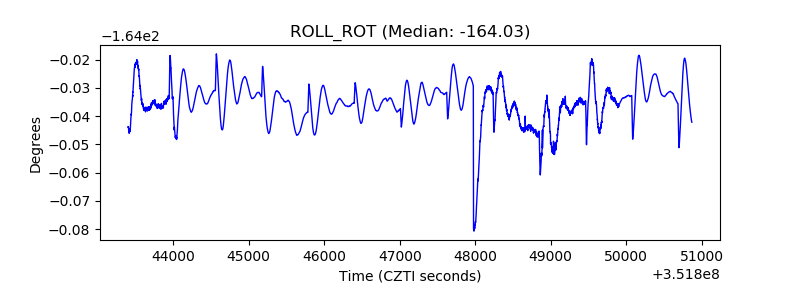 |
| _Roll_DEC | 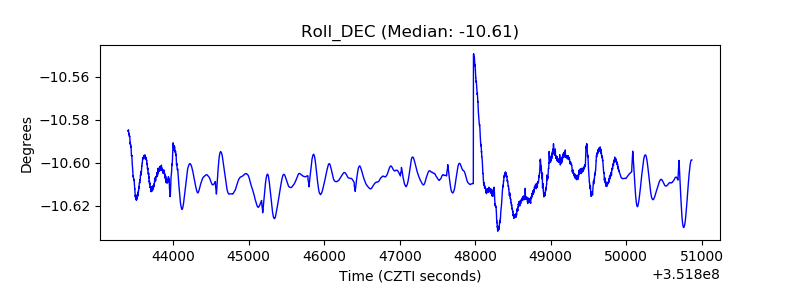 |
| _Roll_RA | 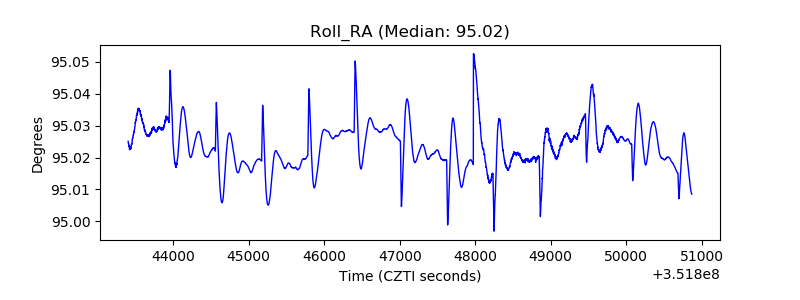 |
| Veto Counter | 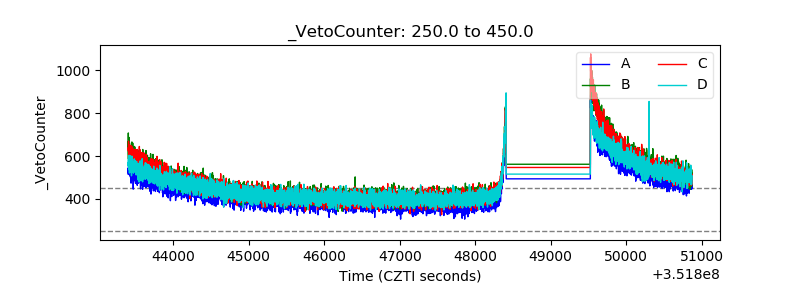 |