| Param | Original file | Final file |
|---|---|---|
| Filename | modeM0/AS1A10_115T01_9000004206_29254cztM0_level2.evt | modeM0/AS1A10_115T01_9000004206_29254cztM0_level2_quad_clean.evt |
| Size (bytes) | 650,661,120 | 108,377,280 |
| Size | 620.5 MB | 103.4 MB |
| Events in quadrant A | 3,175,350 | 754,860 |
| Events in quadrant B | 3,769,408 | 756,517 |
| Events in quadrant C | 7,093,820 | 677,382 |
| Events in quadrant D | 5,274,248 | 686,890 |
| Mode SS | |||
|---|---|---|---|
| Quadrant | BADHDUFLAG | Total packets | Discarded packets |
| A | 0 | 120 | 0 |
| B | 0 | 120 | 0 |
| C | 0 | 120 | 0 |
| D | 0 | 120 | 0 |
| Mode M9 | |||
|---|---|---|---|
| Quadrant | BADHDUFLAG | Total packets | Discarded packets |
| A | 0 | 12 | 0 |
| B | 0 | 12 | 0 |
| C | 0 | 12 | 0 |
| D | 0 | 12 | 0 |
| Mode M0 | |||
|---|---|---|---|
| Quadrant | BADHDUFLAG | Total packets | Discarded packets |
| A | 0 | 13085 | 1 |
| B | 0 | 15148 | 1 |
| C | 0 | 25191 | 5 |
| D | 0 | 19747 | 1 |
| Quadrant | Total seconds | Saturated seconds | Saturation percentage |
|---|---|---|---|
| A | 5808 | 133 | 2.289945% |
| B | 5809 | 211 | 3.632295% |
| C | 5808 | 923 | 15.891873% |
| D | 5808 | 466 | 8.023416% |
Noise dominated data is calculated using 1-second bins in cleaned event files. If a bin has >2000 counts, and if more than 50% of those come from <1% of pixels, then it is considered to be noise-dominated and hence unusable.
| Quadrant | # 1 sec bins | Bins with >0 counts | Bins with >2000 counts | High rate bins dominated by noise | Noise dominated (total time) | Noise dominated (detector-on time) | Marked lightcurve |
|---|---|---|---|---|---|---|---|
| A | 7058 | 5809 | 0 | 0 | 0.00% | 0.00% | 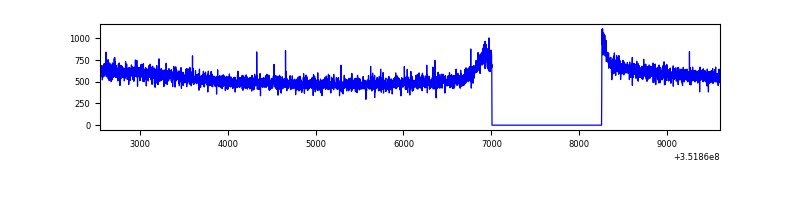 |
| B | 7059 | 5810 | 45 | 45 | 0.64% | 0.77% | 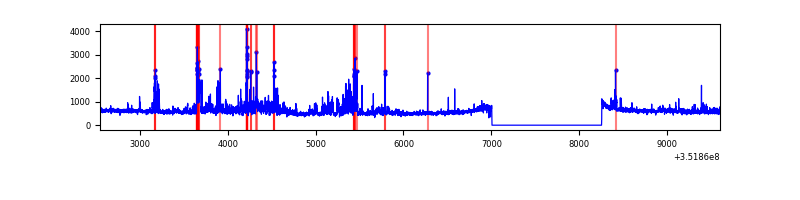 |
| C | 7058 | 5809 | 226 | 226 | 3.20% | 3.89% | 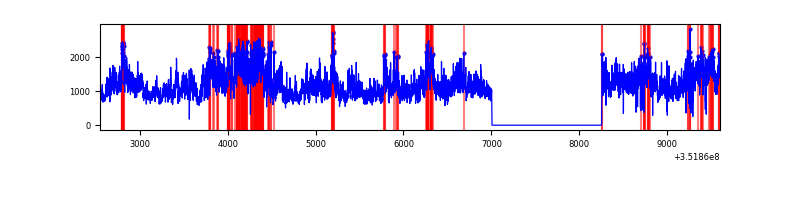 |
| D | 7058 | 5809 | 283 | 283 | 4.01% | 4.87% | 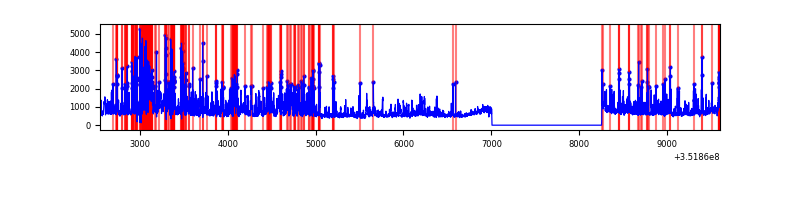 |
Top three noisy pixels from each quadrant. If the there are fewer than three noisy pixels in the level2.evt file, extra rows are filled as -1
| Pixel properties | Quadrant properties | ||||||
|---|---|---|---|---|---|---|---|
| Quadrant | DetID | PixID | Counts | Sigma | Mean | Median | Sigma |
| A | 13 | 254 | 15126 | 88.73 | 818 | 804 | 161.4 |
| A | 0 | 13 | 12618 | 73.19 | 818 | 804 | 161.4 |
| A | 3 | 137 | 7386 | 40.78 | 818 | 804 | 161.4 |
| B | 0 | 183 | 274940 | 1832.3 | 798 | 781 | 149.6 |
| B | 0 | 229 | 155259 | 1032.43 | 798 | 781 | 149.6 |
| B | 5 | 255 | 81213 | 537.55 | 798 | 781 | 149.6 |
| C | 3 | 233 | 3994375 | 23801.57 | 736 | 744 | 167.8 |
| C | 14 | 238 | 157509 | 934.3 | 736 | 744 | 167.8 |
| C | 14 | 254 | 59886 | 352.48 | 736 | 744 | 167.8 |
| D | 1 | 52 | 1275581 | 7060.53 | 767 | 748 | 180.6 |
| D | 8 | 195 | 626681 | 3466.67 | 767 | 748 | 180.6 |
| D | 13 | 153 | 230404 | 1271.93 | 767 | 748 | 180.6 |
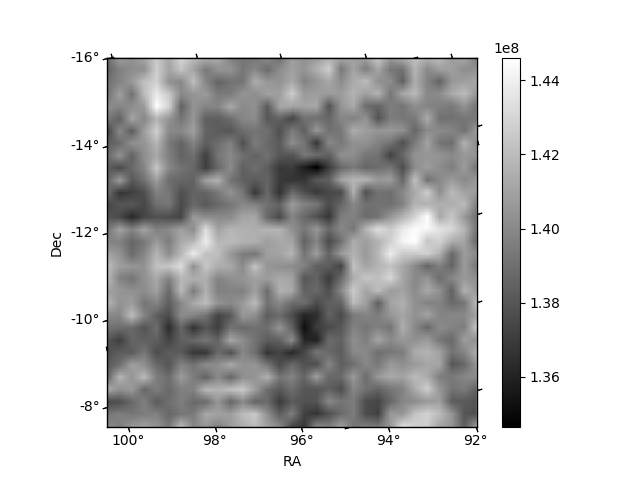
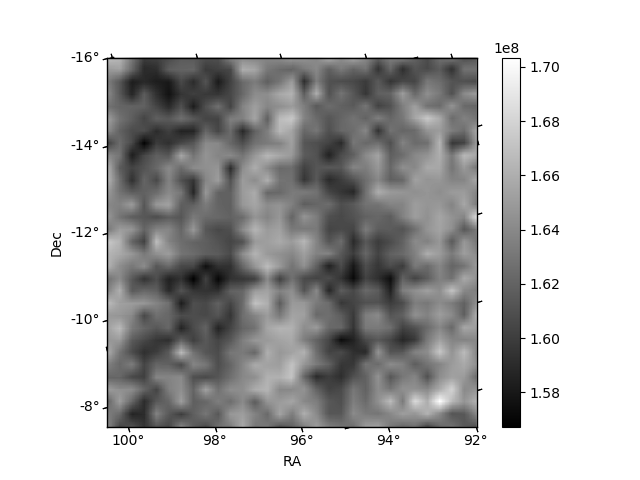
Histogram calculated using DETX and DETY for each event in the final _common_clean file
| Quadrant A |  |
 |
Quadrant B |
|---|---|---|---|
| Quadrant D | 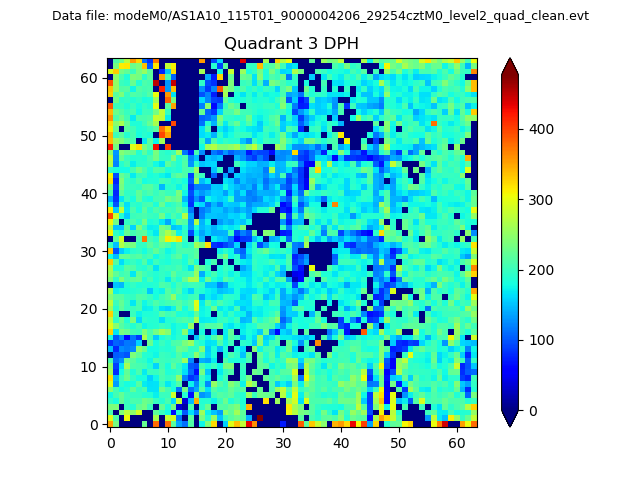 |
 |
Quadrant C |
| Plot type | Count rate plots | Images |
|---|---|---|
| Comparison with Poisson distribution Blue bars denote a histogram of data divided into 1 sec bins. Red curve is a Poisson curve with rate = median count rate of data. |
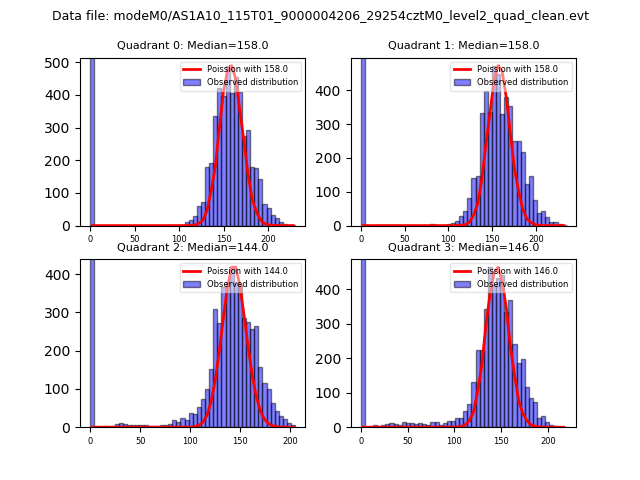 |
 |
| Quadrant-wise count rates Data is divided into 100 sec bins |
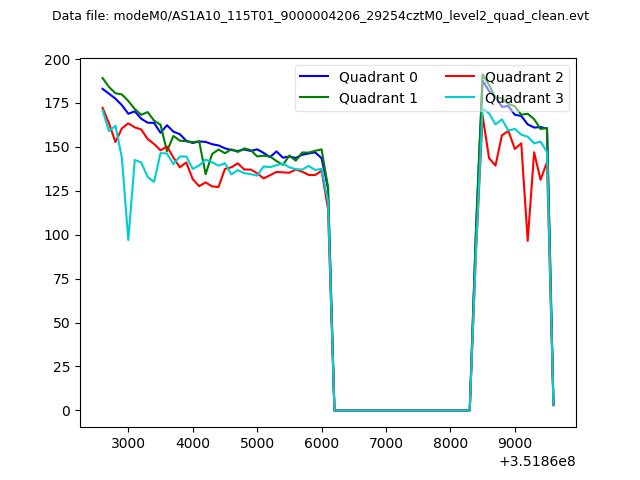 |
|
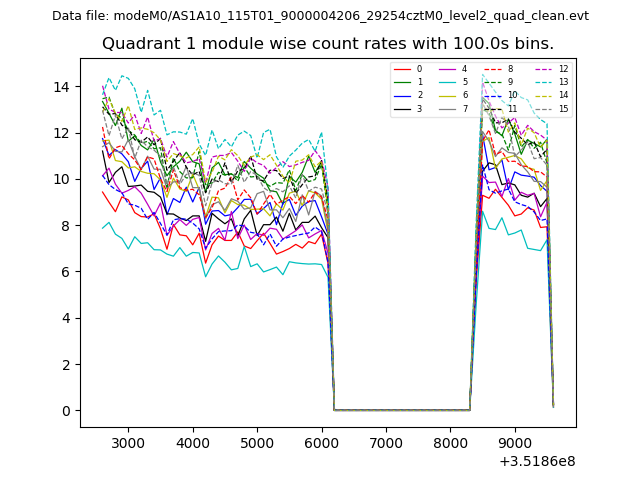
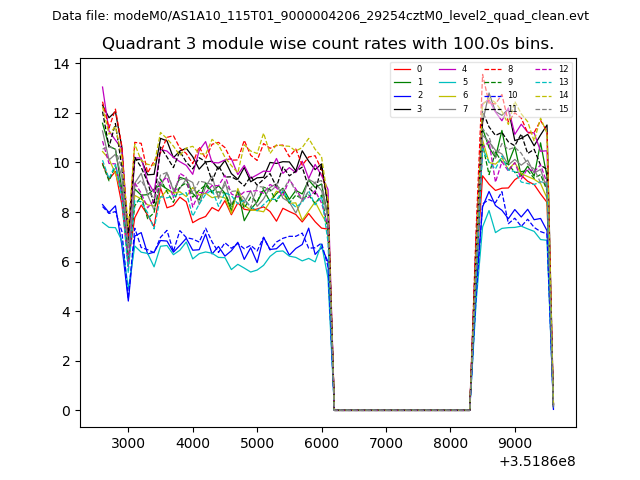
| Module-wise count rates for Quadrant A Data is divided into 100 sec bins |
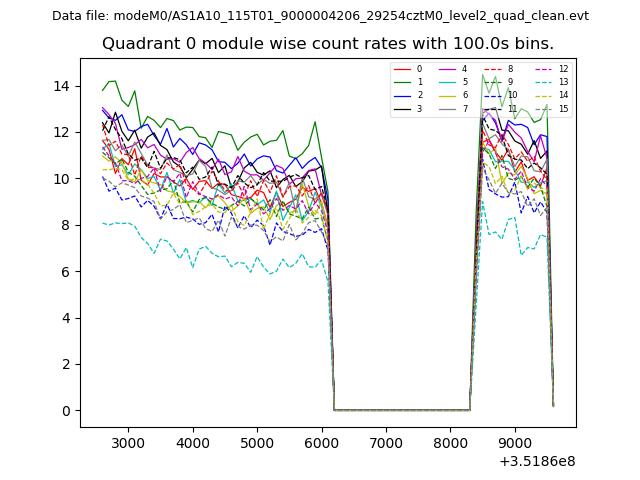 |
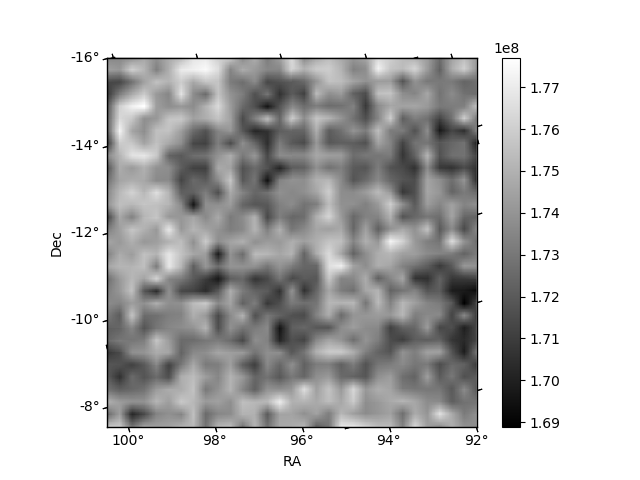 |
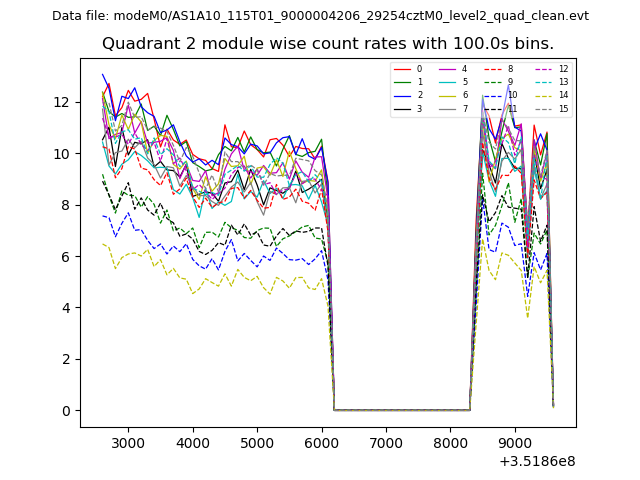
| Module-wise count rates for Quadrant B Data is divided into 100 sec bins |
 |
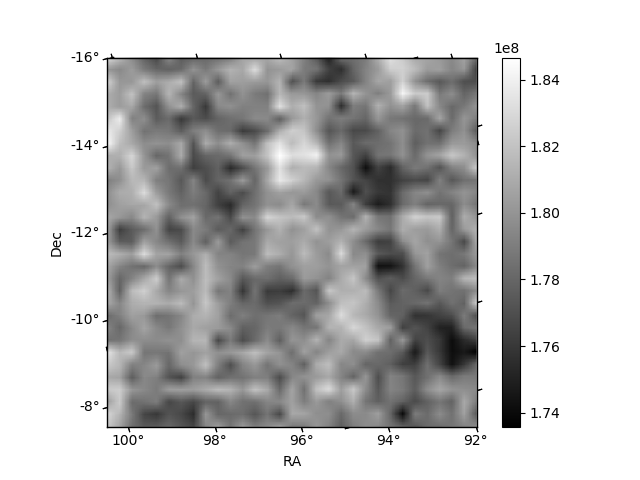 |
| Module-wise count rates for Quadrant C Data is divided into 100 sec bins |
 |
 |
| Module-wise count rates for Quadrant D Data is divided into 100 sec bins |
 |
 |
| Parameter | Plot |
|---|---|
| CZT HV Monitor | 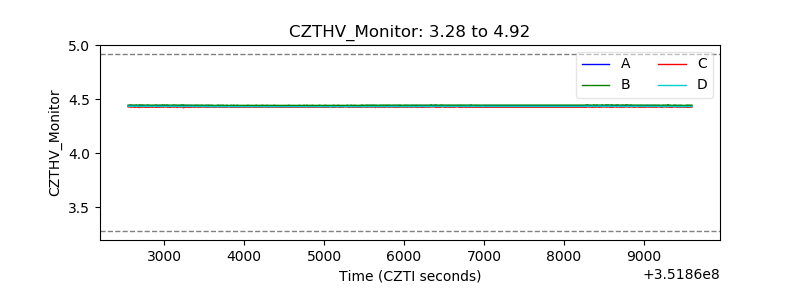 |
| D_VDD | 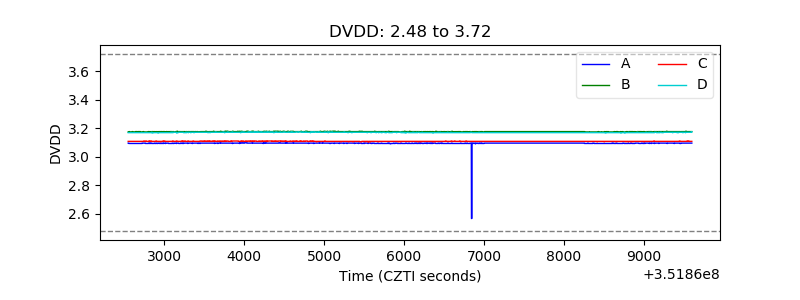 |
| Temperature 1 | 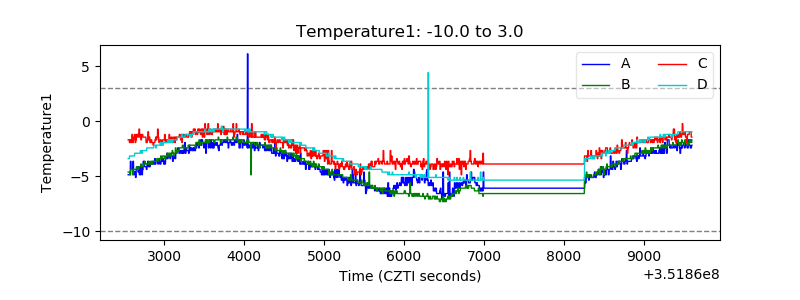 |
| Veto HV Monitor | 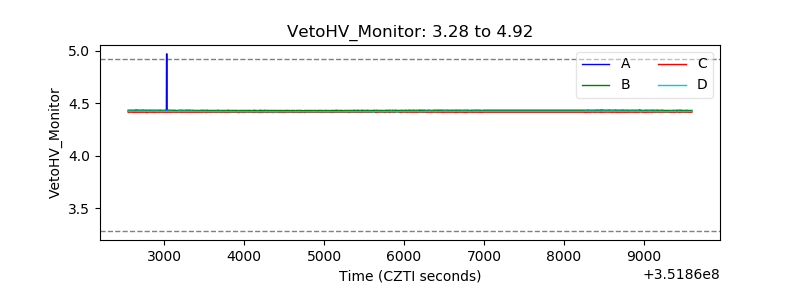 |
| Veto LLD | 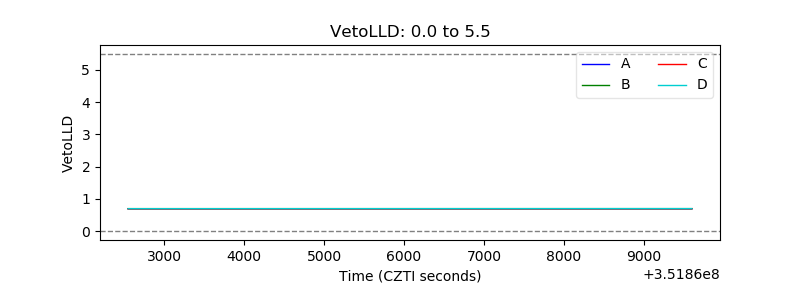 |
| Alpha Counter | 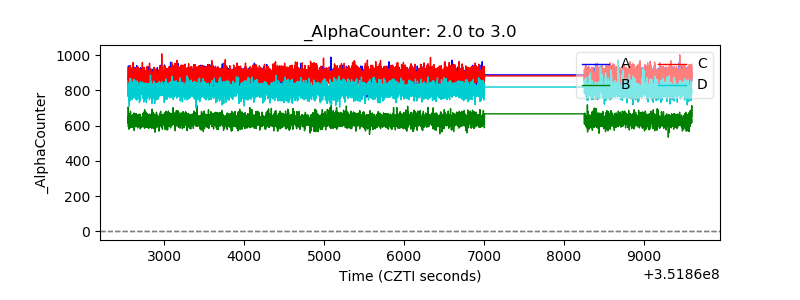 |
| _CPM_Rate | 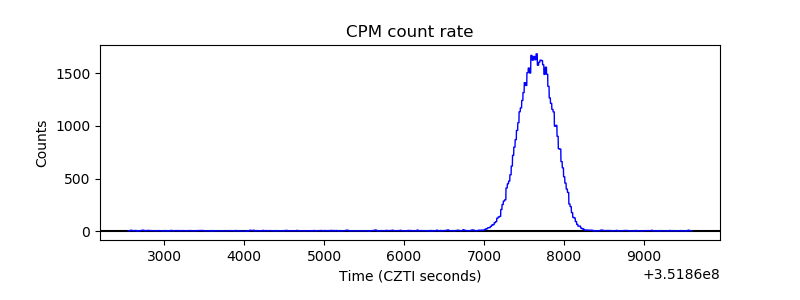 |
| CZT Counter |  |
| +2.5 Volts monitor |  |
| +5 Volts monitor | 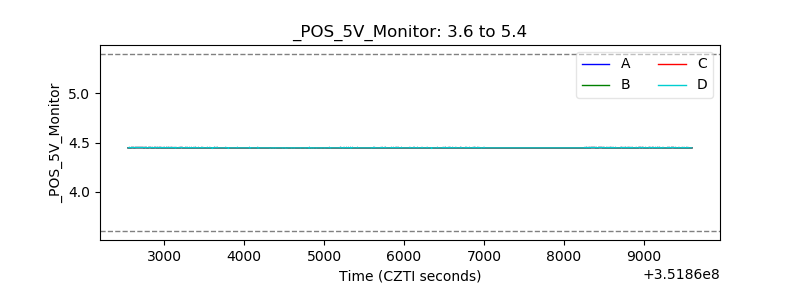 |
| _ROLL_ROT |  |
| _Roll_DEC |  |
| _Roll_RA |  |
| Veto Counter | 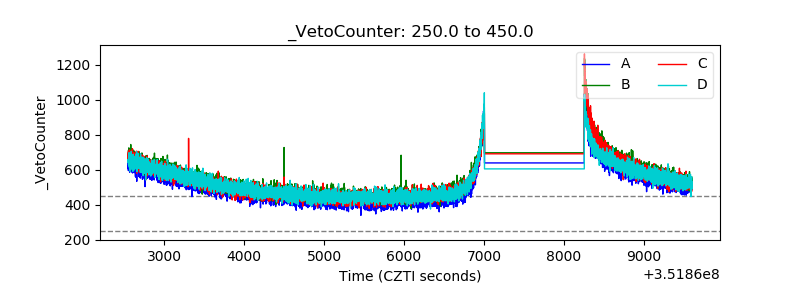 |