| Param | Original file | Final file |
|---|---|---|
| Filename | modeM0/AS1A10_115T01_9000004206_29255cztM0_level2.evt | modeM0/AS1A10_115T01_9000004206_29255cztM0_level2_quad_clean.evt |
| Size (bytes) | 334,247,040 | 53,867,520 |
| Size | 318.8 MB | 51.4 MB |
| Events in quadrant A | 1,303,847 | 392,803 |
| Events in quadrant B | 1,661,208 | 391,476 |
| Events in quadrant C | 4,793,412 | 292,714 |
| Events in quadrant D | 2,187,508 | 367,903 |
| Mode SS | |||
|---|---|---|---|
| Quadrant | BADHDUFLAG | Total packets | Discarded packets |
| A | 0 | 52 | 0 |
| B | 0 | 52 | 0 |
| C | 0 | 52 | 0 |
| D | 0 | 52 | 0 |
| Mode M0 | |||
|---|---|---|---|
| Quadrant | BADHDUFLAG | Total packets | Discarded packets |
| A | 0 | 5394 | 0 |
| B | 0 | 6611 | 0 |
| C | 0 | 16037 | 0 |
| D | 0 | 8328 | 0 |
| Quadrant | Total seconds | Saturated seconds | Saturation percentage |
|---|---|---|---|
| A | 2586 | 1 | 0.038670% |
| B | 2586 | 49 | 1.894818% |
| C | 2587 | 1535 | 59.335137% |
| D | 2587 | 100 | 3.865481% |
Noise dominated data is calculated using 1-second bins in cleaned event files. If a bin has >2000 counts, and if more than 50% of those come from <1% of pixels, then it is considered to be noise-dominated and hence unusable.
| Quadrant | # 1 sec bins | Bins with >0 counts | Bins with >2000 counts | High rate bins dominated by noise | Noise dominated (total time) | Noise dominated (detector-on time) | Marked lightcurve |
|---|---|---|---|---|---|---|---|
| A | 2586 | 2586 | 0 | 0 | 0.00% | 0.00% | 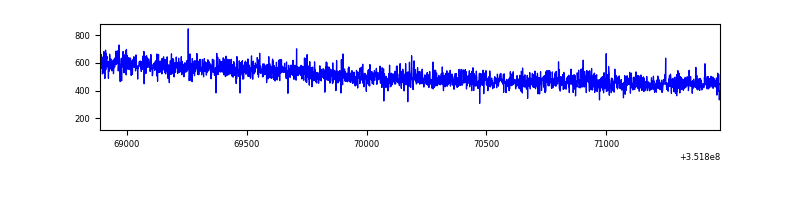 |
| B | 2586 | 2586 | 39 | 39 | 1.51% | 1.51% | 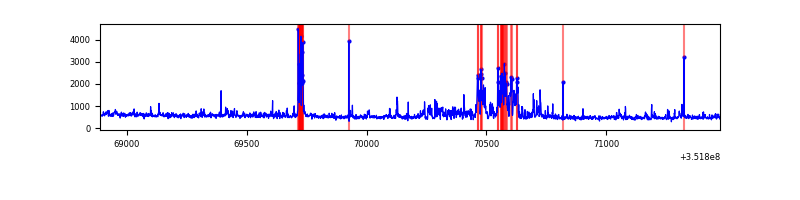 |
| C | 2587 | 2587 | 1162 | 1162 | 44.92% | 44.92% | 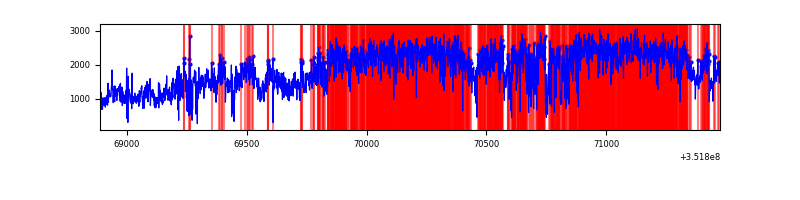 |
| D | 2587 | 2587 | 105 | 105 | 4.06% | 4.06% | 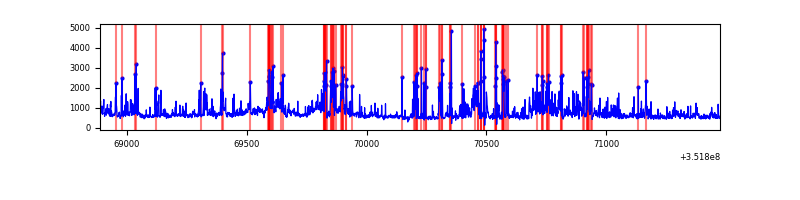 |
Top three noisy pixels from each quadrant. If the there are fewer than three noisy pixels in the level2.evt file, extra rows are filled as -1
| Pixel properties | Quadrant properties | ||||||
|---|---|---|---|---|---|---|---|
| Quadrant | DetID | PixID | Counts | Sigma | Mean | Median | Sigma |
| A | 0 | 13 | 17993 | 263.14 | 332 | 325 | 67.1 |
| A | 13 | 254 | 8907 | 127.82 | 332 | 325 | 67.1 |
| A | 0 | 226 | 2907 | 38.45 | 332 | 325 | 67.1 |
| B | 10 | 245 | 141630 | 2268.35 | 323 | 318 | 62.3 |
| B | 0 | 183 | 121116 | 1939.06 | 323 | 318 | 62.3 |
| B | 10 | 246 | 57036 | 910.44 | 323 | 318 | 62.3 |
| C | 3 | 233 | 3596424 | 59166.29 | 258 | 261 | 60.8 |
| C | 14 | 238 | 97923 | 1606.8 | 258 | 261 | 60.8 |
| C | 14 | 254 | 83196 | 1364.5 | 258 | 261 | 60.8 |
| D | 1 | 52 | 485671 | 6393.05 | 316 | 308 | 75.9 |
| D | 7 | 80 | 232211 | 3054.56 | 316 | 308 | 75.9 |
| D | 12 | 79 | 142463 | 1872.42 | 316 | 308 | 75.9 |
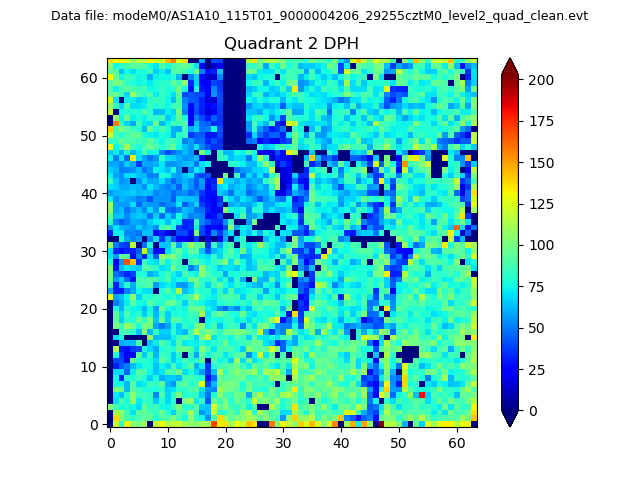
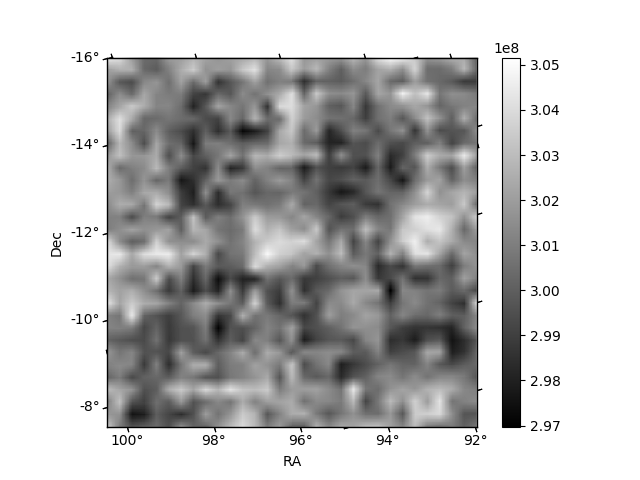
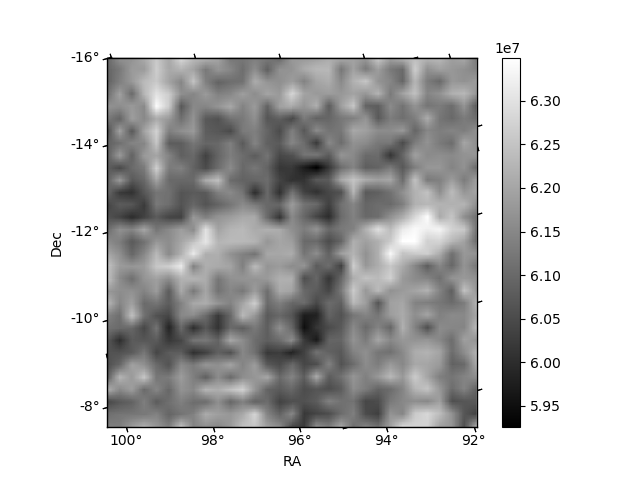
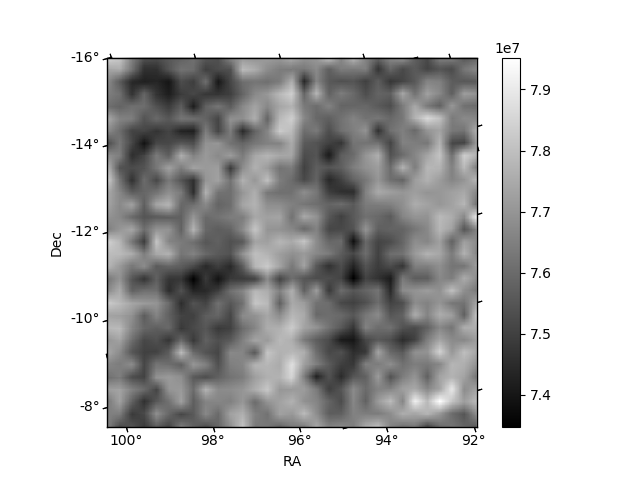
Histogram calculated using DETX and DETY for each event in the final _common_clean file
| Quadrant A | 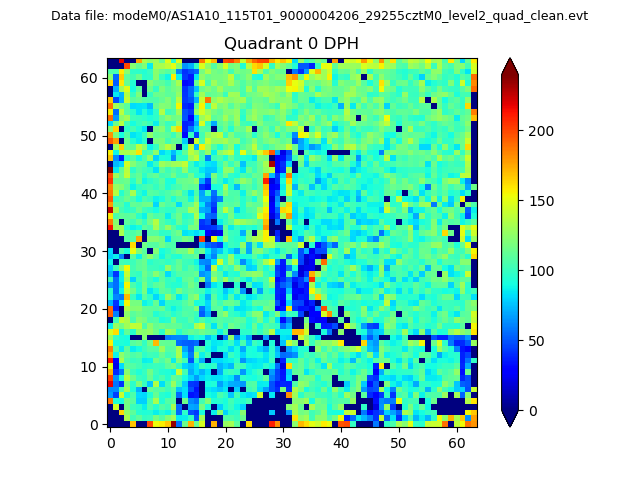 |
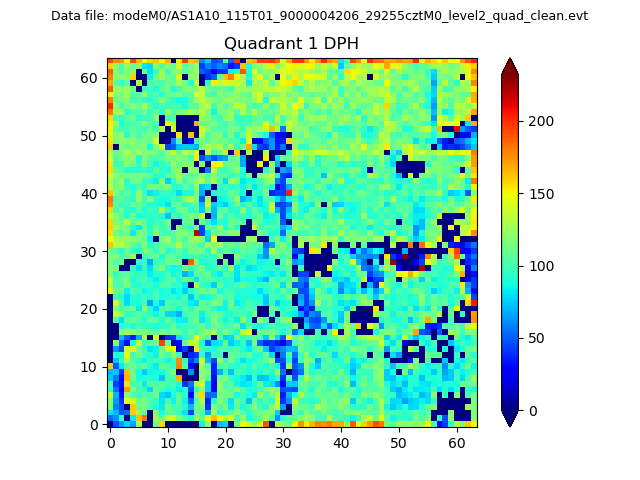 |
Quadrant B |
|---|---|---|---|
| Quadrant D | 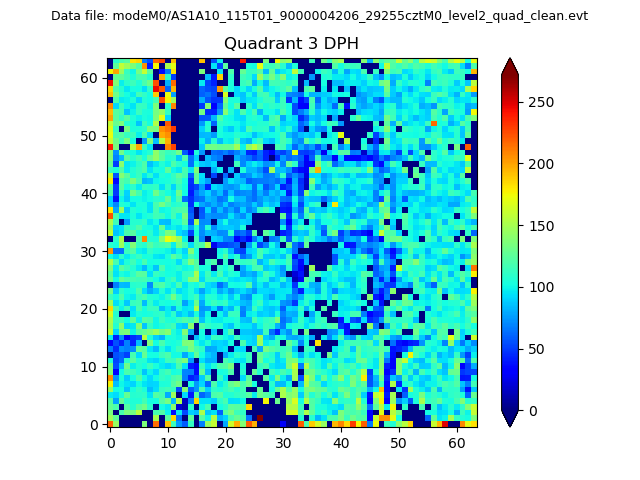 |
 |
Quadrant C |
| Plot type | Count rate plots | Images |
|---|---|---|
| Comparison with Poisson distribution Blue bars denote a histogram of data divided into 1 sec bins. Red curve is a Poisson curve with rate = median count rate of data. |
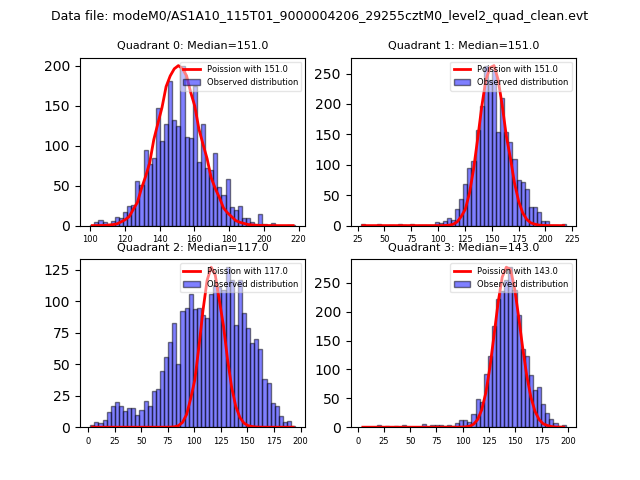 |
 |
| Quadrant-wise count rates Data is divided into 100 sec bins |
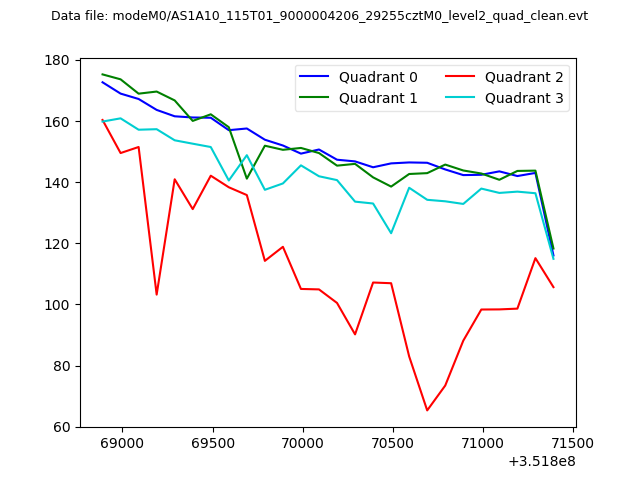 |
|
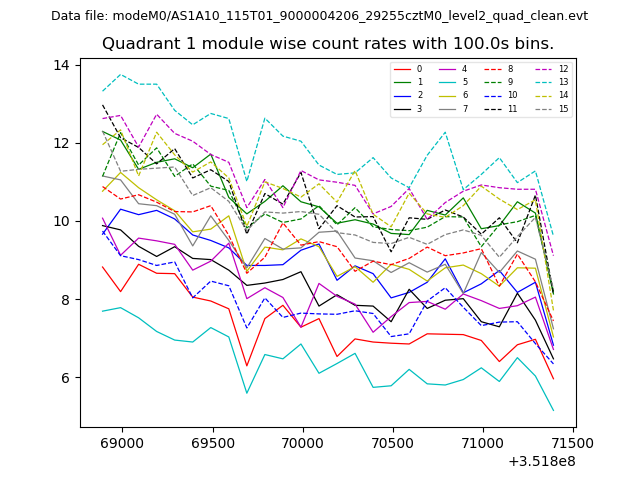
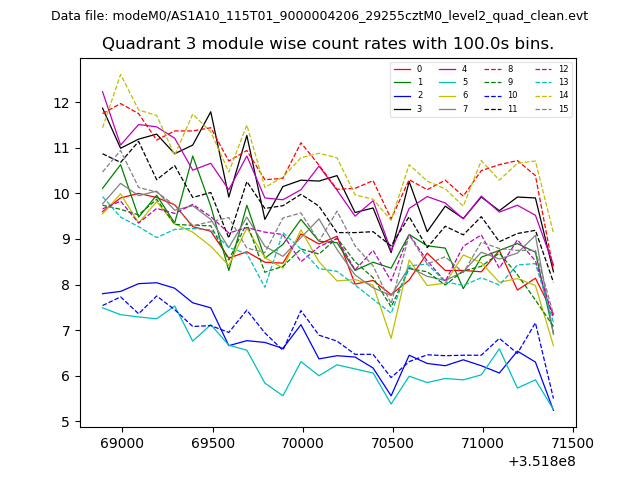
| Module-wise count rates for Quadrant A Data is divided into 100 sec bins |
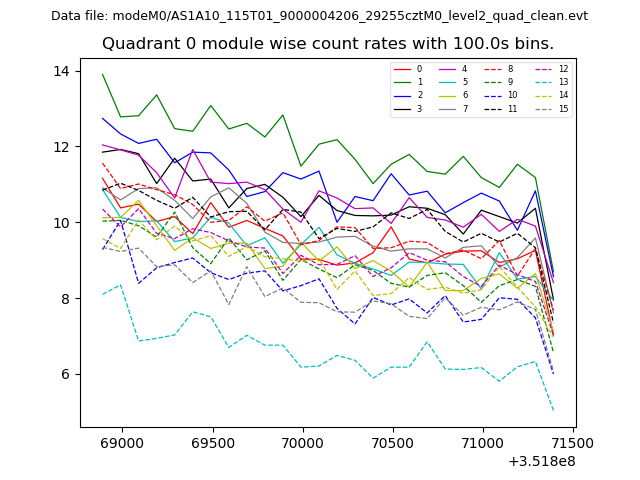 |
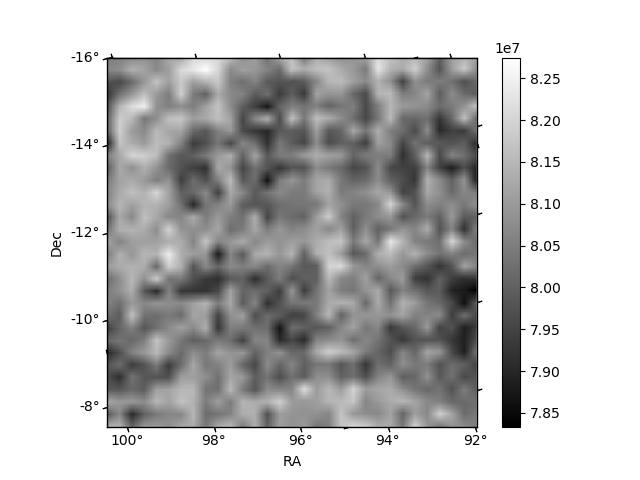 |
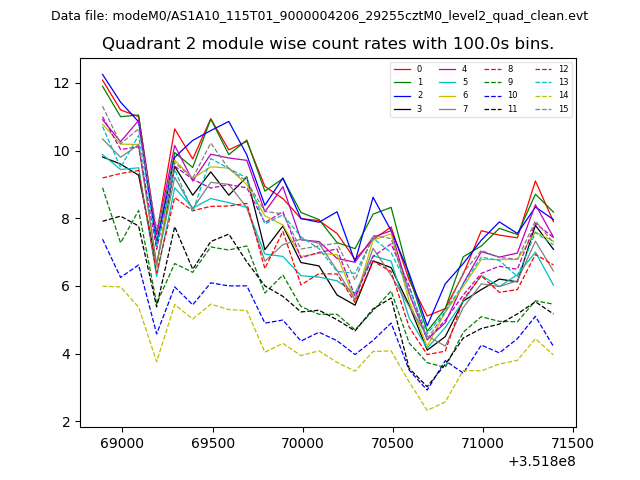
| Module-wise count rates for Quadrant B Data is divided into 100 sec bins |
 |
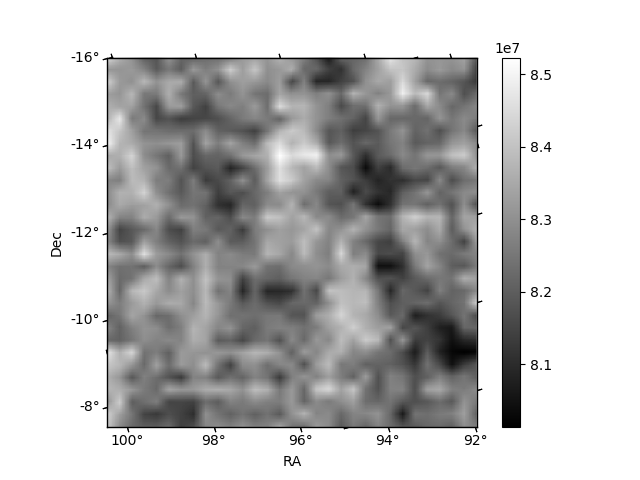 |
| Module-wise count rates for Quadrant C Data is divided into 100 sec bins |
 |
 |
| Module-wise count rates for Quadrant D Data is divided into 100 sec bins |
 |
 |
| Parameter | Plot |
|---|---|
| CZT HV Monitor | 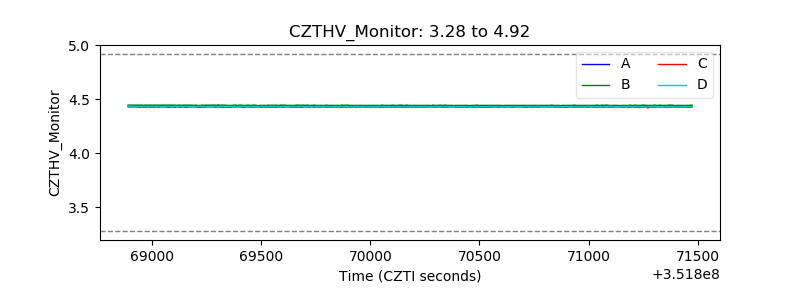 |
| D_VDD | 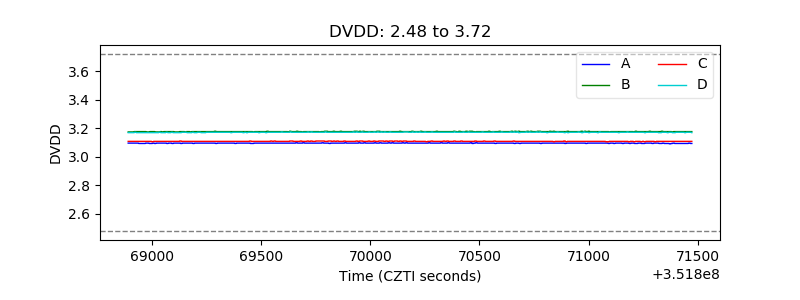 |
| Temperature 1 | 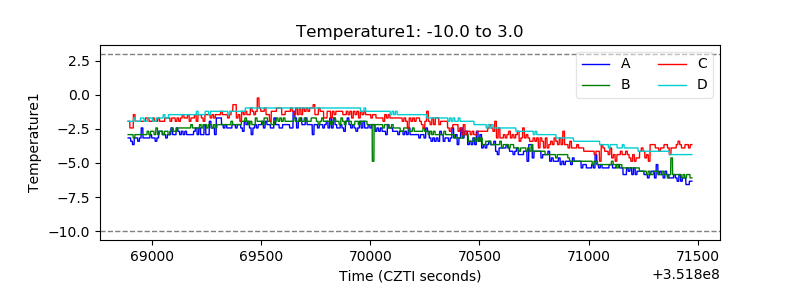 |
| Veto HV Monitor | 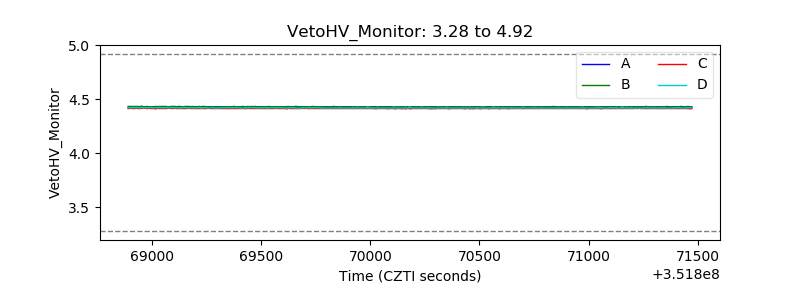 |
| Veto LLD | 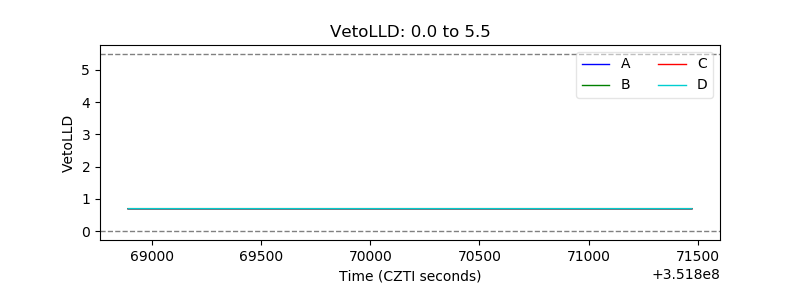 |
| Alpha Counter | 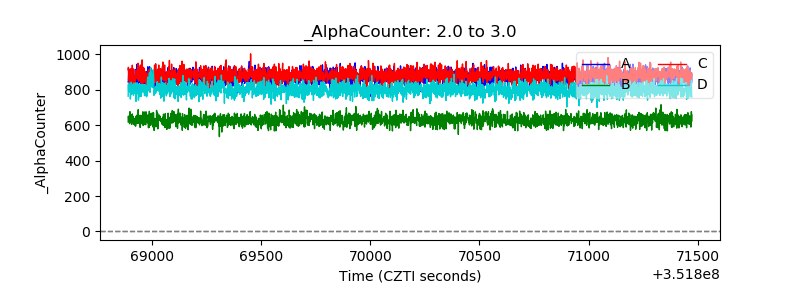 |
| _CPM_Rate | 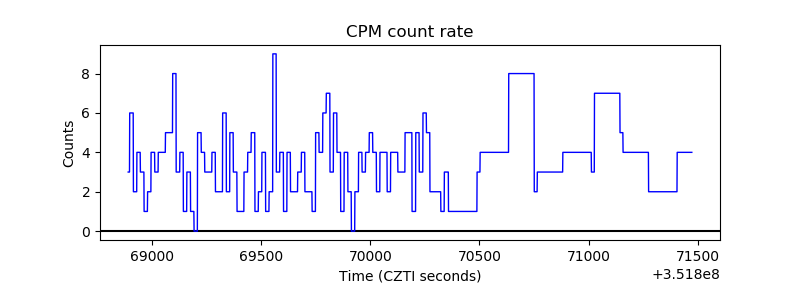 |
| CZT Counter | 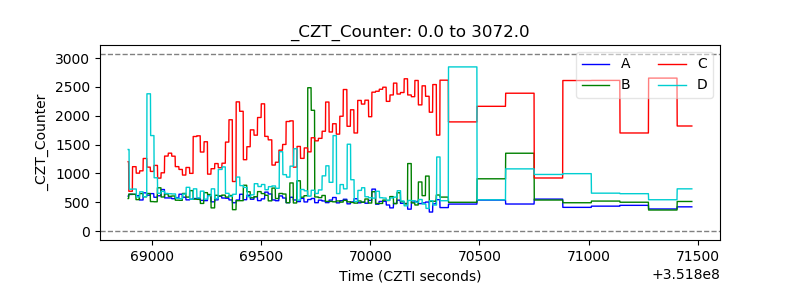 |
| +2.5 Volts monitor |  |
| +5 Volts monitor |  |
| _ROLL_ROT | 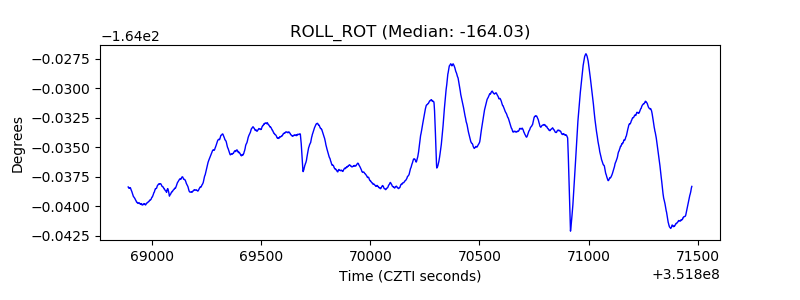 |
| _Roll_DEC | 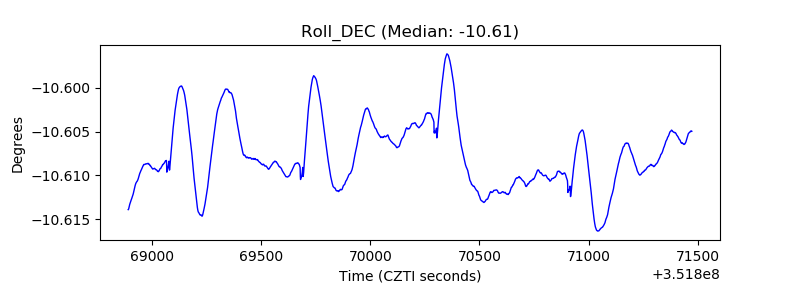 |
| _Roll_RA | 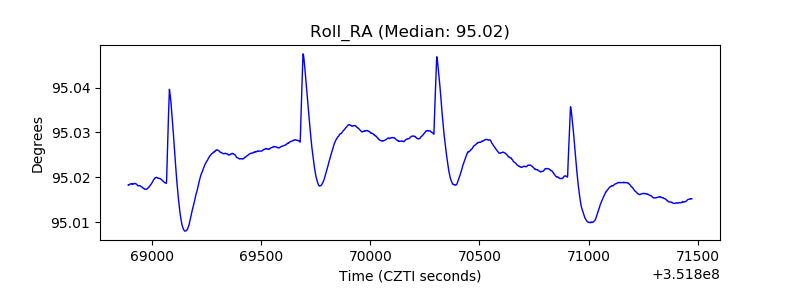 |
| Veto Counter | 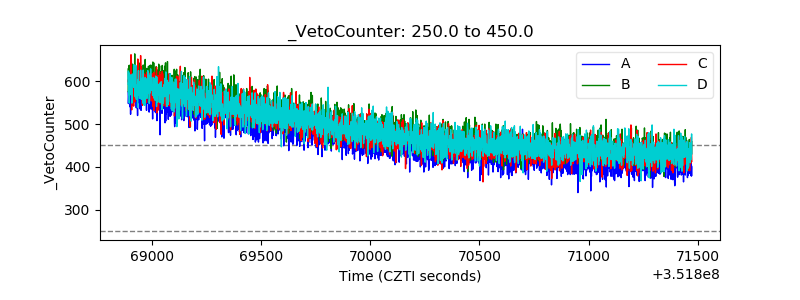 |