| Param | Original file | Final file |
|---|---|---|
| Filename | modeM0/AS1A10_021T10_9000004210cztM0_level2.fits | modeM0/AS1A10_021T10_9000004210cztM0_level2_quad_clean.evt |
| Size (bytes) | 137,041,920 | 56,727,360 |
| Size | 130.7 MB | 54.1 MB |
| Events in quadrant A | 900,250 | 230,273 |
| Events in quadrant B | 833,966 | 227,852 |
| Events in quadrant C | 826,542 | 206,547 |
| Events in quadrant D | 718,726 | 181,557 |
| Mode SS | |||
|---|---|---|---|
| Quadrant | BADHDUFLAG | Total packets | Discarded packets |
| A | 0 | 254 | 0 |
| B | 0 | 256 | 0 |
| C | 0 | 254 | 0 |
| D | 0 | 254 | 0 |
| Mode M9 | |||
|---|---|---|---|
| Quadrant | BADHDUFLAG | Total packets | Discarded packets |
| A | 0 | 71 | 0 |
| B | 0 | 71 | 0 |
| C | 0 | 71 | 0 |
| D | 0 | 71 | 0 |
| Mode M0 | |||
|---|---|---|---|
| Quadrant | BADHDUFLAG | Total packets | Discarded packets |
| A | 0 | 27115 | 0 |
| B | 0 | 30282 | 0 |
| C | 0 | 30879 | 0 |
| D | 0 | 49073 | 0 |
| Quadrant | Total seconds | Saturated seconds | Saturation percentage |
|---|---|---|---|
| A | 12594 | 113 | 0.897253% |
| B | 12603 | 268 | 2.126478% |
| C | 12601 | 1024 | 8.126339% |
| D | 12568 | 1717 | 13.661680% |
Noise dominated data is calculated using 1-second bins in cleaned event files. If a bin has >2000 counts, and if more than 50% of those come from <1% of pixels, then it is considered to be noise-dominated and hence unusable.
| Quadrant | # 1 sec bins | Bins with >0 counts | Bins with >2000 counts | High rate bins dominated by noise | Noise dominated (total time) | Noise dominated (detector-on time) | Marked lightcurve |
|---|---|---|---|---|---|---|---|
| A | 18721 | 12620 | 0 | 0 | 0.00% | 0.00% | 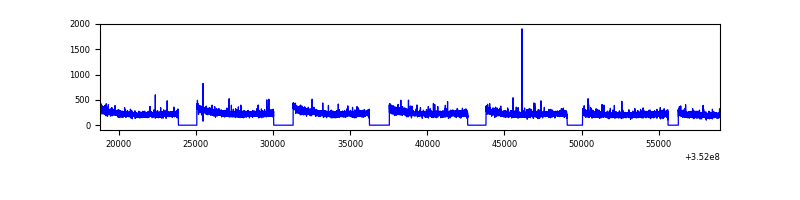 |
| B | 18727 | 12634 | 0 | 0 | 0.00% | 0.00% | 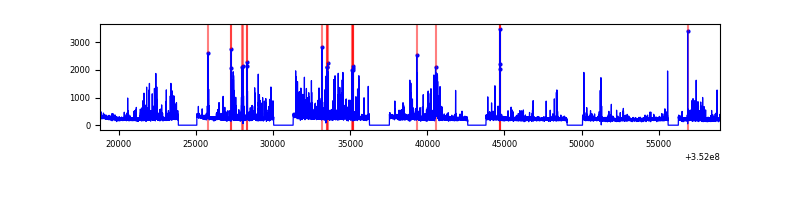 |
| C | 18743 | 12623 | 0 | 0 | 0.00% | 0.00% |  |
| D | 14184 | 12567 | 0 | 0 | 0.00% | 0.00% |  |
Top three noisy pixels from each quadrant. If the there are fewer than three noisy pixels in the level2.evt file, extra rows are filled as -1
| Pixel properties | Quadrant properties | ||||||
|---|---|---|---|---|---|---|---|
| Quadrant | DetID | PixID | Counts | Sigma | Mean | Median | Sigma |
| A | 0 | 29 | 839 | 10.47 | 235 | 223 | 58.8 |
| A | 9 | 19 | 677 | 7.72 | 235 | 223 | 58.8 |
| A | 0 | 30 | 660 | 7.43 | 235 | 223 | 58.8 |
| B | 2 | 9 | 642 | 9.66 | 220 | 212 | 44.5 |
| B | 3 | 17 | 579 | 8.24 | 220 | 212 | 44.5 |
| B | 5 | 128 | 574 | 8.13 | 220 | 212 | 44.5 |
| C | 1 | 80 | 640 | 7.73 | 218 | 207 | 56.1 |
| C | 1 | 81 | 639 | 7.71 | 218 | 207 | 56.1 |
| C | 3 | 202 | 638 | 7.69 | 218 | 207 | 56.1 |
| D | 15 | 46 | 549 | 6.51 | 205 | 189 | 55.3 |
| D | 6 | 67 | 547 | 6.48 | 205 | 189 | 55.3 |
| D | 3 | 14 | 525 | 6.08 | 205 | 189 | 55.3 |
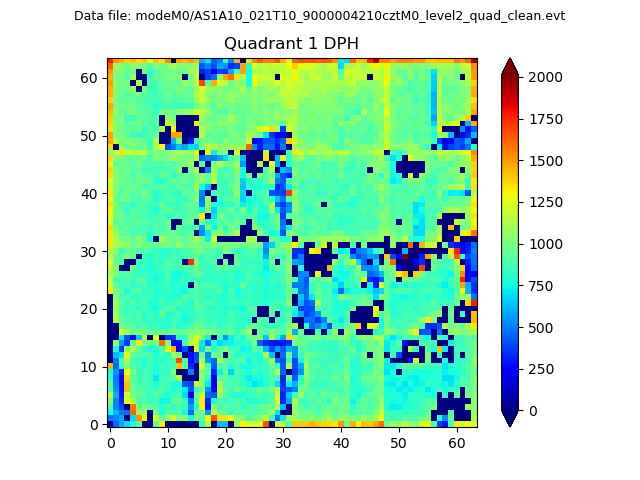
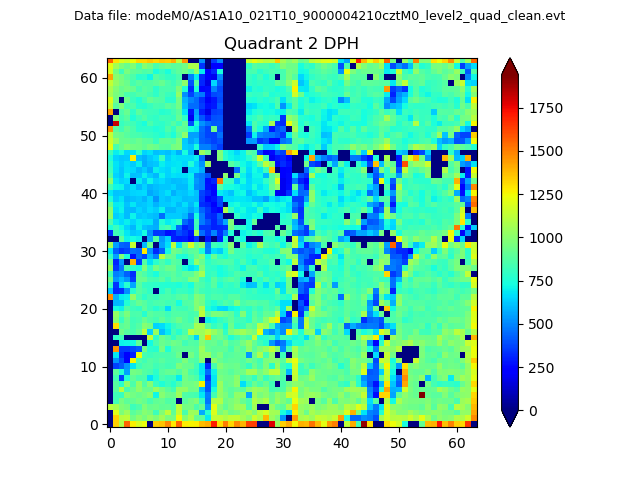
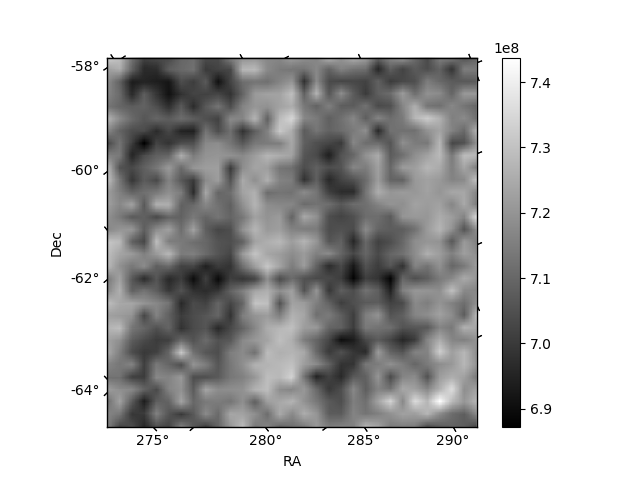
Histogram calculated using DETX and DETY for each event in the final _common_clean file
| Quadrant A |  |
 |
Quadrant B |
|---|---|---|---|
| Quadrant D |  |
 |
Quadrant C |
| Plot type | Count rate plots | Images |
|---|---|---|
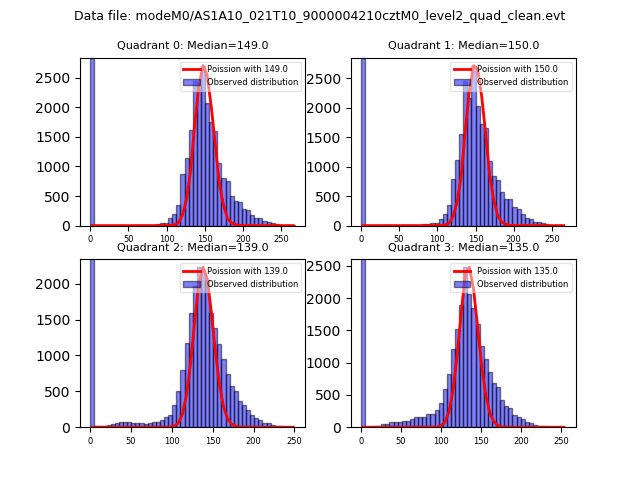
| Comparison with Poisson distribution Blue bars denote a histogram of data divided into 1 sec bins. Red curve is a Poisson curve with rate = median count rate of data. |
 |
 |
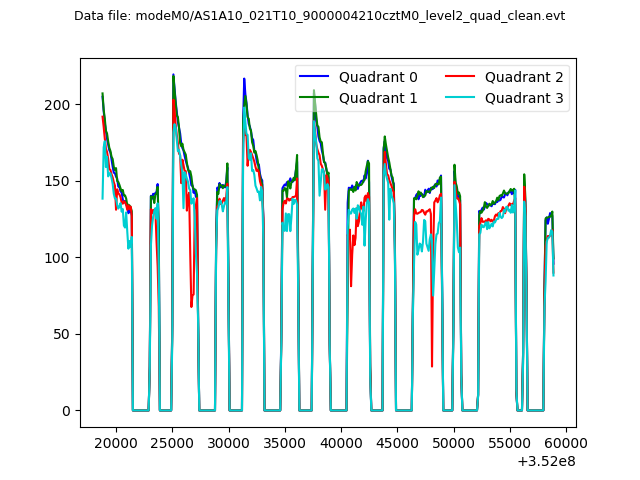
| Quadrant-wise count rates Data is divided into 100 sec bins |
 |
|
| Module-wise count rates for Quadrant A Data is divided into 100 sec bins |
 |
 |
| Module-wise count rates for Quadrant B Data is divided into 100 sec bins |
 |
 |
| Module-wise count rates for Quadrant C Data is divided into 100 sec bins |
 |
 |
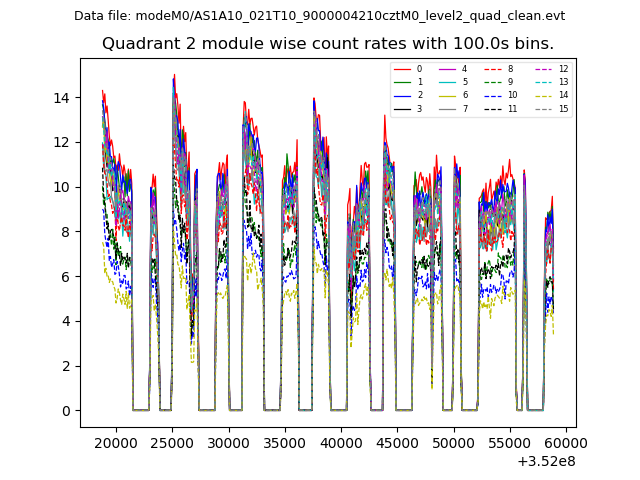
| Module-wise count rates for Quadrant D Data is divided into 100 sec bins |
 |
 |
| Parameter | Plot |
|---|---|
| CZT HV Monitor |  |
| D_VDD | 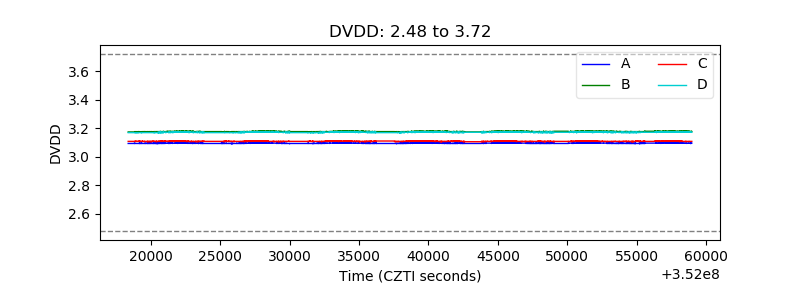 |
| Temperature 1 |  |
| Veto HV Monitor |  |
| Veto LLD |  |
| Alpha Counter |  |
| _CPM_Rate |  |
| CZT Counter |  |
| +2.5 Volts monitor |  |
| +5 Volts monitor | 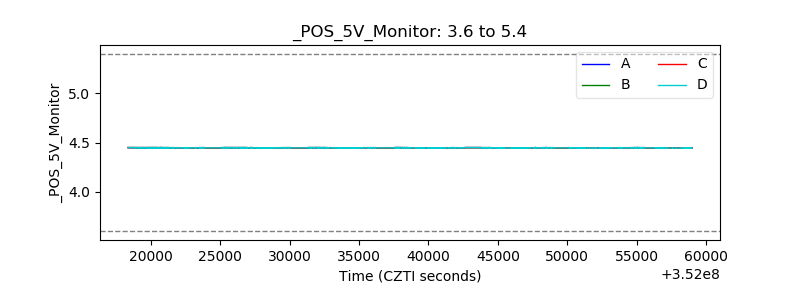 |
| _ROLL_ROT |  |
| _Roll_DEC | 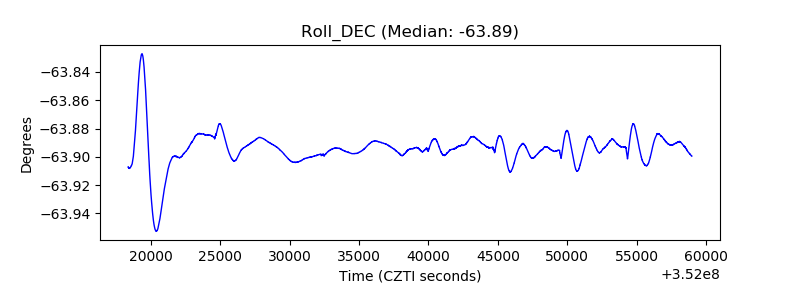 |
| _Roll_RA |  |
| Veto Counter |  |