| Param | Original file | Final file |
|---|---|---|
| Filename | modeM0/AS1A10_021T10_9000004210_29283cztM0_level2.evt | modeM0/AS1A10_021T10_9000004210_29283cztM0_level2_quad_clean.evt |
| Size (bytes) | 574,833,600 | 99,826,560 |
| Size | 548.2 MB | 95.2 MB |
| Events in quadrant A | 3,084,322 | 684,083 |
| Events in quadrant B | 3,872,509 | 684,783 |
| Events in quadrant C | 3,579,539 | 637,831 |
| Events in quadrant D | 6,475,774 | 606,473 |
| Mode SS | |||
|---|---|---|---|
| Quadrant | BADHDUFLAG | Total packets | Discarded packets |
| A | 0 | 120 | 0 |
| B | 0 | 120 | 0 |
| C | 0 | 120 | 0 |
| D | 0 | 120 | 0 |
| Mode M9 | |||
|---|---|---|---|
| Quadrant | BADHDUFLAG | Total packets | Discarded packets |
| A | 0 | 13 | 0 |
| B | 0 | 13 | 0 |
| C | 0 | 13 | 0 |
| D | 0 | 13 | 0 |
| Mode M0 | |||
|---|---|---|---|
| Quadrant | BADHDUFLAG | Total packets | Discarded packets |
| A | 0 | 12568 | 1 |
| B | 0 | 15208 | 1 |
| C | 0 | 14650 | 1 |
| D | 0 | 23504 | 1 |
| Quadrant | Total seconds | Saturated seconds | Saturation percentage |
|---|---|---|---|
| A | 5860 | 52 | 0.887372% |
| B | 5861 | 144 | 2.456919% |
| C | 5861 | 205 | 3.497697% |
| D | 5861 | 792 | 13.513052% |
Noise dominated data is calculated using 1-second bins in cleaned event files. If a bin has >2000 counts, and if more than 50% of those come from <1% of pixels, then it is considered to be noise-dominated and hence unusable.
| Quadrant | # 1 sec bins | Bins with >0 counts | Bins with >2000 counts | High rate bins dominated by noise | Noise dominated (total time) | Noise dominated (detector-on time) | Marked lightcurve |
|---|---|---|---|---|---|---|---|
| A | 7155 | 5861 | 0 | 0 | 0.00% | 0.00% | 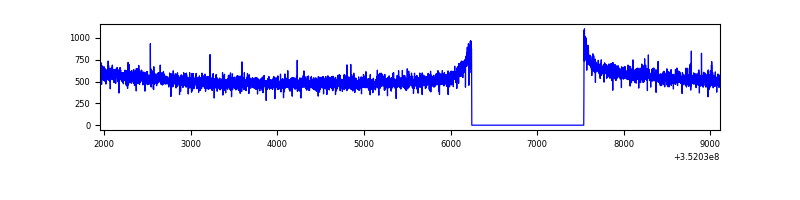 |
| B | 7156 | 5862 | 53 | 53 | 0.74% | 0.90% | 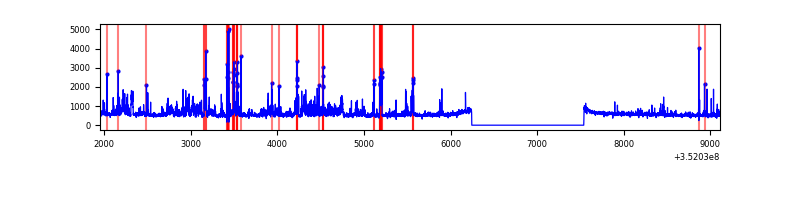 |
| C | 7156 | 5862 | 0 | 0 | 0.00% | 0.00% | 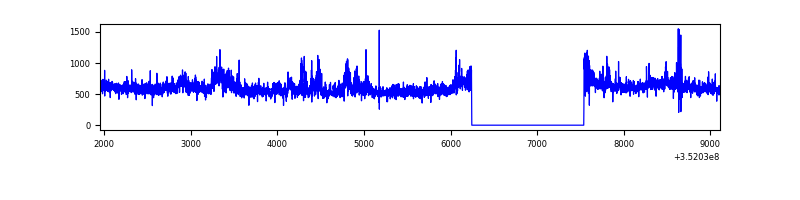 |
| D | 7156 | 5862 | 661 | 661 | 9.24% | 11.28% | 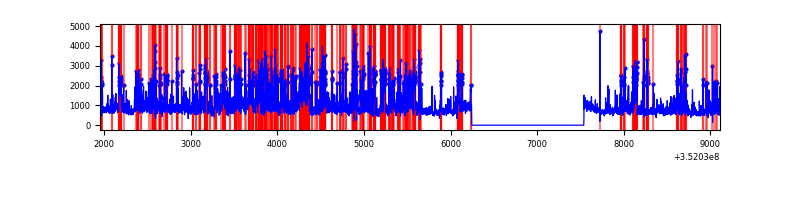 |
Top three noisy pixels from each quadrant. If the there are fewer than three noisy pixels in the level2.evt file, extra rows are filled as -1
| Pixel properties | Quadrant properties | ||||||
|---|---|---|---|---|---|---|---|
| Quadrant | DetID | PixID | Counts | Sigma | Mean | Median | Sigma |
| A | 13 | 254 | 12077 | 71.8 | 799 | 786 | 157.3 |
| A | 0 | 226 | 6963 | 39.28 | 799 | 786 | 157.3 |
| A | 3 | 137 | 6770 | 38.05 | 799 | 786 | 157.3 |
| B | 0 | 229 | 342641 | 2426.07 | 772 | 757 | 140.9 |
| B | 0 | 183 | 261348 | 1849.2 | 772 | 757 | 140.9 |
| B | 10 | 246 | 126776 | 894.25 | 772 | 757 | 140.9 |
| C | 3 | 233 | 439210 | 2593.89 | 741 | 746 | 169.0 |
| C | 14 | 238 | 168379 | 991.69 | 741 | 746 | 169.0 |
| C | 14 | 254 | 70688 | 413.77 | 741 | 746 | 169.0 |
| D | 1 | 52 | 1575641 | 9075.82 | 740 | 722 | 173.5 |
| D | 8 | 195 | 1529932 | 8812.41 | 740 | 722 | 173.5 |
| D | 12 | 233 | 215840 | 1239.67 | 740 | 722 | 173.5 |
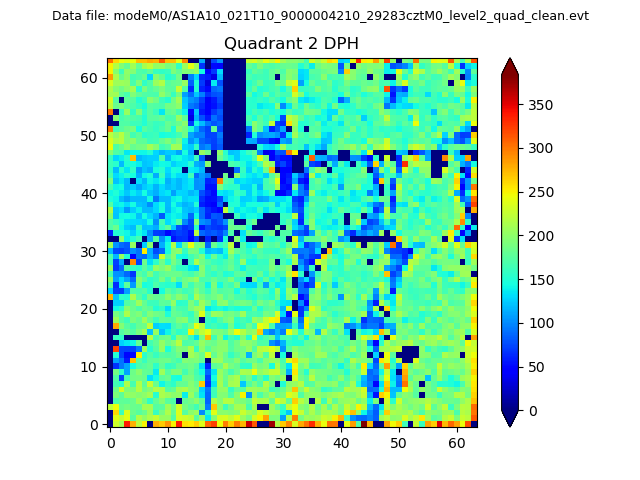
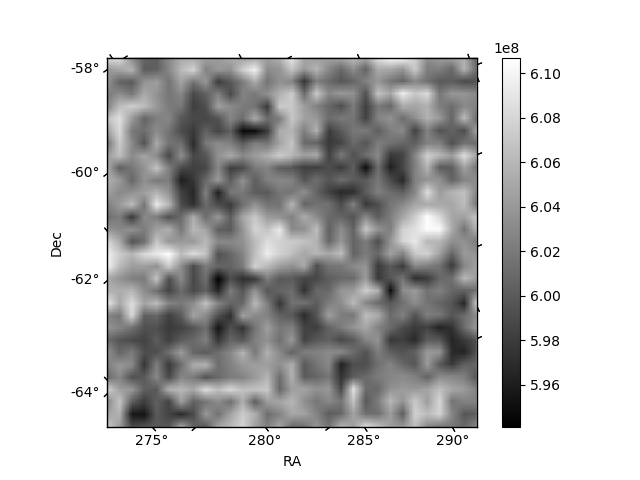
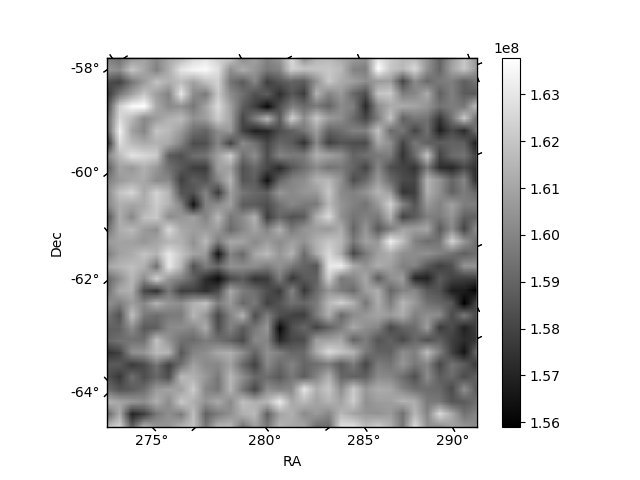
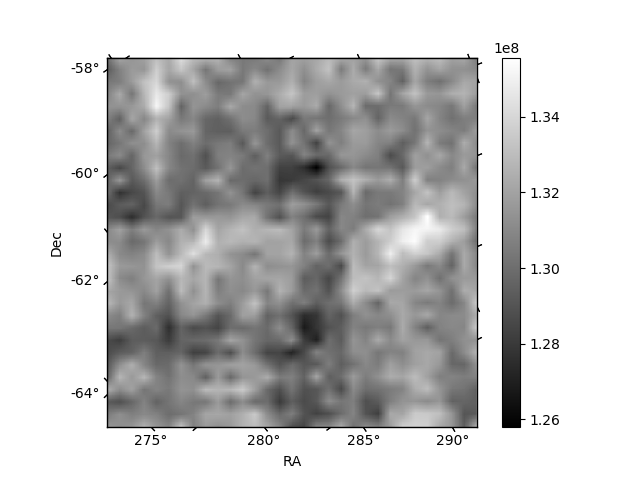
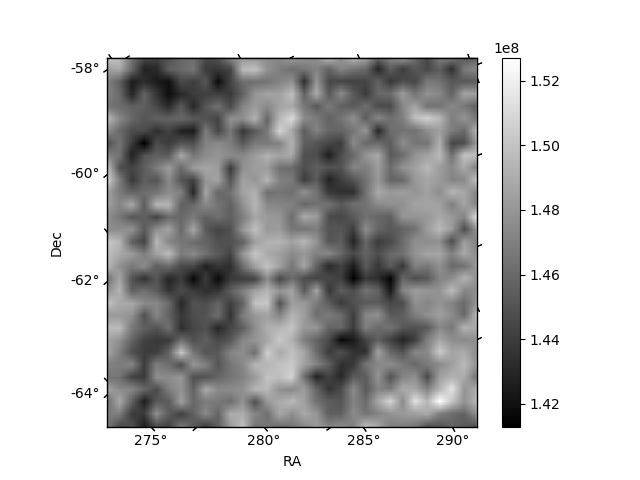
Histogram calculated using DETX and DETY for each event in the final _common_clean file
| Quadrant A | 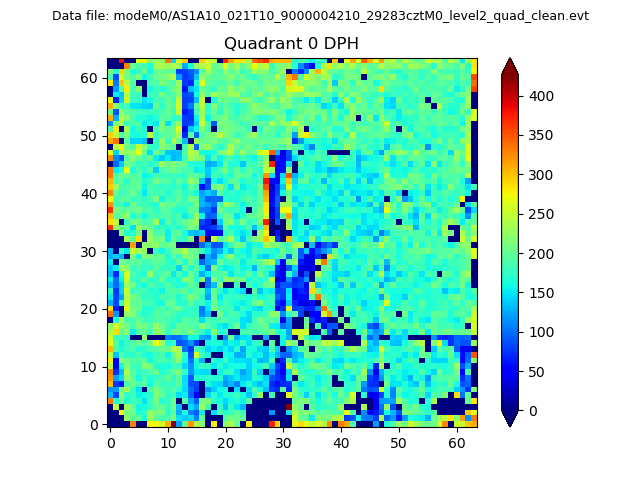 |
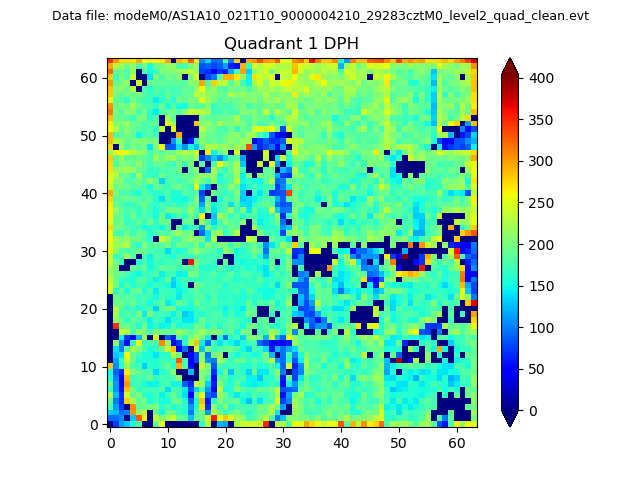 |
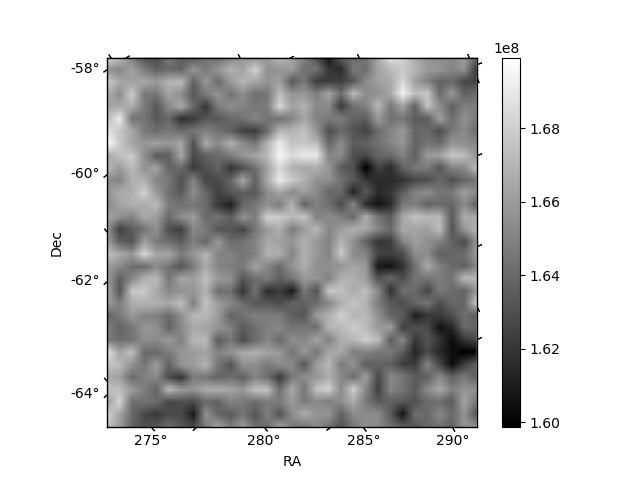
Quadrant B |
|---|---|---|---|
| Quadrant D | 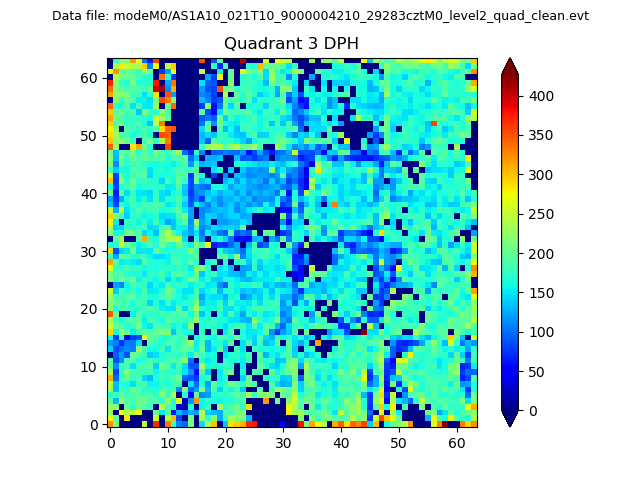 |
 |
Quadrant C |
| Plot type | Count rate plots | Images |
|---|---|---|
| Comparison with Poisson distribution Blue bars denote a histogram of data divided into 1 sec bins. Red curve is a Poisson curve with rate = median count rate of data. |
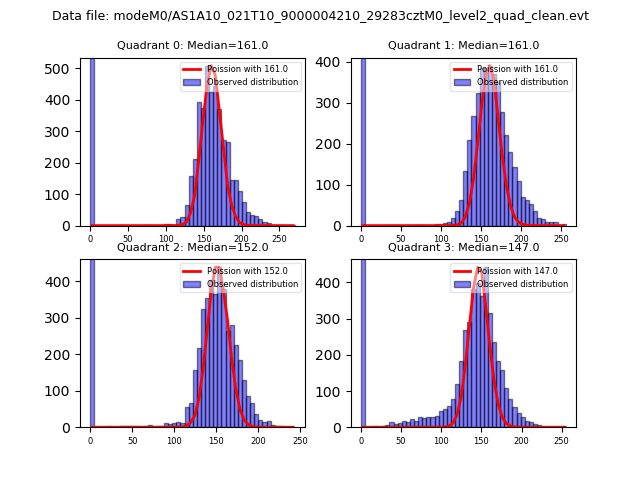 |
 |
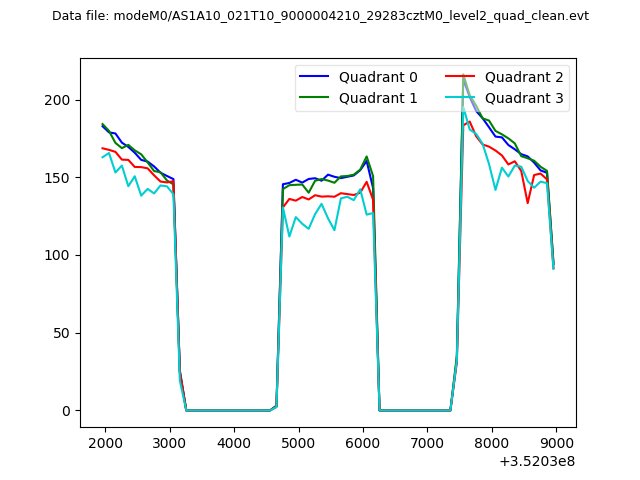
| Quadrant-wise count rates Data is divided into 100 sec bins |
 |
|
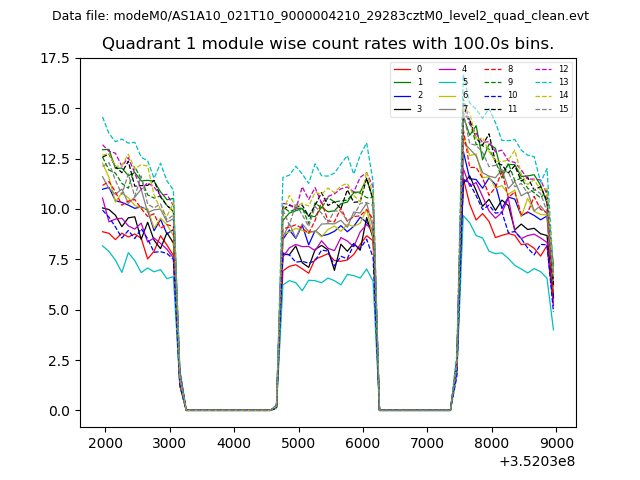
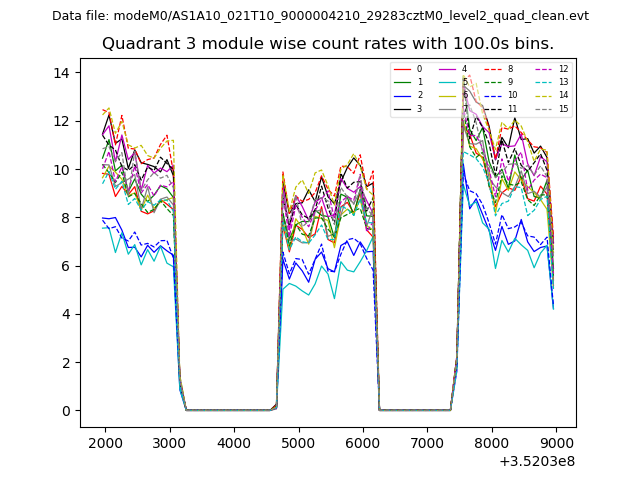
| Module-wise count rates for Quadrant A Data is divided into 100 sec bins |
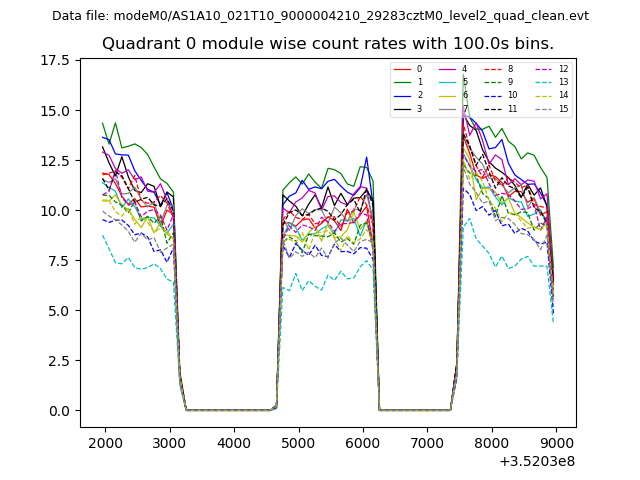 |
 |
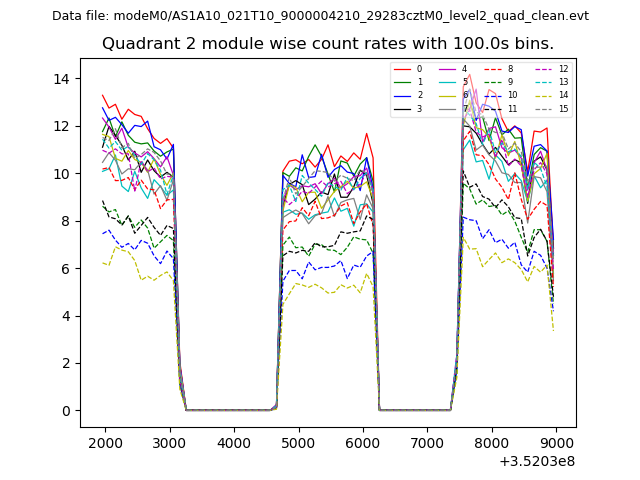
| Module-wise count rates for Quadrant B Data is divided into 100 sec bins |
 |
 |
| Module-wise count rates for Quadrant C Data is divided into 100 sec bins |
 |
 |
| Module-wise count rates for Quadrant D Data is divided into 100 sec bins |
 |
 |
| Parameter | Plot |
|---|---|
| CZT HV Monitor | 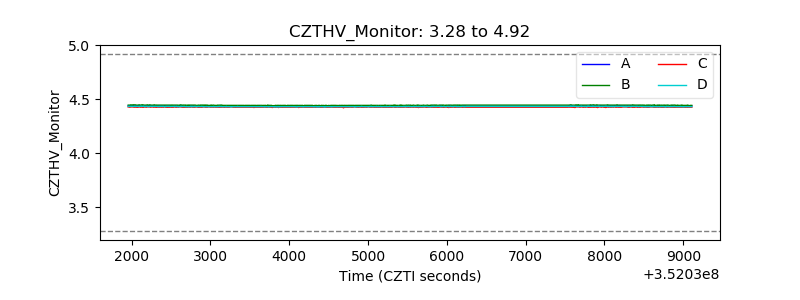 |
| D_VDD | 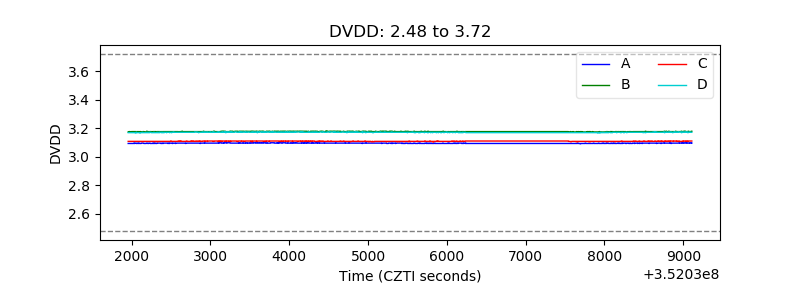 |
| Temperature 1 | 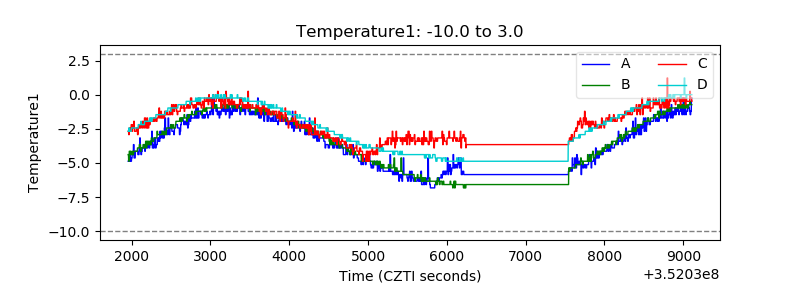 |
| Veto HV Monitor | 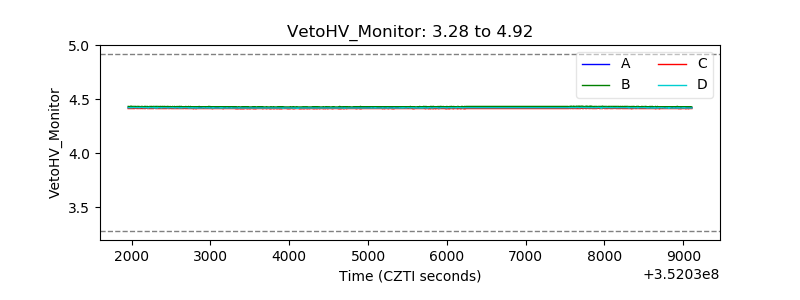 |
| Veto LLD | 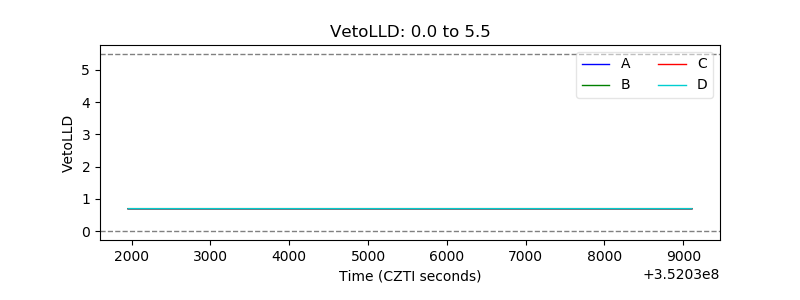 |
| Alpha Counter | 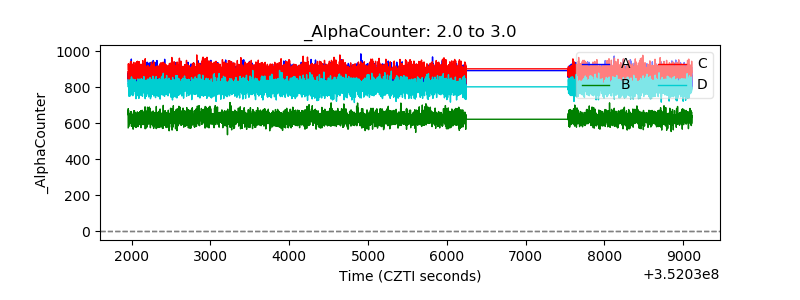 |
| _CPM_Rate | 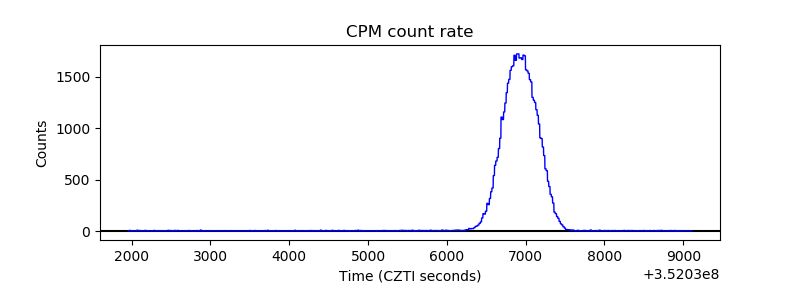 |
| CZT Counter | 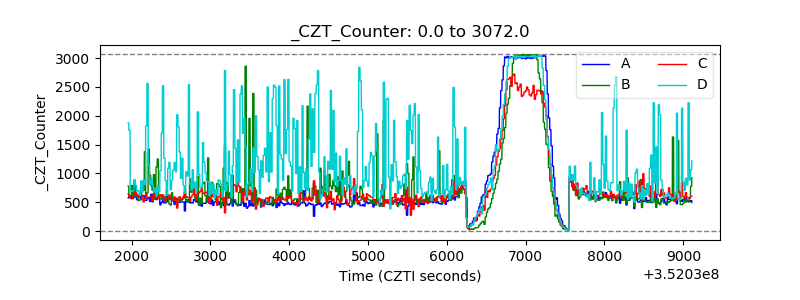 |
| +2.5 Volts monitor | 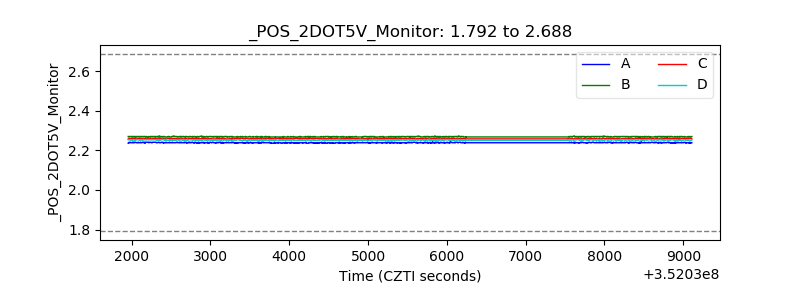 |
| +5 Volts monitor |  |
| _ROLL_ROT | 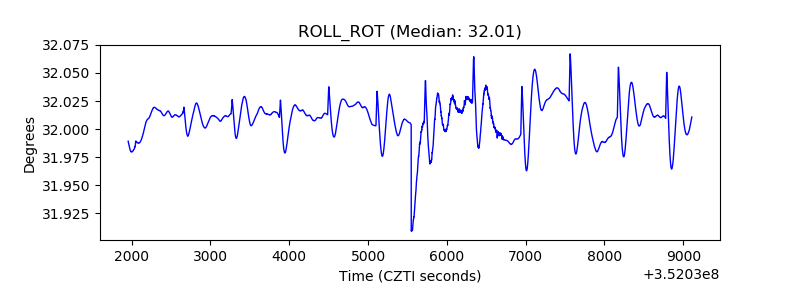 |
| _Roll_DEC | 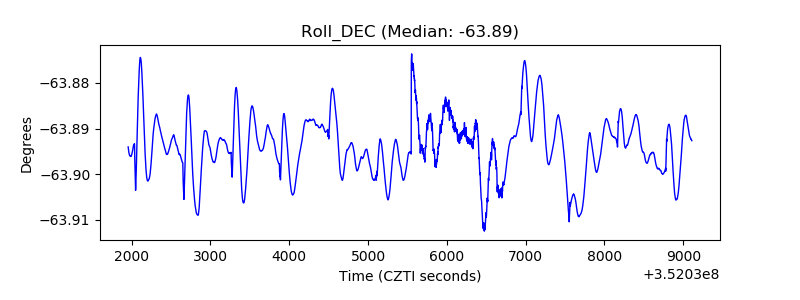 |
| _Roll_RA | 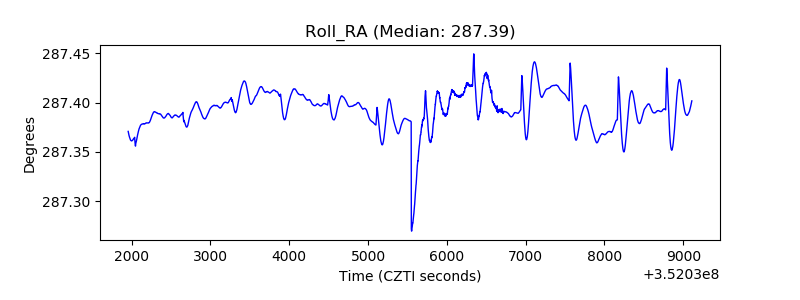 |
| Veto Counter | 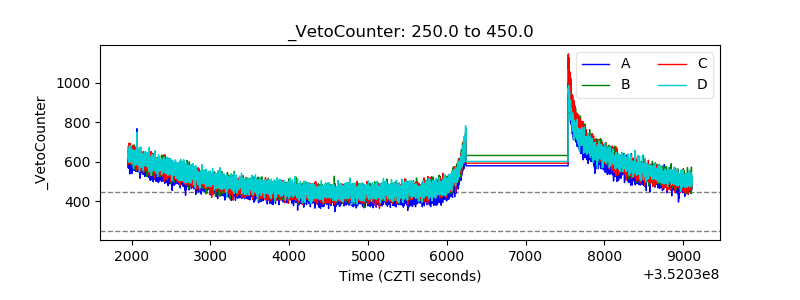 |