| Param | Original file | Final file |
|---|---|---|
| Filename | modeM0/AS1A10_021T10_9000004210_29284cztM0_level2.evt | modeM0/AS1A10_021T10_9000004210_29284cztM0_level2_quad_clean.evt |
| Size (bytes) | 616,245,120 | 92,306,880 |
| Size | 587.7 MB | 88.0 MB |
| Events in quadrant A | 3,160,990 | 626,547 |
| Events in quadrant B | 3,657,099 | 626,550 |
| Events in quadrant C | 4,898,601 | 556,930 |
| Events in quadrant D | 6,529,079 | 554,367 |
| Mode SS | |||
|---|---|---|---|
| Quadrant | BADHDUFLAG | Total packets | Discarded packets |
| A | 0 | 124 | 0 |
| B | 0 | 124 | 0 |
| C | 0 | 126 | 0 |
| D | 0 | 126 | 0 |
| Mode M9 | |||
|---|---|---|---|
| Quadrant | BADHDUFLAG | Total packets | Discarded packets |
| A | 0 | 12 | 0 |
| B | 0 | 12 | 0 |
| C | 0 | 12 | 0 |
| D | 0 | 12 | 0 |
| Mode M0 | |||
|---|---|---|---|
| Quadrant | BADHDUFLAG | Total packets | Discarded packets |
| A | 0 | 12955 | 1 |
| B | 0 | 14474 | 1 |
| C | 0 | 19162 | 1 |
| D | 0 | 23839 | 1 |
| Quadrant | Total seconds | Saturated seconds | Saturation percentage |
|---|---|---|---|
| A | 6167 | 108 | 1.751257% |
| B | 6167 | 271 | 4.394357% |
| C | 6167 | 803 | 13.020918% |
| D | 6167 | 804 | 13.037133% |
Noise dominated data is calculated using 1-second bins in cleaned event files. If a bin has >2000 counts, and if more than 50% of those come from <1% of pixels, then it is considered to be noise-dominated and hence unusable.
| Quadrant | # 1 sec bins | Bins with >0 counts | Bins with >2000 counts | High rate bins dominated by noise | Noise dominated (total time) | Noise dominated (detector-on time) | Marked lightcurve |
|---|---|---|---|---|---|---|---|
| A | 7352 | 6168 | 0 | 0 | 0.00% | 0.00% | 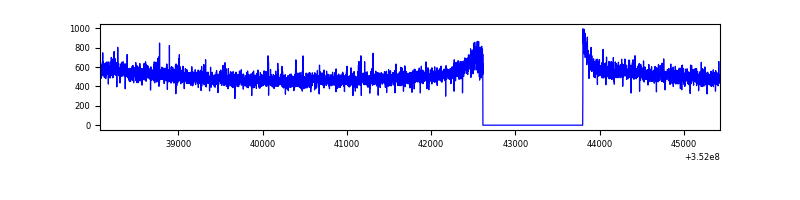 |
| B | 7352 | 6168 | 121 | 121 | 1.65% | 1.96% | 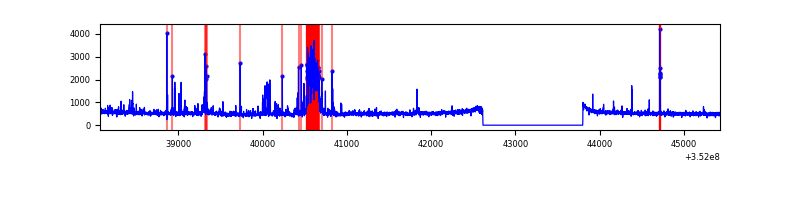 |
| C | 7351 | 6167 | 0 | 0 | 0.00% | 0.00% | 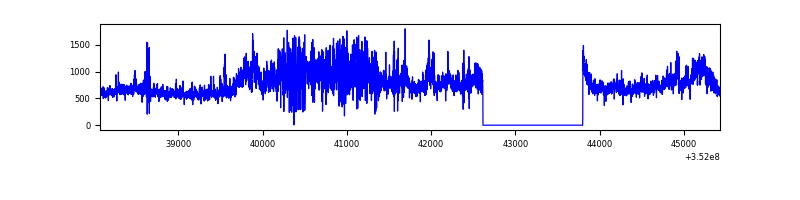 |
| D | 7352 | 6168 | 519 | 519 | 7.06% | 8.41% | 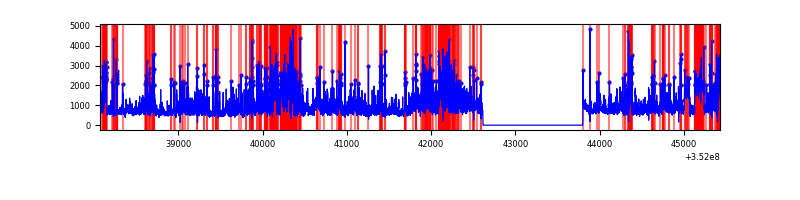 |
Top three noisy pixels from each quadrant. If the there are fewer than three noisy pixels in the level2.evt file, extra rows are filled as -1
| Pixel properties | Quadrant properties | ||||||
|---|---|---|---|---|---|---|---|
| Quadrant | DetID | PixID | Counts | Sigma | Mean | Median | Sigma |
| A | 13 | 254 | 12385 | 71.25 | 819 | 804 | 162.5 |
| A | 3 | 137 | 7447 | 40.87 | 819 | 804 | 162.5 |
| A | 0 | 226 | 7101 | 38.74 | 819 | 804 | 162.5 |
| B | 0 | 229 | 452676 | 3097.36 | 791 | 773 | 145.9 |
| B | 10 | 245 | 62813 | 425.22 | 791 | 773 | 145.9 |
| B | 12 | 111 | 16697 | 109.14 | 791 | 773 | 145.9 |
| C | 3 | 233 | 1509997 | 9017.98 | 732 | 738 | 167.4 |
| C | 14 | 238 | 280744 | 1673.07 | 732 | 738 | 167.4 |
| C | 14 | 254 | 236314 | 1407.59 | 732 | 738 | 167.4 |
| D | 1 | 52 | 1771368 | 9876.11 | 757 | 740 | 179.3 |
| D | 8 | 195 | 777249 | 4331.17 | 757 | 740 | 179.3 |
| D | 12 | 233 | 299425 | 1665.99 | 757 | 740 | 179.3 |
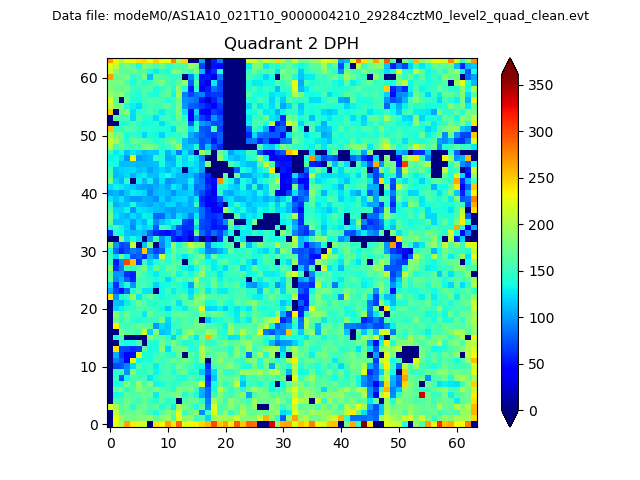
Histogram calculated using DETX and DETY for each event in the final _common_clean file
| Quadrant A | 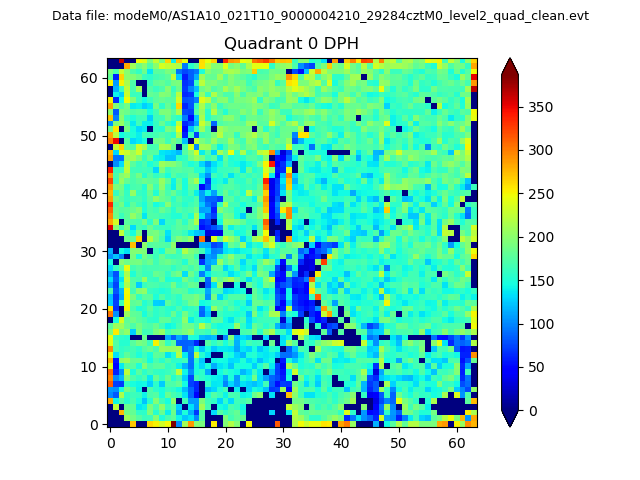 |
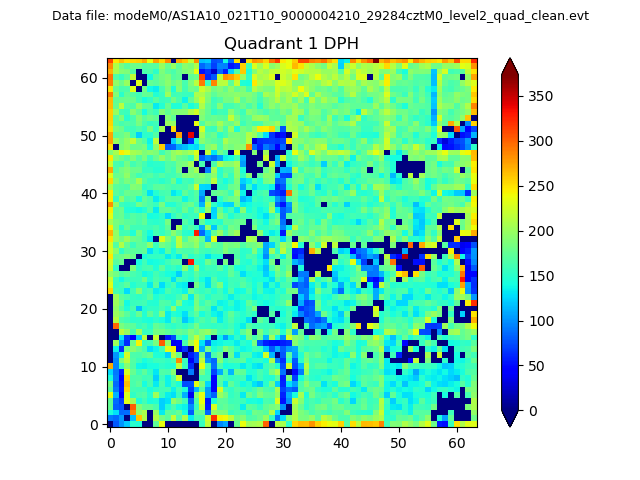 |
Quadrant B |
|---|---|---|---|
| Quadrant D | 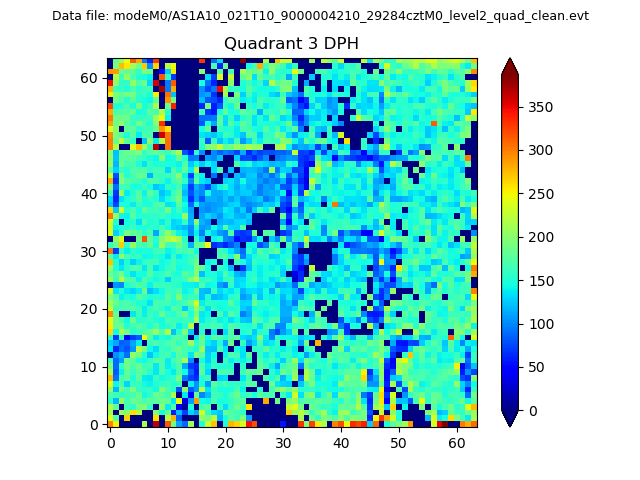 |
 |
Quadrant C |
| Plot type | Count rate plots | Images |
|---|---|---|
| Comparison with Poisson distribution Blue bars denote a histogram of data divided into 1 sec bins. Red curve is a Poisson curve with rate = median count rate of data. |
 |
 |
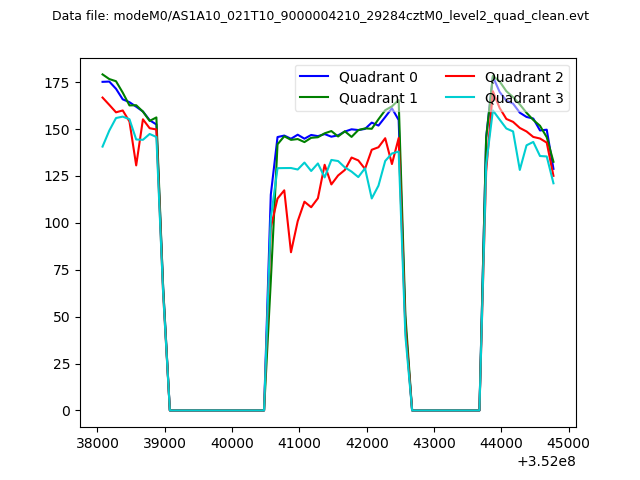
| Quadrant-wise count rates Data is divided into 100 sec bins |
 |
|
| Module-wise count rates for Quadrant A Data is divided into 100 sec bins |
 |
 |
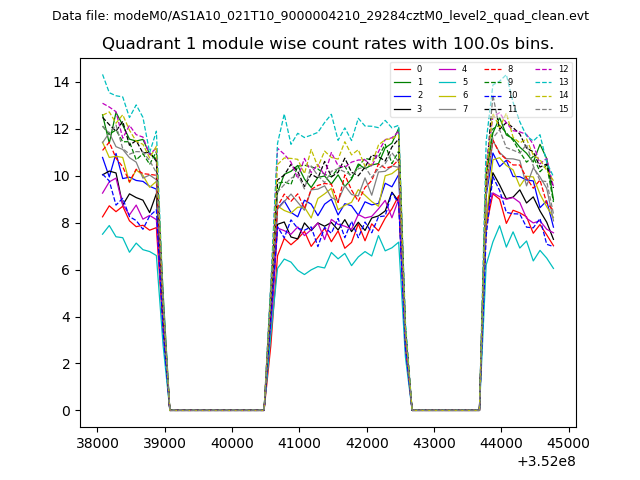
| Module-wise count rates for Quadrant B Data is divided into 100 sec bins |
 |
 |
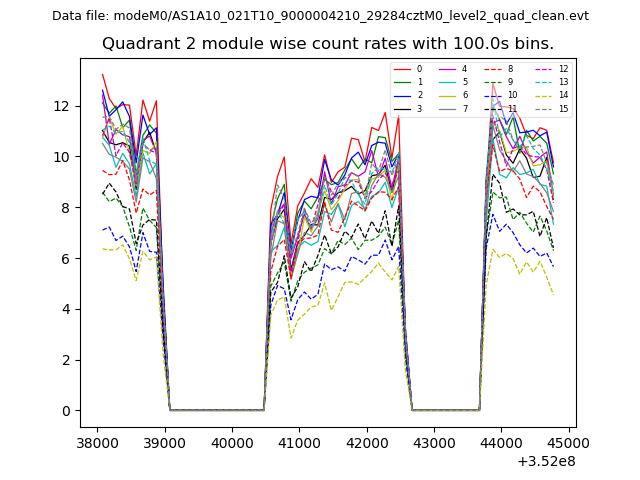
| Module-wise count rates for Quadrant C Data is divided into 100 sec bins |
 |
 |
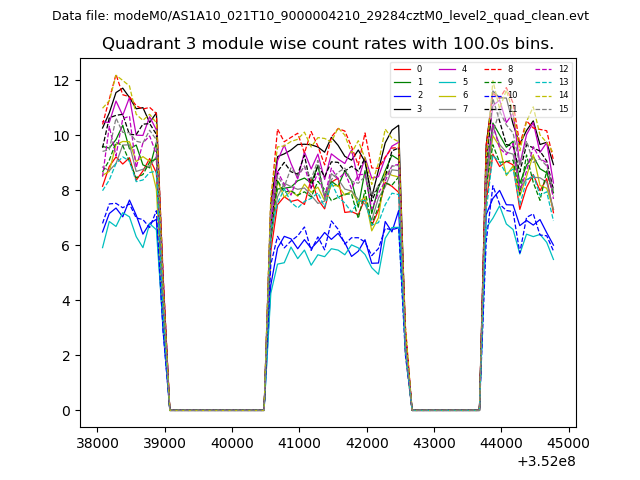
| Module-wise count rates for Quadrant D Data is divided into 100 sec bins |
 |
 |
| Parameter | Plot |
|---|---|
| CZT HV Monitor | 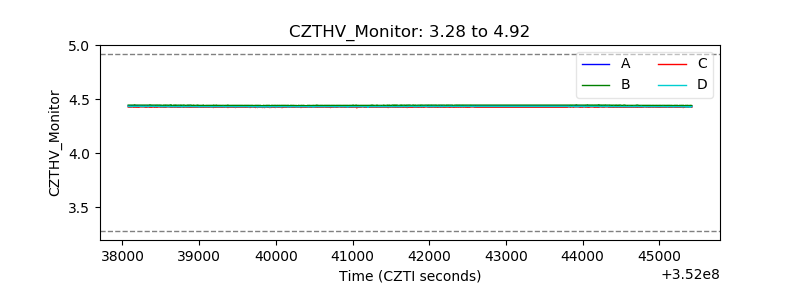 |
| D_VDD | 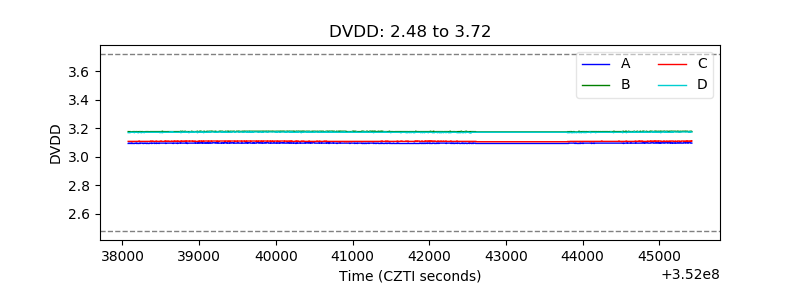 |
| Temperature 1 | 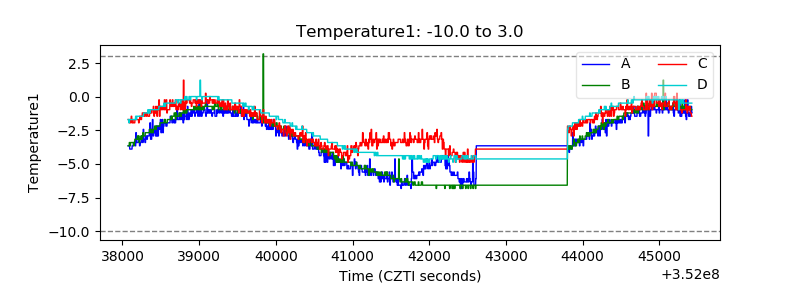 |
| Veto HV Monitor | 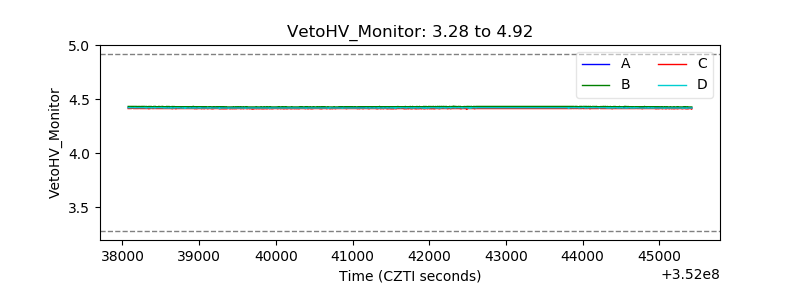 |
| Veto LLD | 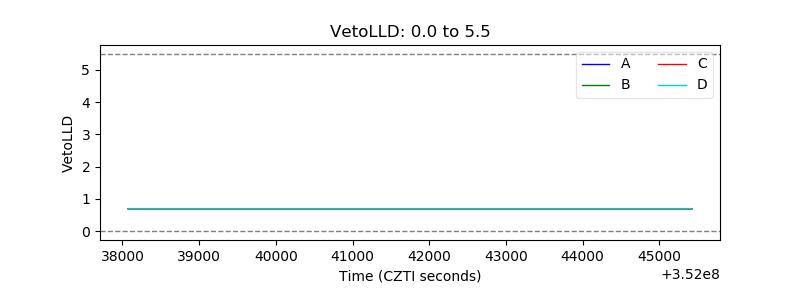 |
| Alpha Counter | 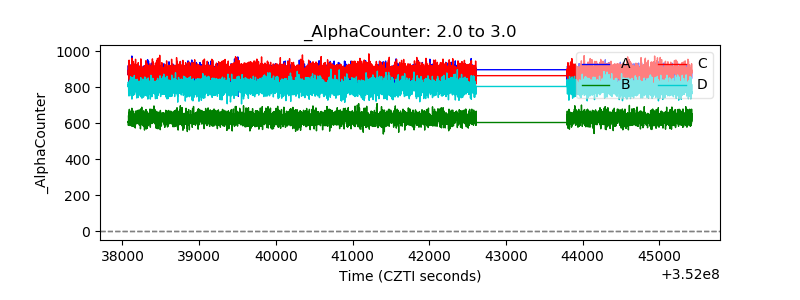 |
| _CPM_Rate | 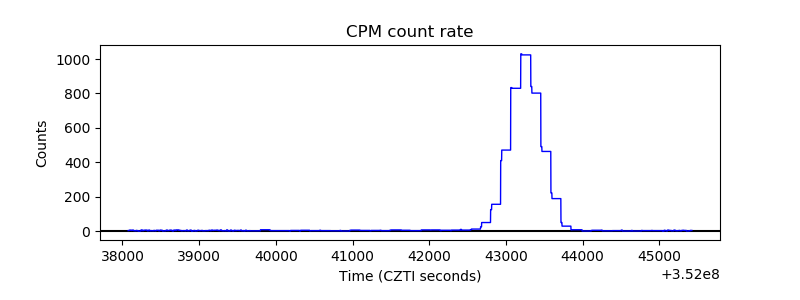 |
| CZT Counter | 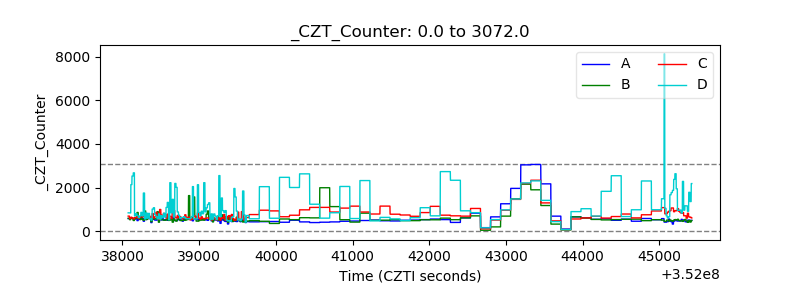 |
| +2.5 Volts monitor | 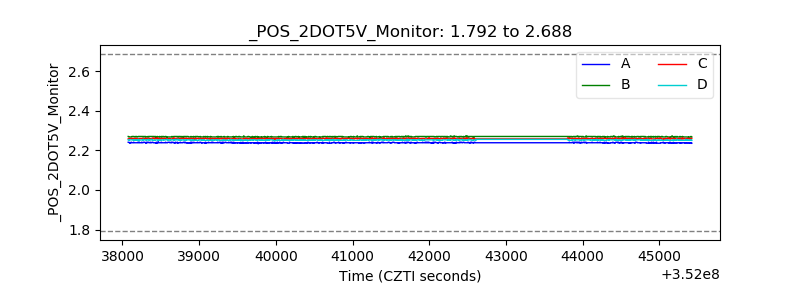 |
| +5 Volts monitor |  |
| _ROLL_ROT | 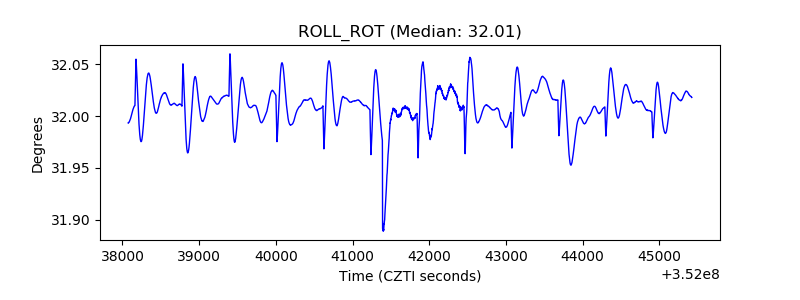 |
| _Roll_DEC | 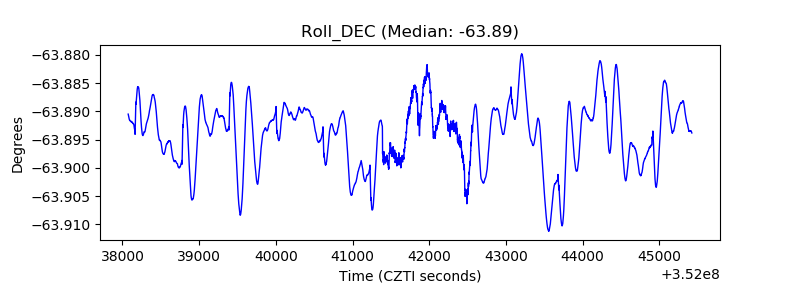 |
| _Roll_RA | 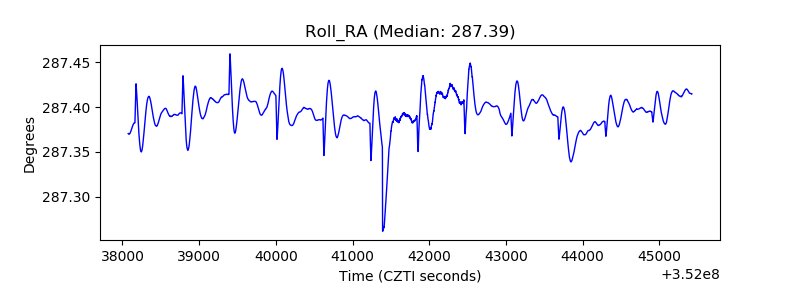 |
| Veto Counter | 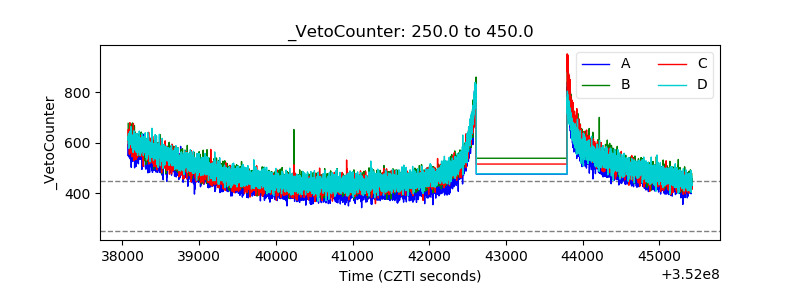 |