| Param | Original file | Final file |
|---|---|---|
| Filename | modeM0/AS1A10_021T10_9000004210_29286cztM0_level2.evt | modeM0/AS1A10_021T10_9000004210_29286cztM0_level2_quad_clean.evt |
| Size (bytes) | 608,679,360 | 87,880,320 |
| Size | 580.5 MB | 83.8 MB |
| Events in quadrant A | 3,277,976 | 564,998 |
| Events in quadrant B | 3,421,650 | 569,820 |
| Events in quadrant C | 4,356,210 | 534,959 |
| Events in quadrant D | 6,911,115 | 510,513 |
| Mode SS | |||
|---|---|---|---|
| Quadrant | BADHDUFLAG | Total packets | Discarded packets |
| A | 0 | 140 | 0 |
| B | 0 | 140 | 0 |
| C | 0 | 140 | 0 |
| D | 0 | 140 | 0 |
| Mode M9 | |||
|---|---|---|---|
| Quadrant | BADHDUFLAG | Total packets | Discarded packets |
| A | 0 | 6 | 0 |
| B | 0 | 6 | 0 |
| C | 0 | 6 | 0 |
| D | 0 | 6 | 0 |
| Mode M0 | |||
|---|---|---|---|
| Quadrant | BADHDUFLAG | Total packets | Discarded packets |
| A | 0 | 14111 | 1 |
| B | 0 | 14442 | 1 |
| C | 0 | 17480 | 1 |
| D | 0 | 25333 | 1 |
| Quadrant | Total seconds | Saturated seconds | Saturation percentage |
|---|---|---|---|
| A | 6900 | 65 | 0.942029% |
| B | 6901 | 86 | 1.246196% |
| C | 6901 | 151 | 2.188089% |
| D | 6901 | 625 | 9.056658% |
Noise dominated data is calculated using 1-second bins in cleaned event files. If a bin has >2000 counts, and if more than 50% of those come from <1% of pixels, then it is considered to be noise-dominated and hence unusable.
| Quadrant | # 1 sec bins | Bins with >0 counts | Bins with >2000 counts | High rate bins dominated by noise | Noise dominated (total time) | Noise dominated (detector-on time) | Marked lightcurve |
|---|---|---|---|---|---|---|---|
| A | 7565 | 6901 | 0 | 0 | 0.00% | 0.00% | 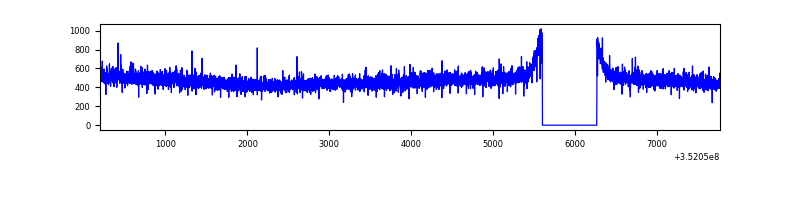 |
| B | 7566 | 6902 | 10 | 10 | 0.13% | 0.14% | 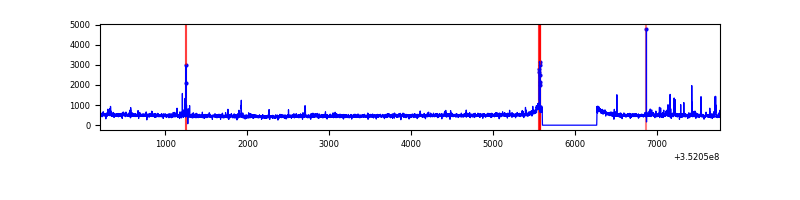 |
| C | 7566 | 6902 | 0 | 0 | 0.00% | 0.00% | 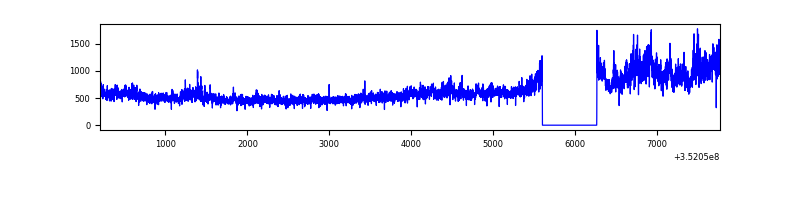 |
| D | 7566 | 6902 | 498 | 498 | 6.58% | 7.22% | 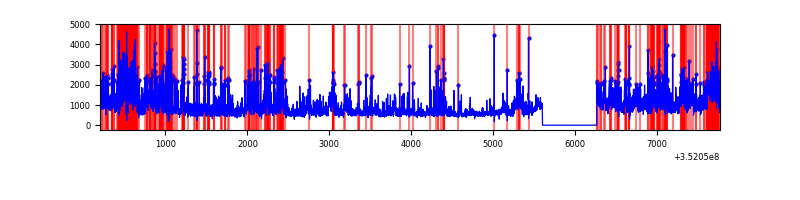 |
Top three noisy pixels from each quadrant. If the there are fewer than three noisy pixels in the level2.evt file, extra rows are filled as -1
| Pixel properties | Quadrant properties | ||||||
|---|---|---|---|---|---|---|---|
| Quadrant | DetID | PixID | Counts | Sigma | Mean | Median | Sigma |
| A | 13 | 254 | 13989 | 77.25 | 848 | 829 | 170.4 |
| A | 3 | 137 | 7957 | 41.84 | 848 | 829 | 170.4 |
| A | 0 | 226 | 7426 | 38.73 | 848 | 829 | 170.4 |
| B | 10 | 247 | 32613 | 203.59 | 837 | 817 | 156.2 |
| B | 0 | 229 | 26854 | 166.71 | 837 | 817 | 156.2 |
| B | 10 | 245 | 23800 | 147.16 | 837 | 817 | 156.2 |
| C | 3 | 233 | 1084969 | 5871.88 | 800 | 804 | 184.6 |
| C | 14 | 238 | 131535 | 708.04 | 800 | 804 | 184.6 |
| C | 2 | 114 | 16731 | 86.26 | 800 | 804 | 184.6 |
| D | 1 | 52 | 1600723 | 8462.22 | 798 | 776 | 189.1 |
| D | 8 | 195 | 1224358 | 6471.6 | 798 | 776 | 189.1 |
| D | 12 | 79 | 257417 | 1357.39 | 798 | 776 | 189.1 |
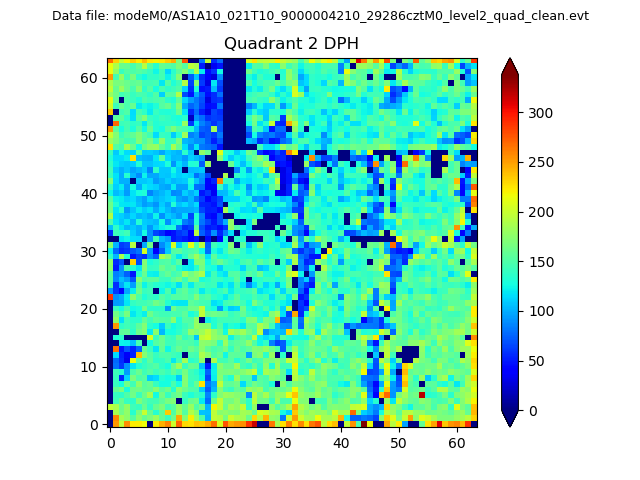
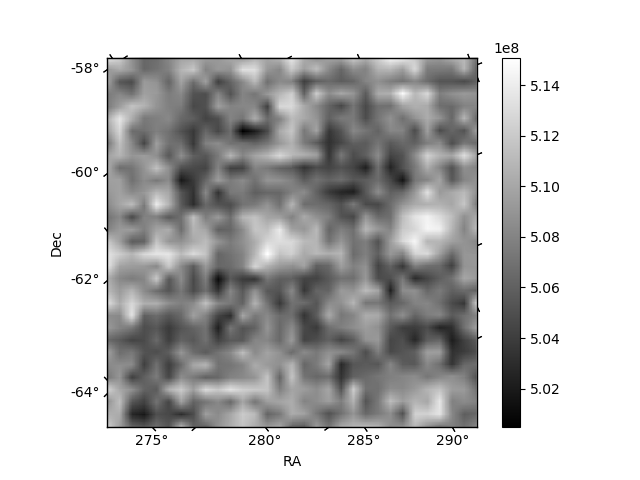
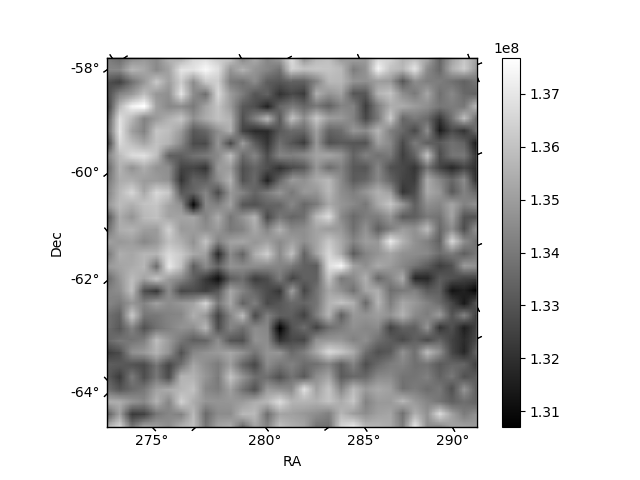
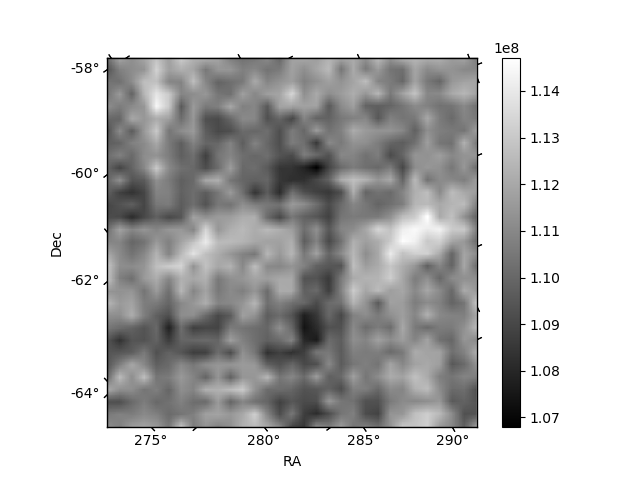
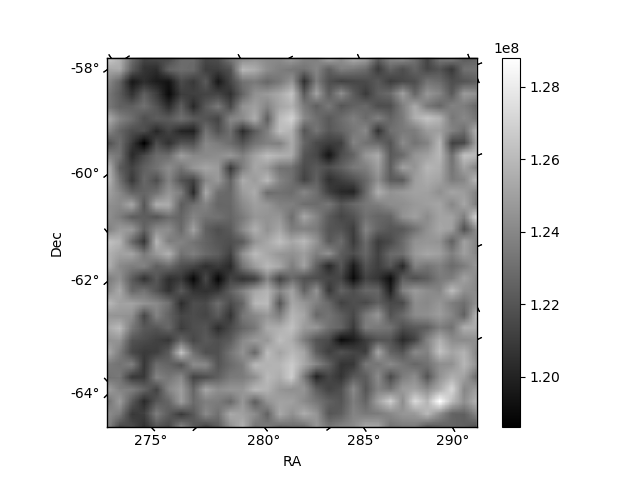
Histogram calculated using DETX and DETY for each event in the final _common_clean file
| Quadrant A | 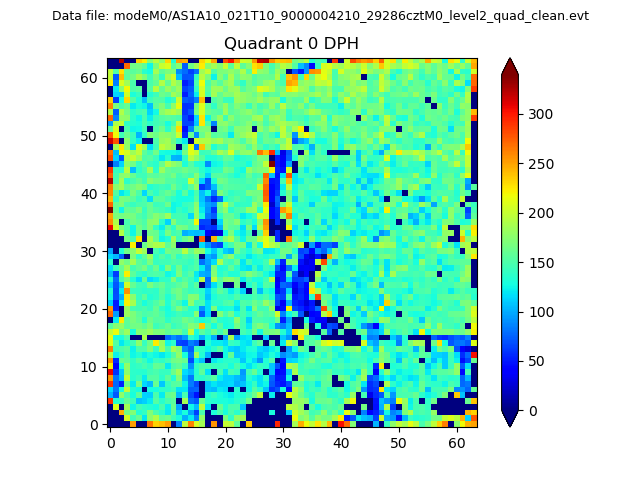 |
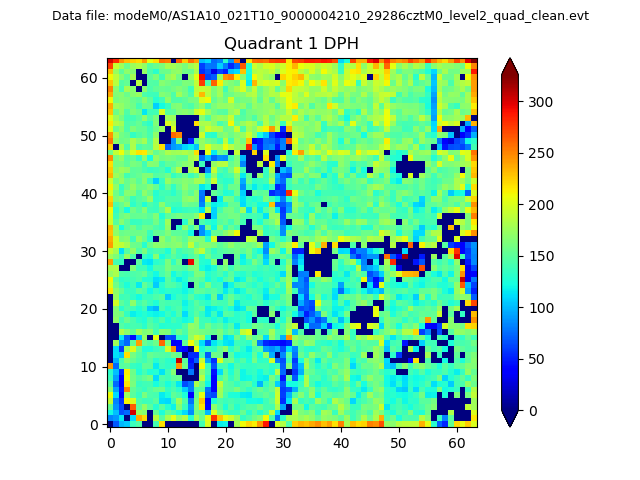 |
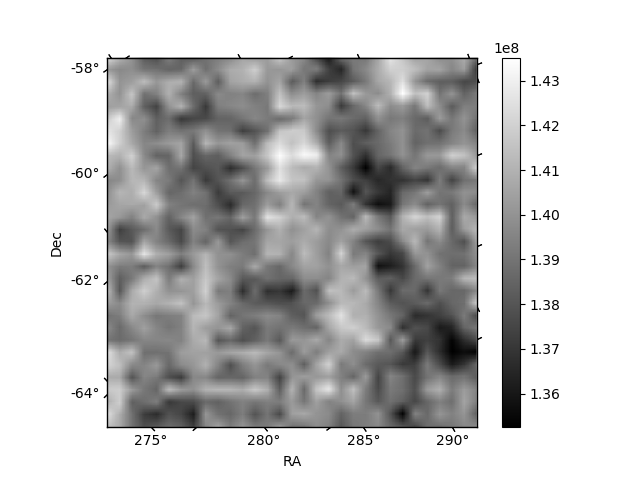
Quadrant B |
|---|---|---|---|
| Quadrant D | 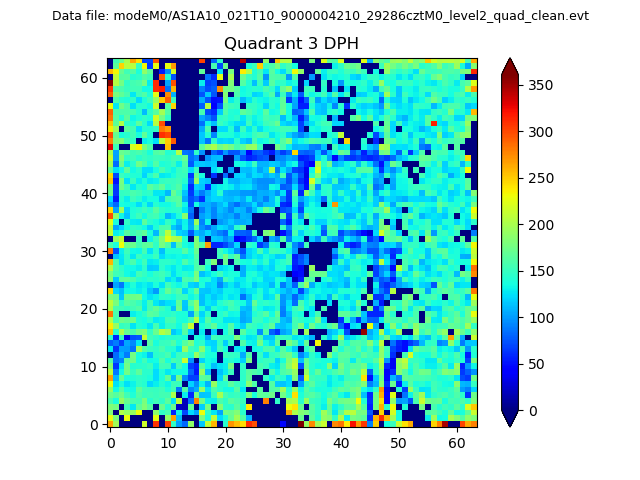 |
 |
Quadrant C |
| Plot type | Count rate plots | Images |
|---|---|---|
| Comparison with Poisson distribution Blue bars denote a histogram of data divided into 1 sec bins. Red curve is a Poisson curve with rate = median count rate of data. |
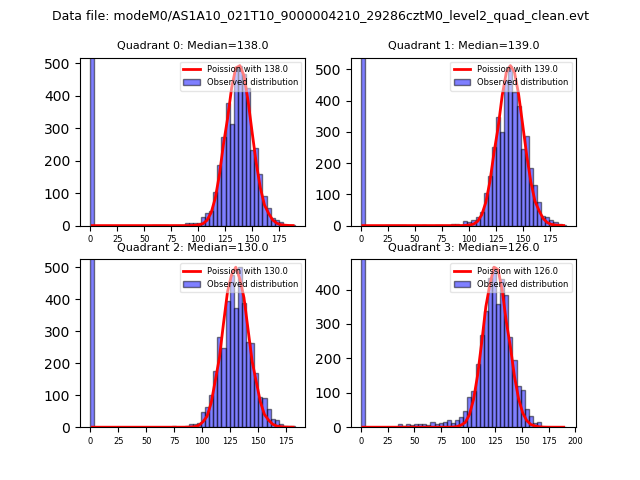 |
 |
| Quadrant-wise count rates Data is divided into 100 sec bins |
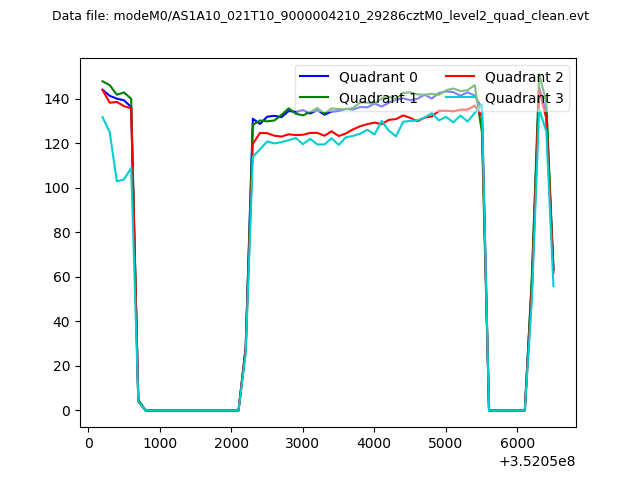 |
|
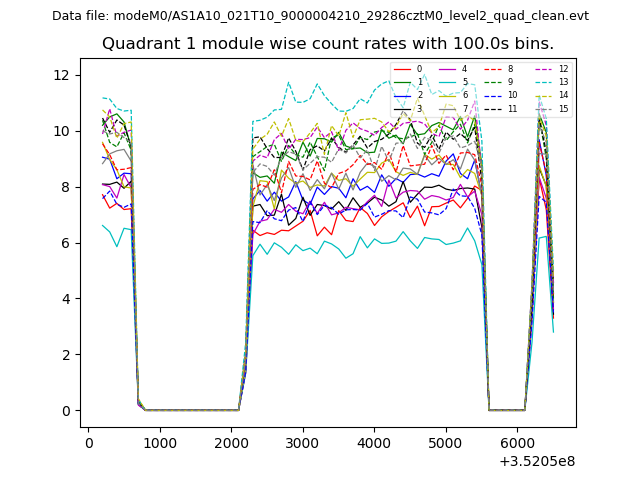
| Module-wise count rates for Quadrant A Data is divided into 100 sec bins |
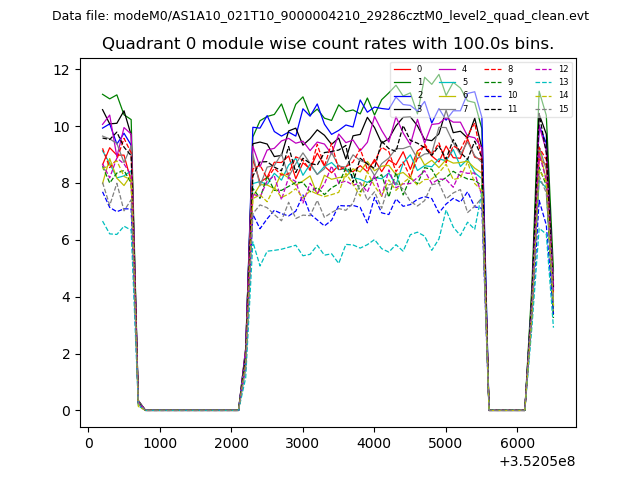 |
 |
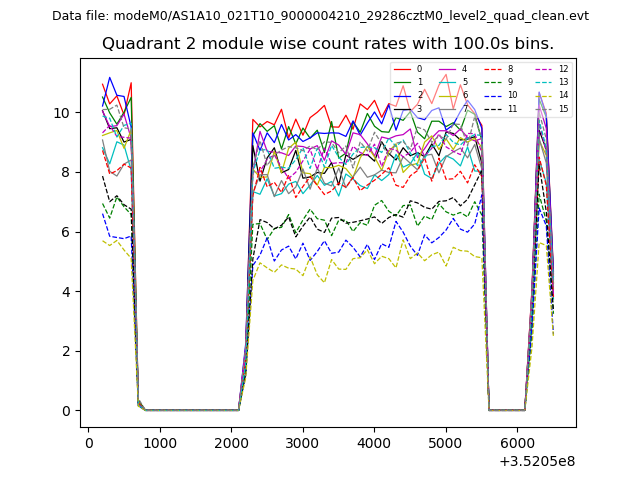
| Module-wise count rates for Quadrant B Data is divided into 100 sec bins |
 |
 |
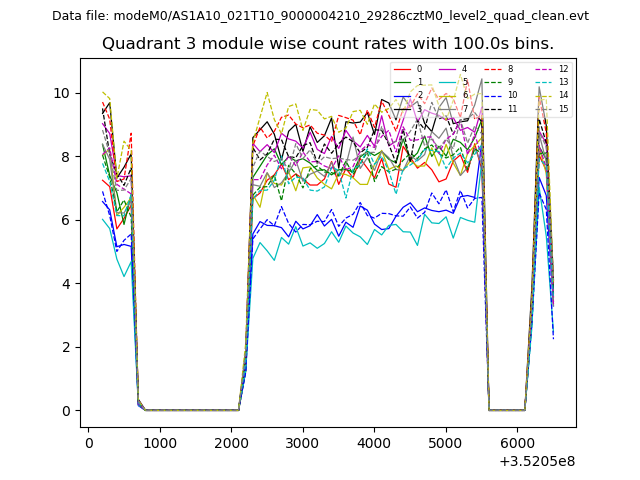
| Module-wise count rates for Quadrant C Data is divided into 100 sec bins |
 |
 |
| Module-wise count rates for Quadrant D Data is divided into 100 sec bins |
 |
 |
| Parameter | Plot |
|---|---|
| CZT HV Monitor | 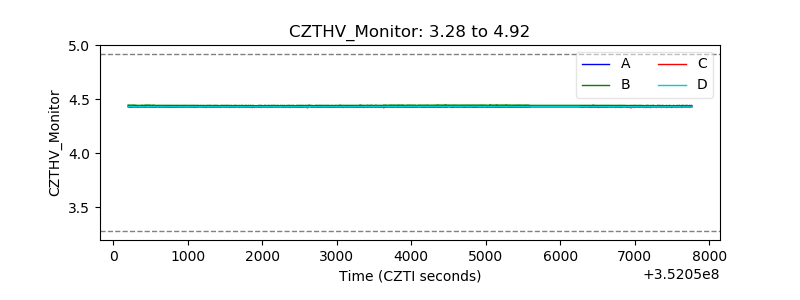 |
| D_VDD | 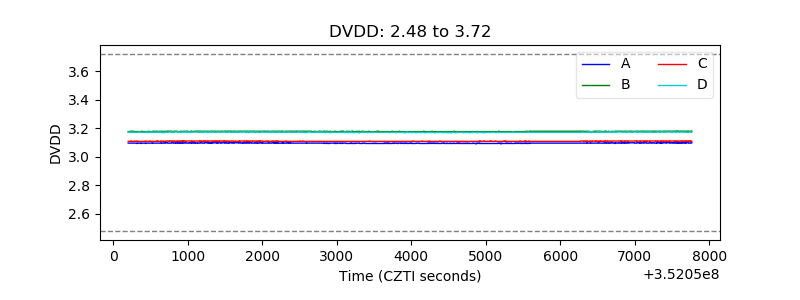 |
| Temperature 1 | 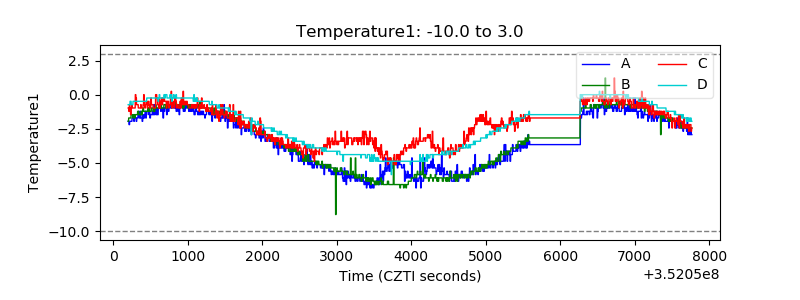 |
| Veto HV Monitor |  |
| Veto LLD | 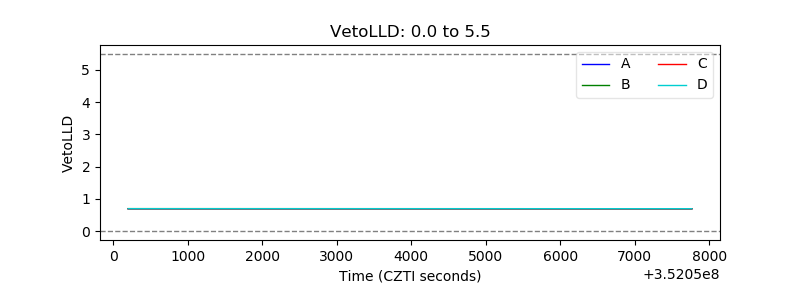 |
| Alpha Counter | 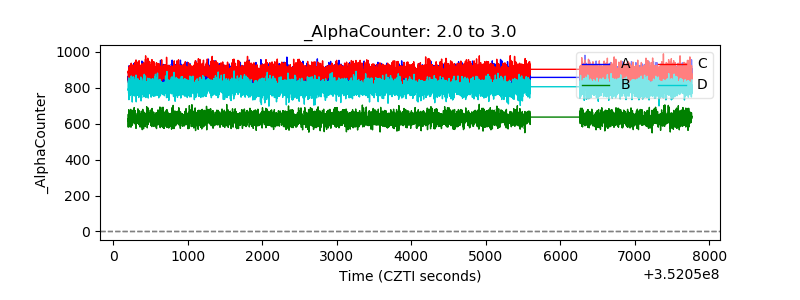 |
| _CPM_Rate |  |
| CZT Counter | 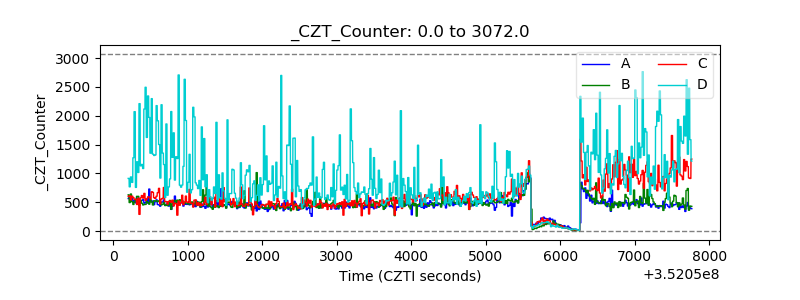 |
| +2.5 Volts monitor |  |
| +5 Volts monitor |  |
| _ROLL_ROT | 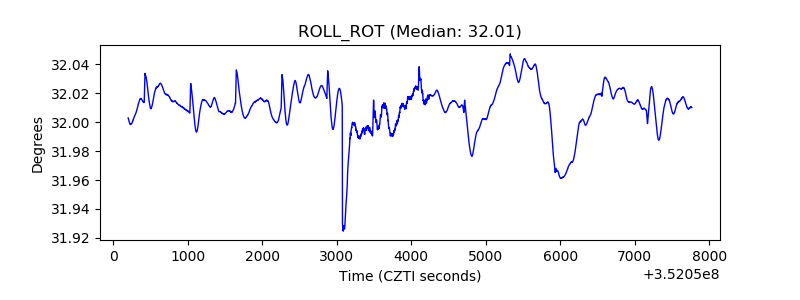 |
| _Roll_DEC | 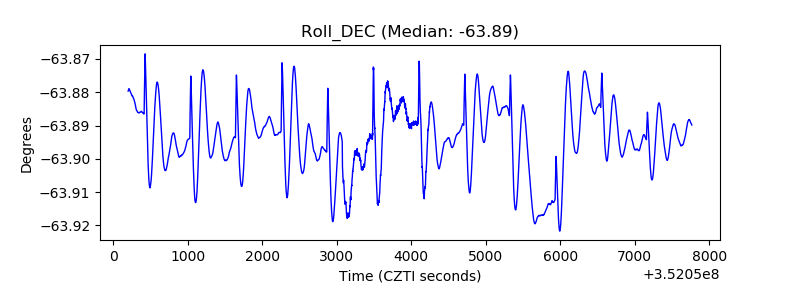 |
| _Roll_RA | 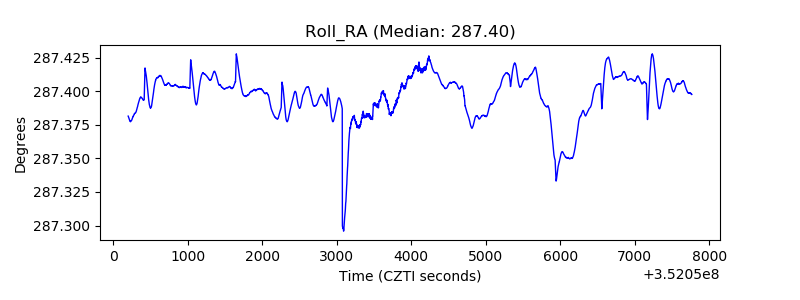 |
| Veto Counter | 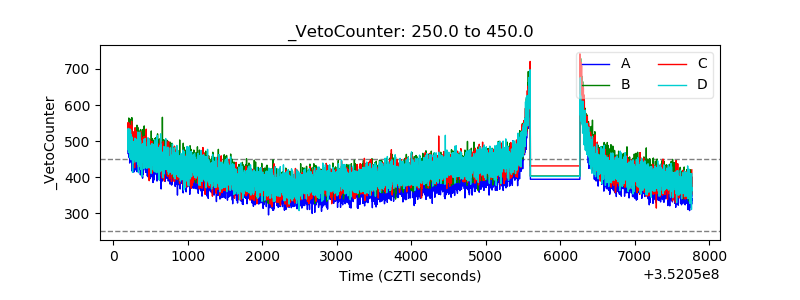 |