| Param | Original file | Final file |
|---|---|---|
| Filename | modeM0/AS1A10_021T10_9000004210_29287cztM0_level2.evt | modeM0/AS1A10_021T10_9000004210_29287cztM0_level2_quad_clean.evt |
| Size (bytes) | 288,236,160 | 23,852,160 |
| Size | 274.9 MB | 22.7 MB |
| Events in quadrant A | 1,200,802 | 139,037 |
| Events in quadrant B | 1,291,340 | 141,233 |
| Events in quadrant C | 2,645,315 | 128,170 |
| Events in quadrant D | 3,410,807 | 123,061 |
| Mode SS | |||
|---|---|---|---|
| Quadrant | BADHDUFLAG | Total packets | Discarded packets |
| A | 0 | 52 | 0 |
| B | 0 | 52 | 0 |
| C | 0 | 52 | 0 |
| D | 0 | 52 | 0 |
| Mode M0 | |||
|---|---|---|---|
| Quadrant | BADHDUFLAG | Total packets | Discarded packets |
| A | 0 | 5396 | 0 |
| B | 0 | 5588 | 0 |
| C | 0 | 9768 | 0 |
| D | 0 | 11987 | 0 |
| Quadrant | Total seconds | Saturated seconds | Saturation percentage |
|---|---|---|---|
| A | 2656 | 3 | 0.112952% |
| B | 2657 | 9 | 0.338728% |
| C | 2657 | 63 | 2.371095% |
| D | 2657 | 379 | 14.264208% |
Noise dominated data is calculated using 1-second bins in cleaned event files. If a bin has >2000 counts, and if more than 50% of those come from <1% of pixels, then it is considered to be noise-dominated and hence unusable.
| Quadrant | # 1 sec bins | Bins with >0 counts | Bins with >2000 counts | High rate bins dominated by noise | Noise dominated (total time) | Noise dominated (detector-on time) | Marked lightcurve |
|---|---|---|---|---|---|---|---|
| A | 2656 | 2656 | 0 | 0 | 0.00% | 0.00% | 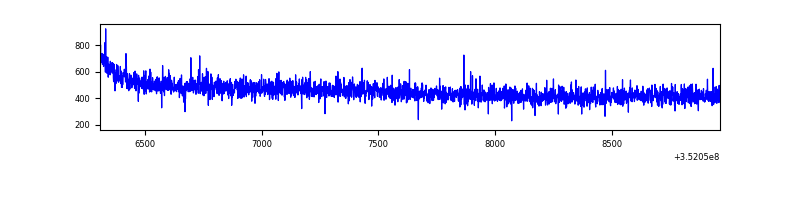 |
| B | 2657 | 2657 | 2 | 2 | 0.08% | 0.08% | 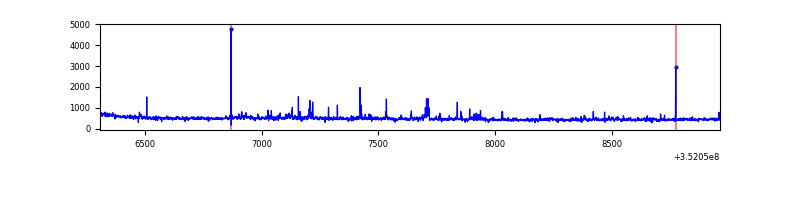 |
| C | 2657 | 2657 | 0 | 0 | 0.00% | 0.00% | 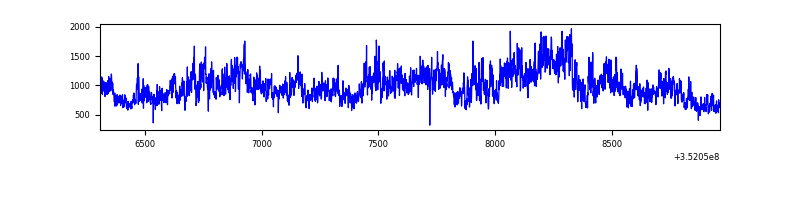 |
| D | 2657 | 2657 | 361 | 361 | 13.59% | 13.59% | 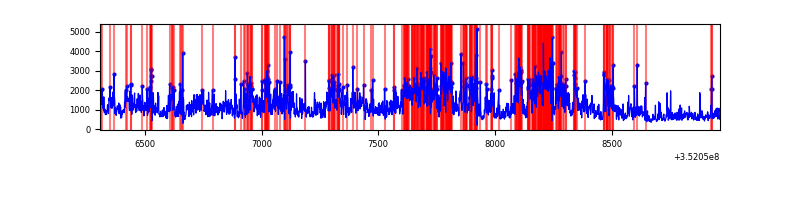 |
Top three noisy pixels from each quadrant. If the there are fewer than three noisy pixels in the level2.evt file, extra rows are filled as -1
| Pixel properties | Quadrant properties | ||||||
|---|---|---|---|---|---|---|---|
| Quadrant | DetID | PixID | Counts | Sigma | Mean | Median | Sigma |
| A | 13 | 254 | 5759 | 85.03 | 310 | 304 | 64.2 |
| A | 3 | 137 | 2989 | 41.85 | 310 | 304 | 64.2 |
| A | 0 | 226 | 2848 | 39.65 | 310 | 304 | 64.2 |
| B | 0 | 244 | 19160 | 315.47 | 308 | 301 | 59.8 |
| B | 10 | 245 | 14771 | 242.05 | 308 | 301 | 59.8 |
| B | 10 | 247 | 13532 | 221.32 | 308 | 301 | 59.8 |
| C | 3 | 233 | 1469045 | 21465.73 | 288 | 287 | 68.4 |
| C | 14 | 238 | 47506 | 690.1 | 288 | 287 | 68.4 |
| C | 2 | 114 | 6749 | 94.44 | 288 | 287 | 68.4 |
| D | 1 | 52 | 976345 | 14040.37 | 284 | 276 | 69.5 |
| D | 8 | 195 | 707544 | 10173.77 | 284 | 276 | 69.5 |
| D | 12 | 79 | 293420 | 4216.76 | 284 | 276 | 69.5 |
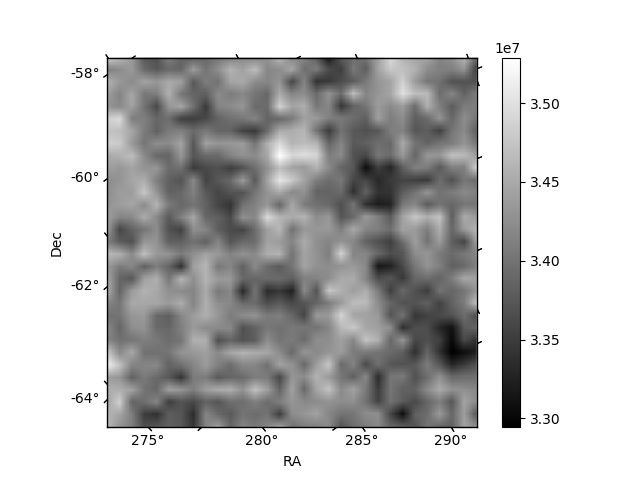
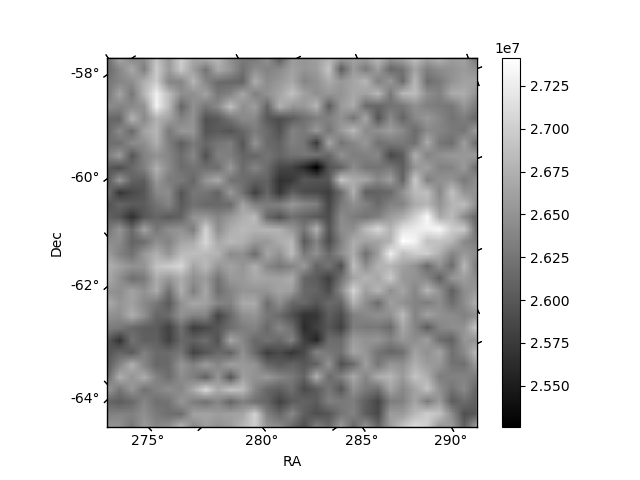
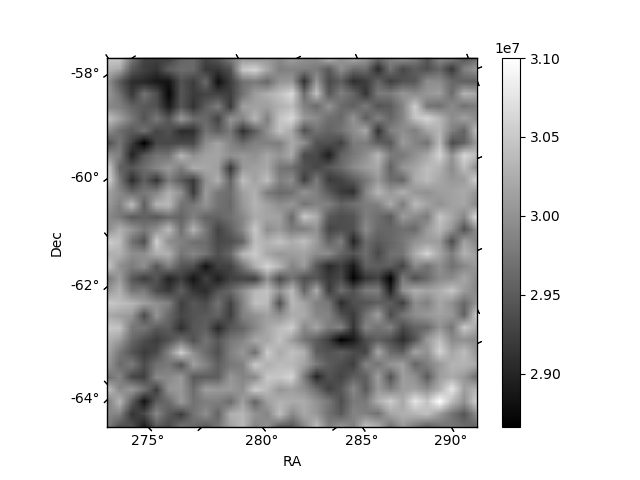
Histogram calculated using DETX and DETY for each event in the final _common_clean file
| Quadrant A | 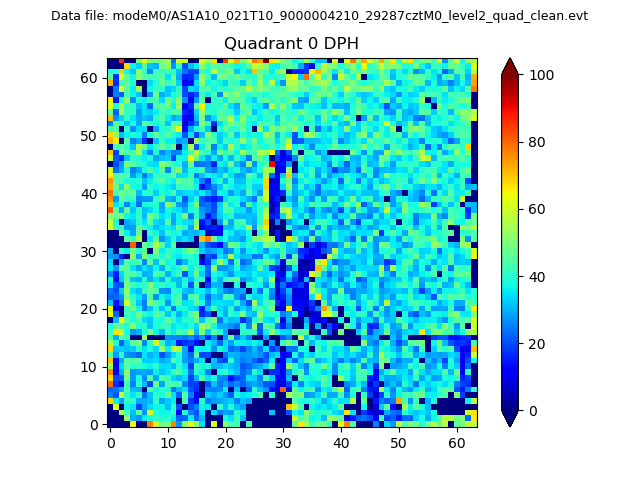 |
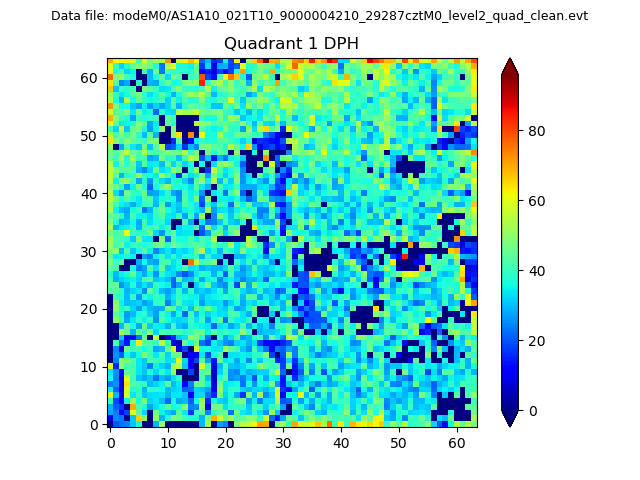 |
Quadrant B |
|---|---|---|---|
| Quadrant D | 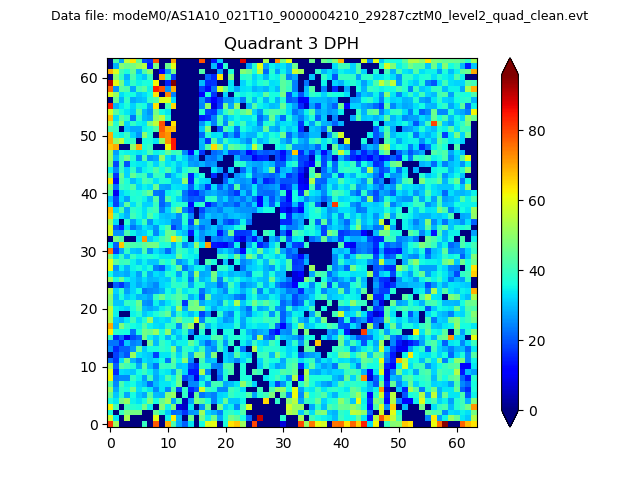 |
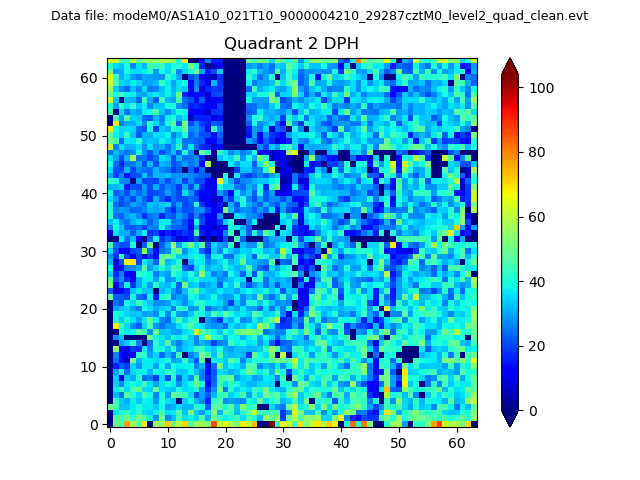 |
Quadrant C |
| Plot type | Count rate plots | Images |
|---|---|---|
| Comparison with Poisson distribution Blue bars denote a histogram of data divided into 1 sec bins. Red curve is a Poisson curve with rate = median count rate of data. |
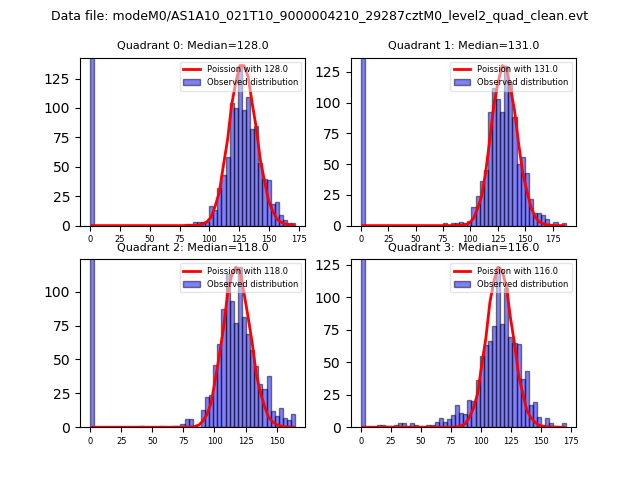 |
 |
| Quadrant-wise count rates Data is divided into 100 sec bins |
 |
|
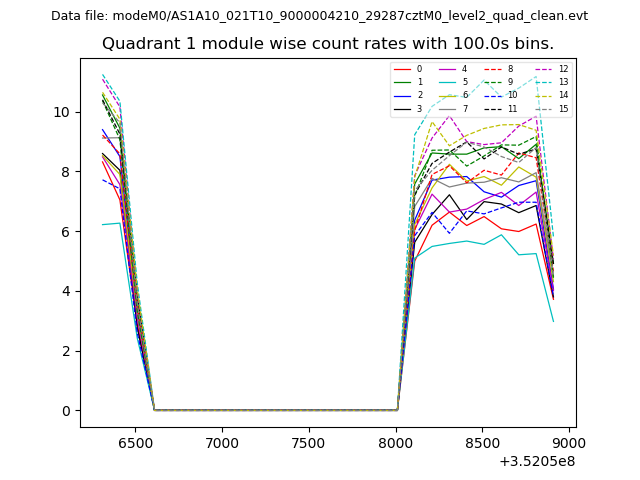
| Module-wise count rates for Quadrant A Data is divided into 100 sec bins |
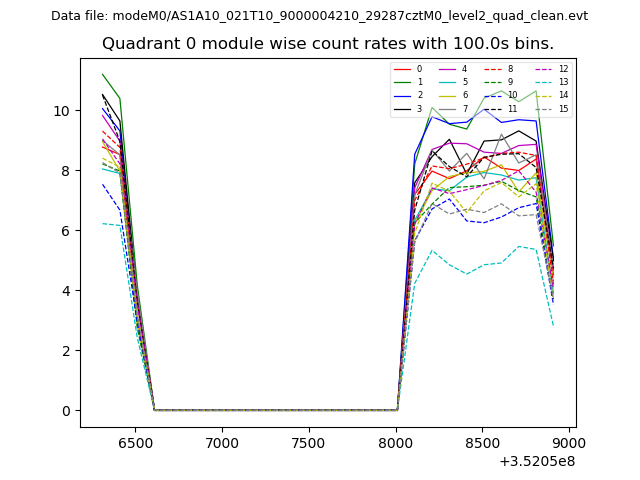 |
 |
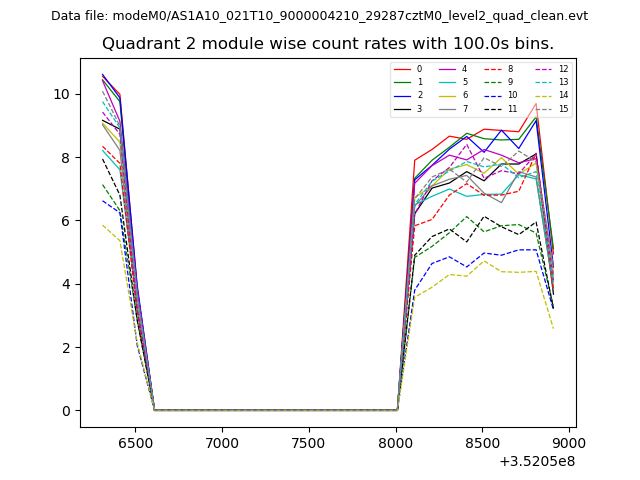
| Module-wise count rates for Quadrant B Data is divided into 100 sec bins |
 |
 |
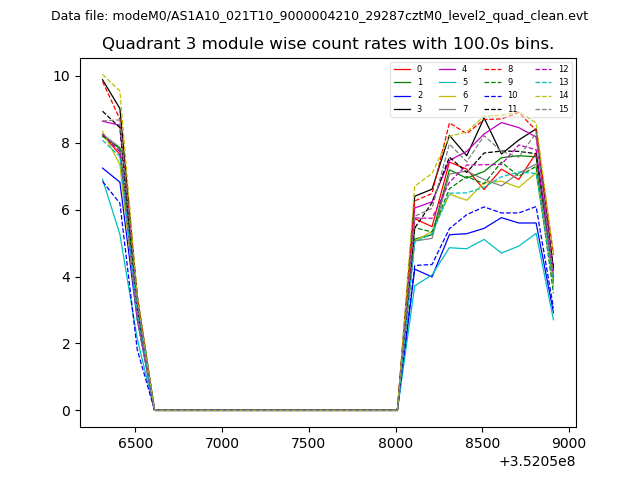
| Module-wise count rates for Quadrant C Data is divided into 100 sec bins |
 |
 |
| Module-wise count rates for Quadrant D Data is divided into 100 sec bins |
 |
 |
| Parameter | Plot |
|---|---|
| CZT HV Monitor | 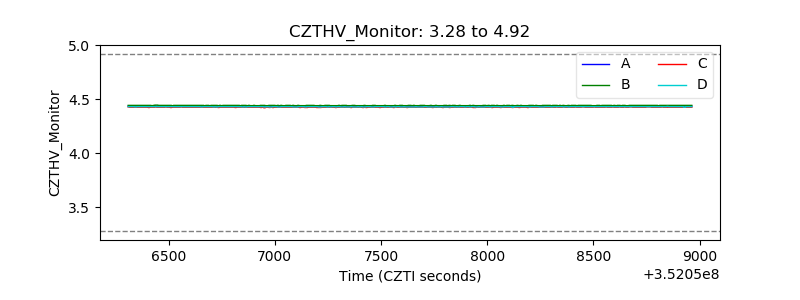 |
| D_VDD | 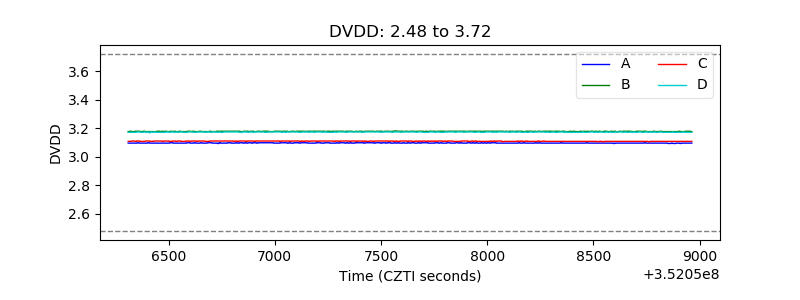 |
| Temperature 1 | 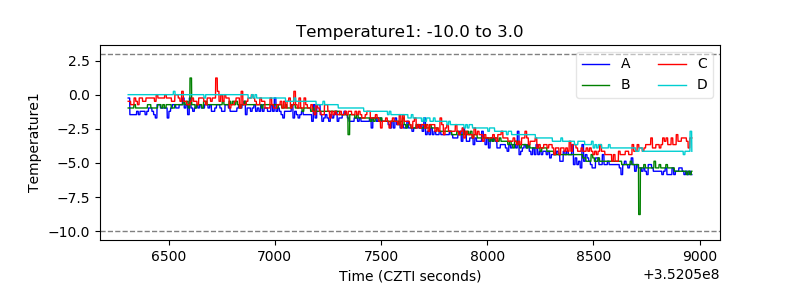 |
| Veto HV Monitor | 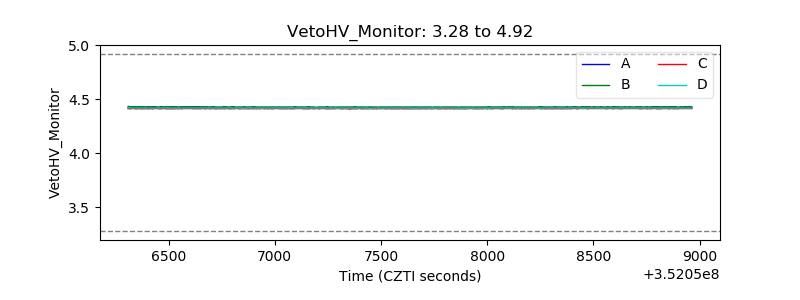 |
| Veto LLD | 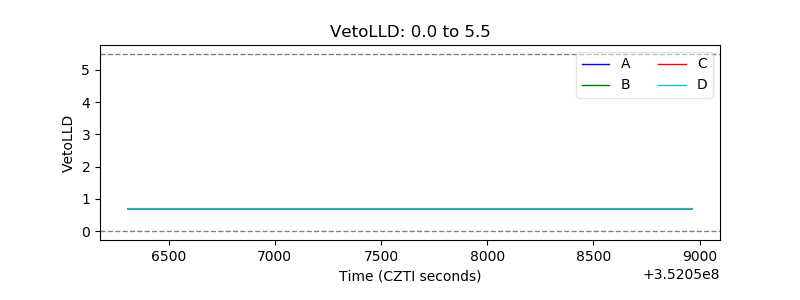 |
| Alpha Counter |  |
| _CPM_Rate | 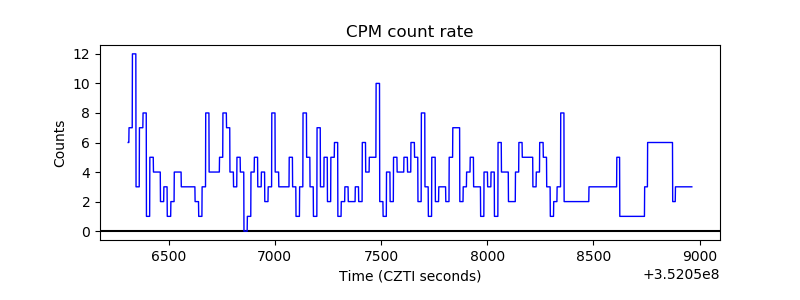 |
| CZT Counter | 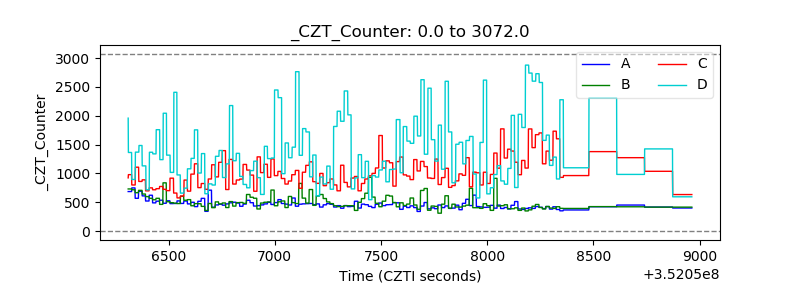 |
| +2.5 Volts monitor |  |
| +5 Volts monitor |  |
| _ROLL_ROT | 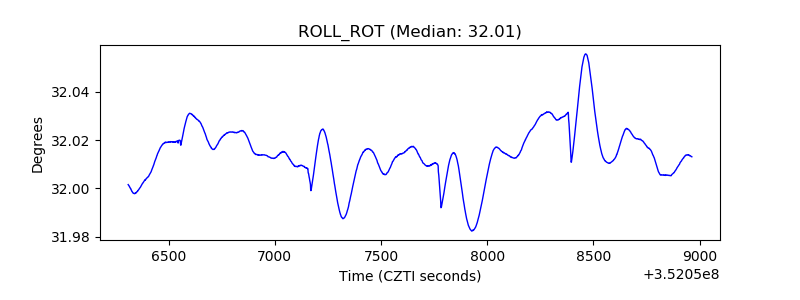 |
| _Roll_DEC | 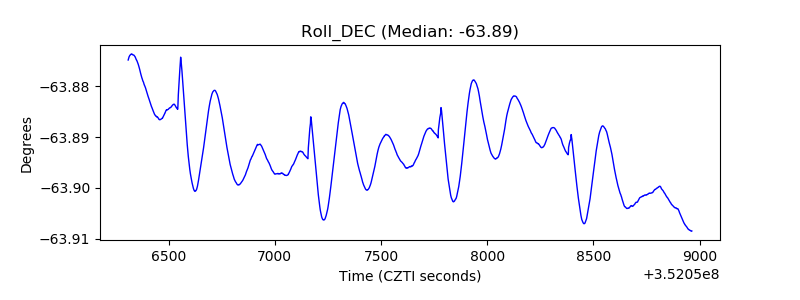 |
| _Roll_RA | 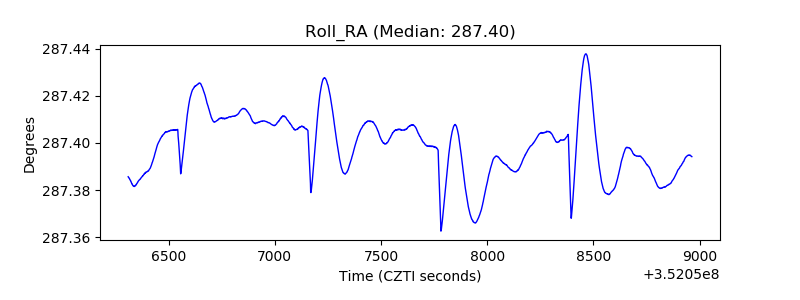 |
| Veto Counter | 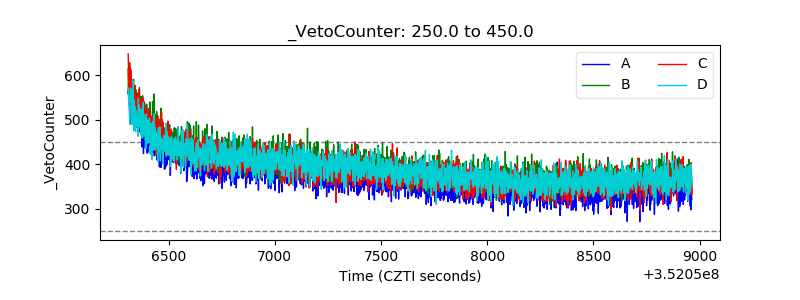 |