| Param | Original file | Final file |
|---|---|---|
| Filename | modeM0/AS1A10_021T10_9000004210_29462cztM0_level2.evt | modeM0/AS1A10_021T10_9000004210_29462cztM0_level2_quad_clean.evt |
| Size (bytes) | 86,987,520 | 16,424,640 |
| Size | 83.0 MB | 15.7 MB |
| Events in quadrant A | 426,841 | 111,128 |
| Events in quadrant B | 451,228 | 115,614 |
| Events in quadrant C | 444,201 | 108,736 |
| Events in quadrant D | 1,250,098 | 93,351 |
| Mode SS | |||
|---|---|---|---|
| Quadrant | BADHDUFLAG | Total packets | Discarded packets |
| A | 0 | 33 | 17 |
| B | 0 | 33 | 15 |
| C | 0 | 31 | 15 |
| D | 0 | 32 | 16 |
| Mode M9 | |||
|---|---|---|---|
| Quadrant | BADHDUFLAG | Total packets | Discarded packets |
| A | 1 | 140143058934568 | 46 |
| B | 1 | -1 | -1 |
| C | 1 | -1 | -1 |
| D | 1 | -1 | -1 |
| Mode M0 | |||
|---|---|---|---|
| Quadrant | BADHDUFLAG | Total packets | Discarded packets |
| A | 0 | 3204 | 1455 |
| B | 0 | 3298 | 1457 |
| C | 0 | 3287 | 1475 |
| D | 0 | 9890 | 5573 |
| Quadrant | Total seconds | Saturated seconds | Saturation percentage |
|---|---|---|---|
| A | 874 | 1 | 0.114416% |
| B | 883 | 1 | 0.113250% |
| C | 881 | 12 | 1.362089% |
| D | 848 | 174 | 20.518868% |
Noise dominated data is calculated using 1-second bins in cleaned event files. If a bin has >2000 counts, and if more than 50% of those come from <1% of pixels, then it is considered to be noise-dominated and hence unusable.
| Quadrant | # 1 sec bins | Bins with >0 counts | Bins with >2000 counts | High rate bins dominated by noise | Noise dominated (total time) | Noise dominated (detector-on time) | Marked lightcurve |
|---|---|---|---|---|---|---|---|
| A | 7202 | 900 | 0 | 0 | 0.00% | 0.00% | 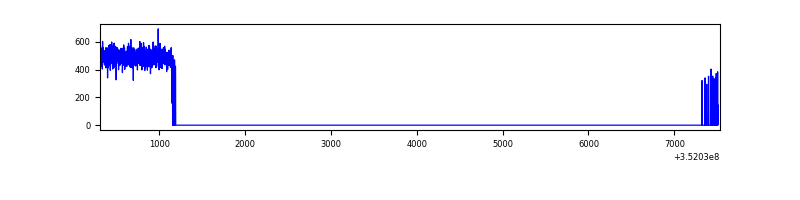 |
| B | 7209 | 915 | 0 | 0 | 0.00% | 0.00% |  |
| C | 7225 | 910 | 0 | 0 | 0.00% | 0.00% | 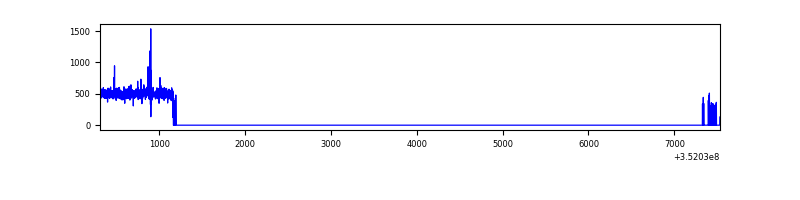 |
| D | 866 | 850 | 167 | 167 | 19.28% | 19.65% | 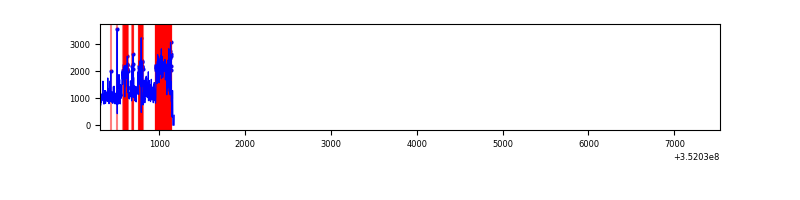 |
Top three noisy pixels from each quadrant. If the there are fewer than three noisy pixels in the level2.evt file, extra rows are filled as -1
| Pixel properties | Quadrant properties | ||||||
|---|---|---|---|---|---|---|---|
| Quadrant | DetID | PixID | Counts | Sigma | Mean | Median | Sigma |
| A | 13 | 254 | 1446 | 53.91 | 110 | 108 | 24.8 |
| A | 3 | 137 | 1083 | 39.28 | 110 | 108 | 24.8 |
| A | 0 | 226 | 922 | 32.79 | 110 | 108 | 24.8 |
| B | 0 | 190 | 14459 | 599.44 | 109 | 106 | 23.9 |
| B | 0 | 230 | 5602 | 229.54 | 109 | 106 | 23.9 |
| B | 12 | 111 | 2710 | 108.75 | 109 | 106 | 23.9 |
| C | 14 | 238 | 21608 | 815.42 | 104 | 104 | 26.4 |
| C | 14 | 254 | 7350 | 274.76 | 104 | 104 | 26.4 |
| C | 3 | 233 | 2044 | 73.56 | 104 | 104 | 26.4 |
| D | 8 | 195 | 720758 | 28134.46 | 98 | 96 | 25.6 |
| D | 1 | 52 | 80312 | 3131.61 | 98 | 96 | 25.6 |
| D | 13 | 153 | 32424 | 1262.08 | 98 | 96 | 25.6 |
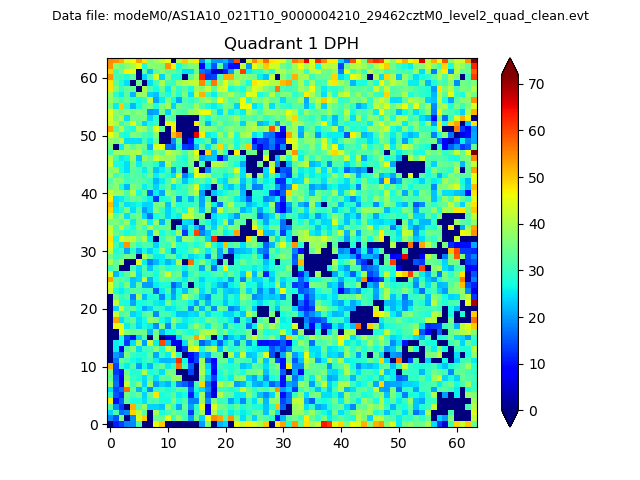
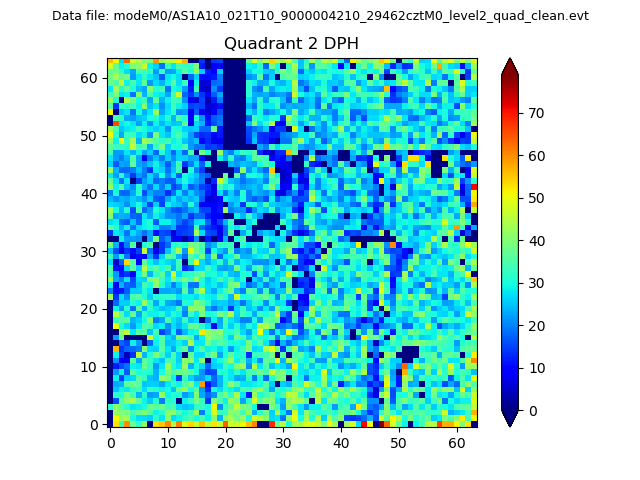
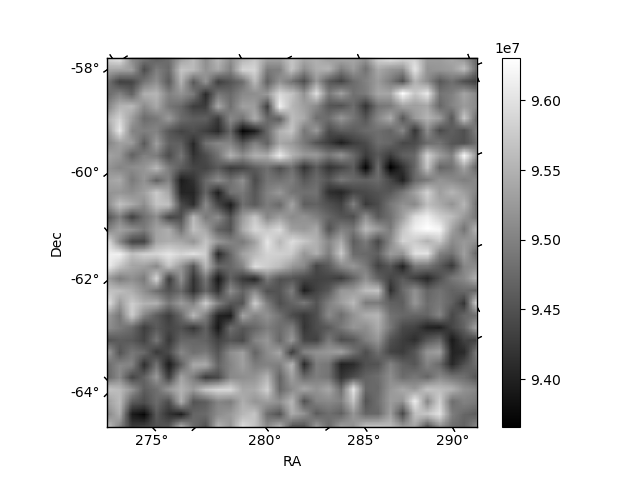
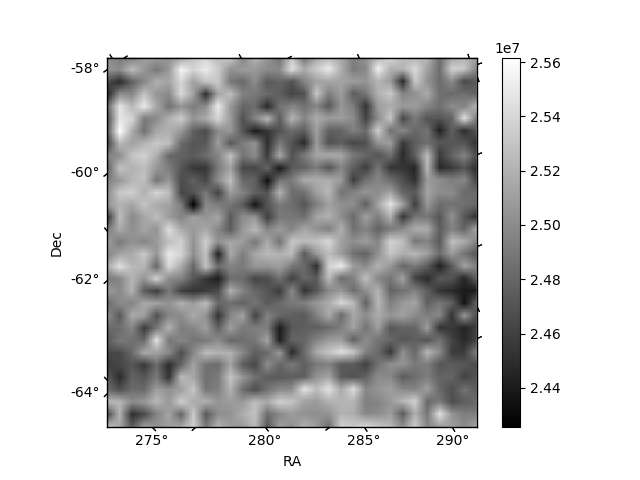
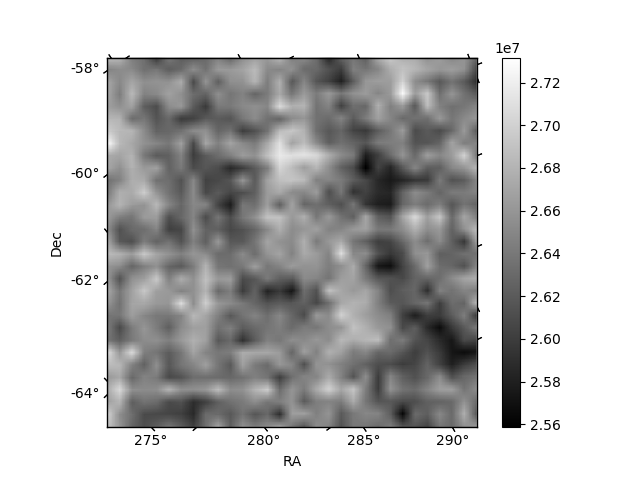
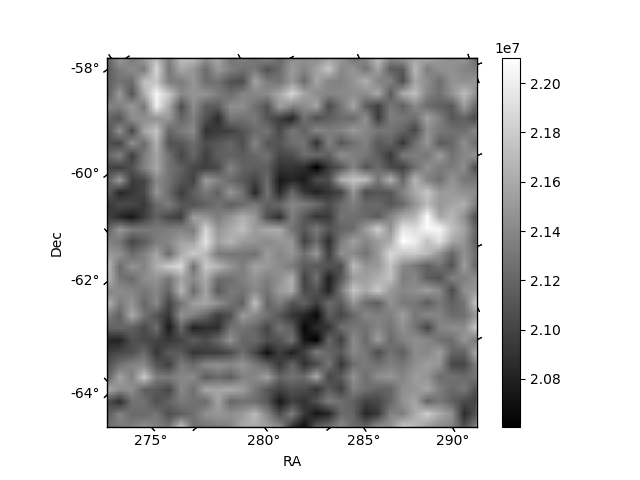
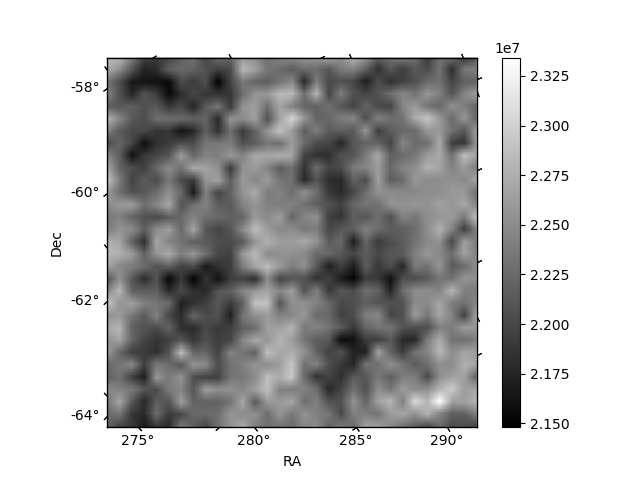
Histogram calculated using DETX and DETY for each event in the final _common_clean file
| Quadrant A | 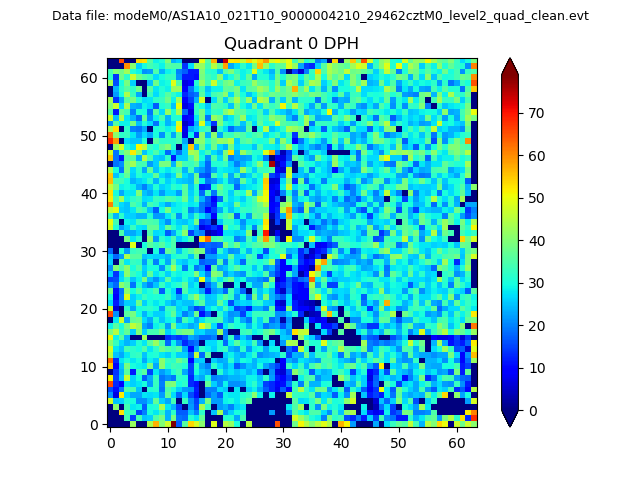 |
 |
Quadrant B |
|---|---|---|---|
| Quadrant D | 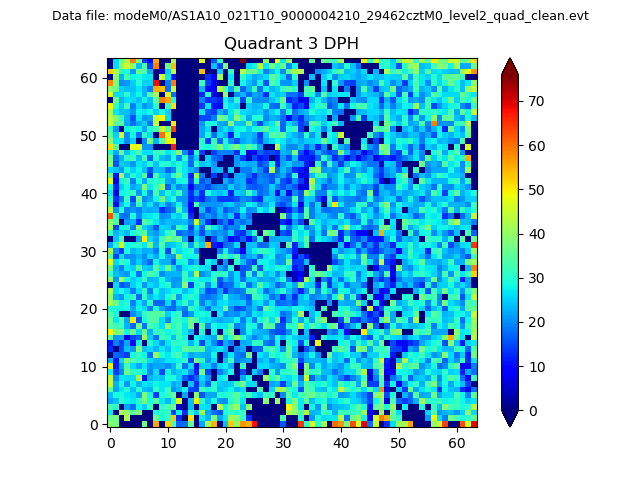 |
 |
Quadrant C |
| Plot type | Count rate plots | Images |
|---|---|---|
| Comparison with Poisson distribution Blue bars denote a histogram of data divided into 1 sec bins. Red curve is a Poisson curve with rate = median count rate of data. |
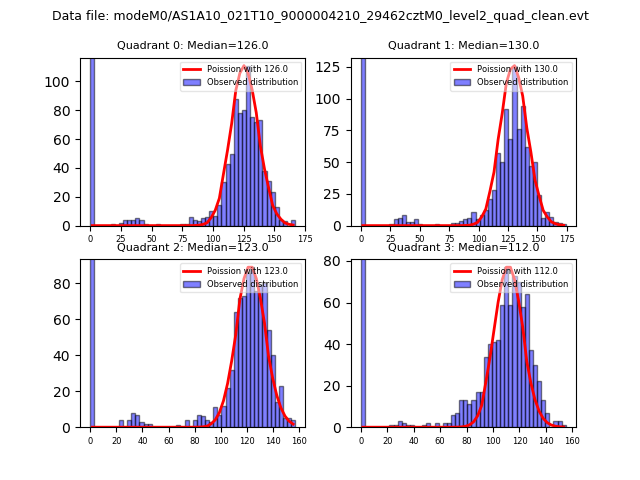 |
 |
| Quadrant-wise count rates Data is divided into 100 sec bins |
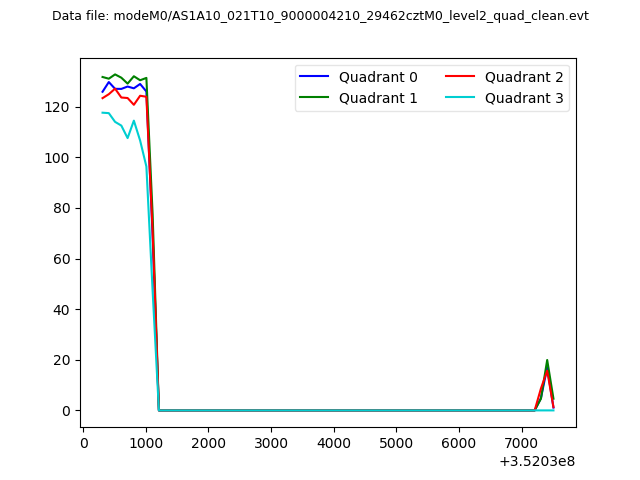 |
|
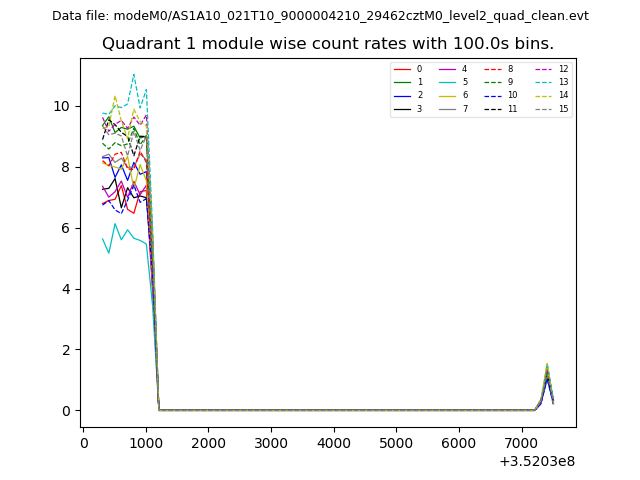
| Module-wise count rates for Quadrant A Data is divided into 100 sec bins |
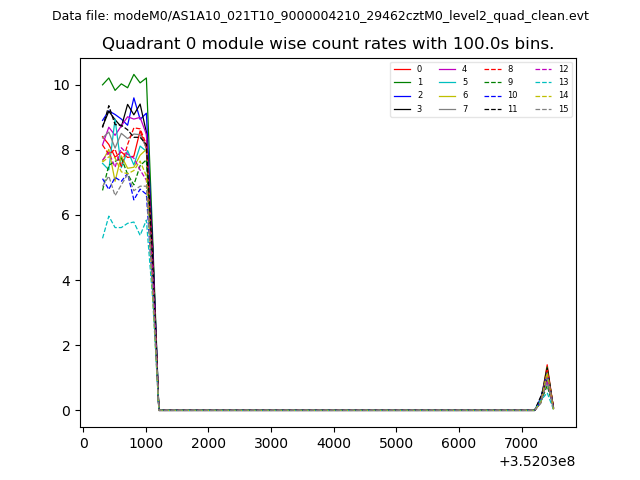 |
 |
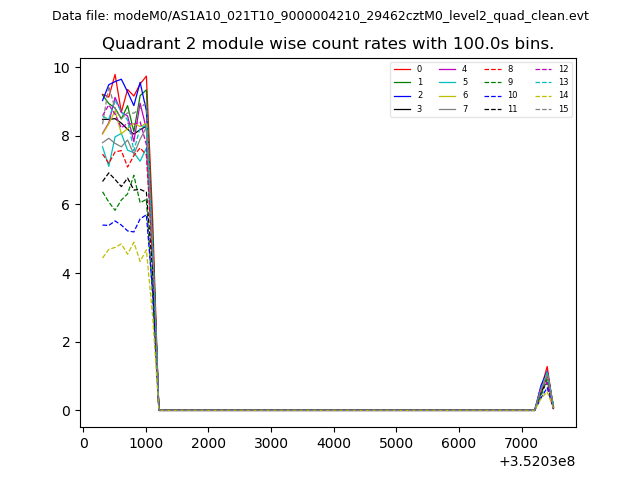
| Module-wise count rates for Quadrant B Data is divided into 100 sec bins |
 |
 |
| Module-wise count rates for Quadrant C Data is divided into 100 sec bins |
 |
 |
| Module-wise count rates for Quadrant D Data is divided into 100 sec bins |
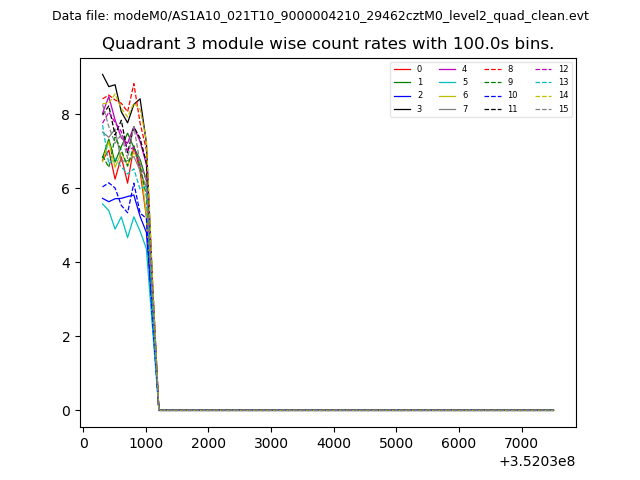 |
 |
| Parameter | Plot |
|---|---|
| CZT HV Monitor | 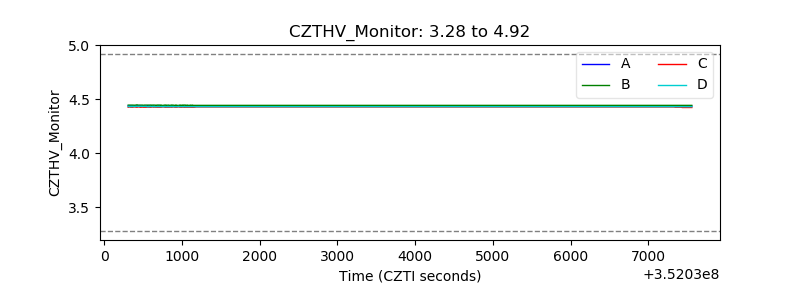 |
| D_VDD | 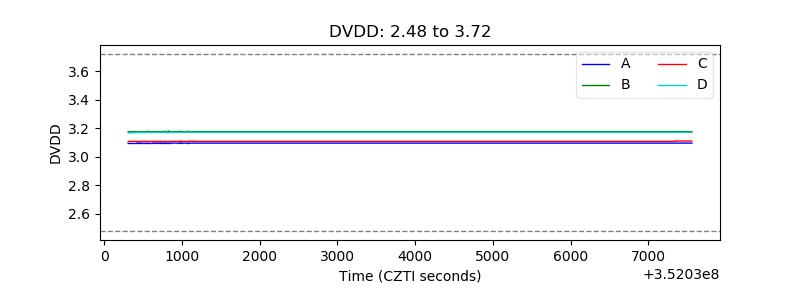 |
| Temperature 1 | 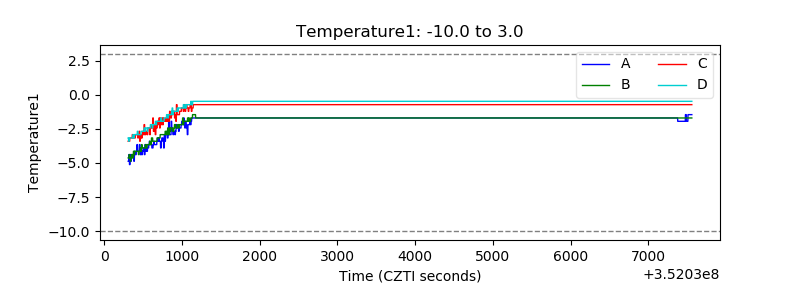 |
| Veto HV Monitor | 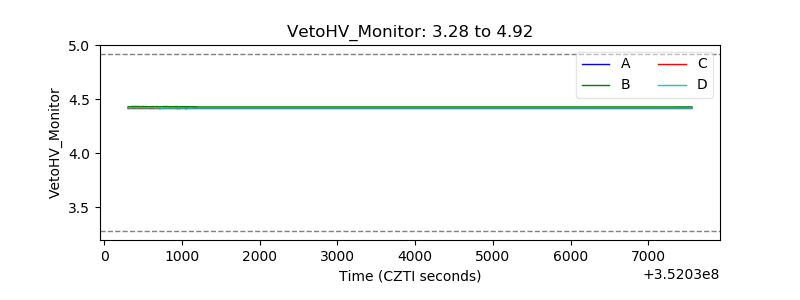 |
| Veto LLD | 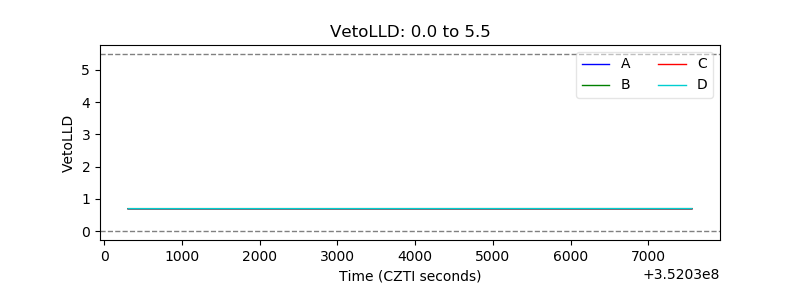 |
| Alpha Counter |  |
| _CPM_Rate | 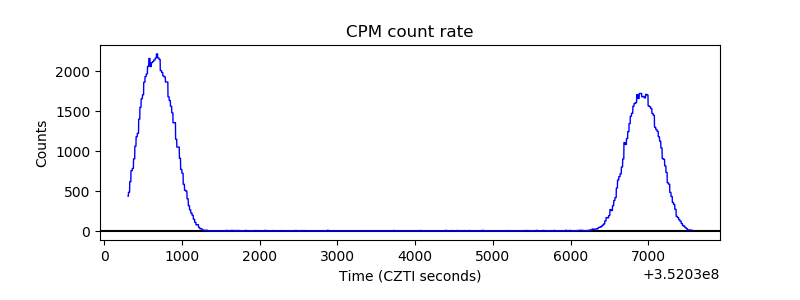 |
| CZT Counter | 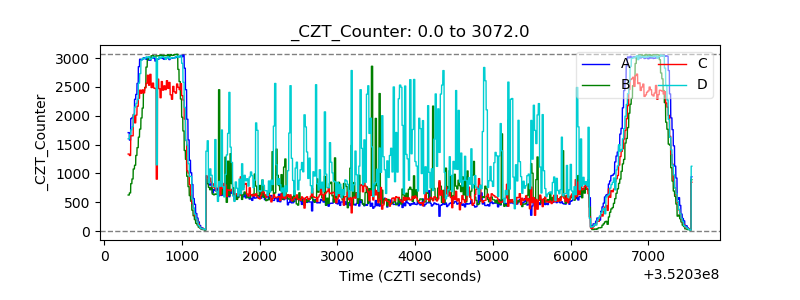 |
| +2.5 Volts monitor |  |
| +5 Volts monitor |  |
| _ROLL_ROT | 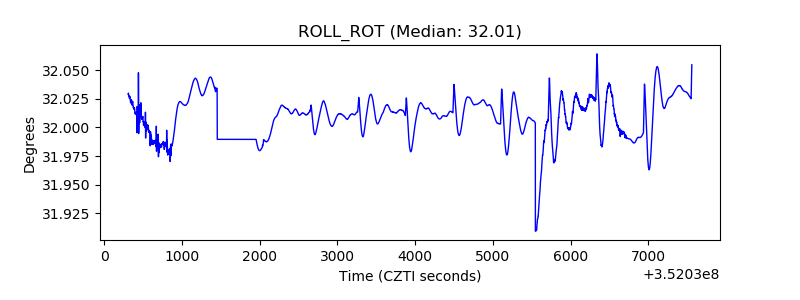 |
| _Roll_DEC | 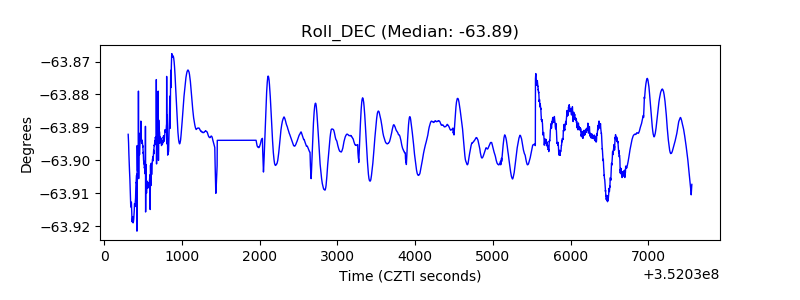 |
| _Roll_RA | 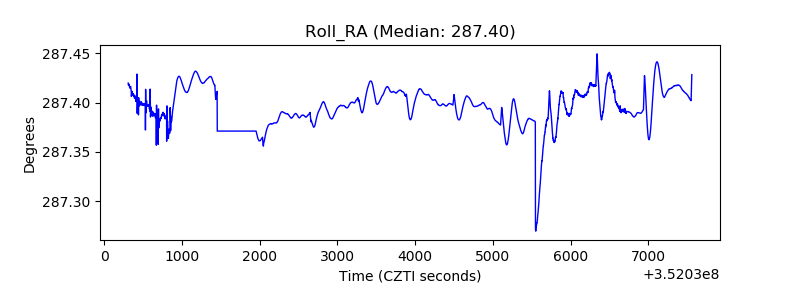 |
| Veto Counter | 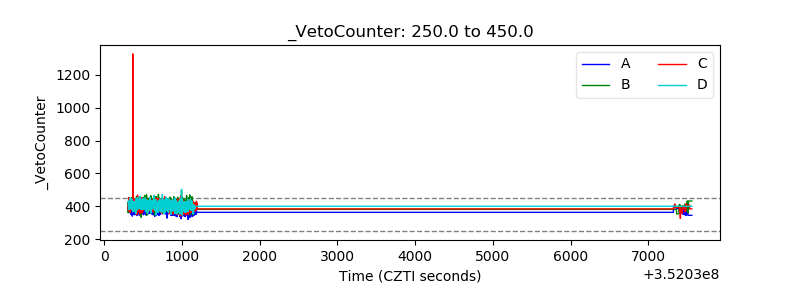 |