| Param | Original file | Final file |
|---|---|---|
| Filename | modeM0/AS1A10_050T01_9000004212cztM0_level2.fits | modeM0/AS1A10_050T01_9000004212cztM0_level2_quad_clean.evt |
| Size (bytes) | 1,021,181,760 | 857,370,240 |
| Size | 973.9 MB | 817.7 MB |
| Events in quadrant A | 6,711,592 | 5,236,939 |
| Events in quadrant B | 6,277,124 | 5,115,253 |
| Events in quadrant C | 5,196,408 | 3,928,869 |
| Events in quadrant D | 5,307,464 | 4,276,648 |
| Mode M9 | |||
|---|---|---|---|
| Quadrant | BADHDUFLAG | Total packets | Discarded packets |
| A | 0 | 178 | 0 |
| B | 0 | 178 | 0 |
| C | 0 | 178 | 0 |
| D | 0 | 178 | 0 |
| Mode M0 | |||
|---|---|---|---|
| Quadrant | BADHDUFLAG | Total packets | Discarded packets |
| A | 0 | 226957 | 0 |
| B | 0 | 256754 | 0 |
| C | 0 | 569222 | 0 |
| D | 0 | 427619 | 0 |
| Mode SS | |||
|---|---|---|---|
| Quadrant | BADHDUFLAG | Total packets | Discarded packets |
| A | 0 | 2202 | 0 |
| B | 0 | 2202 | 0 |
| C | 0 | 2202 | 0 |
| D | 0 | 2202 | 0 |
| Quadrant | Total seconds | Saturated seconds | Saturation percentage |
|---|---|---|---|
| A | 108022 | 1234 | 1.142360% |
| B | 108022 | 3963 | 3.668697% |
| C | 108021 | 46572 | 43.113839% |
| D | 108023 | 16281 | 15.071790% |
Noise dominated data is calculated using 1-second bins in cleaned event files. If a bin has >2000 counts, and if more than 50% of those come from <1% of pixels, then it is considered to be noise-dominated and hence unusable.
| Quadrant | # 1 sec bins | Bins with >0 counts | Bins with >2000 counts | High rate bins dominated by noise | Noise dominated (total time) | Noise dominated (detector-on time) | Marked lightcurve |
|---|---|---|---|---|---|---|---|
| A | 139482 | 108023 | 0 | 0 | 0.00% | 0.00% |  |
| B | 139482 | 107943 | 0 | 0 | 0.00% | 0.00% |  |
| C | 139482 | 107837 | 0 | 0 | 0.00% | 0.00% |  |
| D | 139482 | 107878 | 0 | 0 | 0.00% | 0.00% |  |
Top three noisy pixels from each quadrant. If the there are fewer than three noisy pixels in the level2.evt file, extra rows are filled as -1
| Pixel properties | Quadrant properties | ||||||
|---|---|---|---|---|---|---|---|
| Quadrant | DetID | PixID | Counts | Sigma | Mean | Median | Sigma |
| A | 0 | 29 | 5529 | 9.25 | 1747 | 1640 | 420.3 |
| A | 7 | 110 | 5276 | 8.65 | 1747 | 1640 | 420.3 |
| A | 9 | 19 | 4955 | 7.89 | 1747 | 1640 | 420.3 |
| B | 2 | 9 | 5033 | 10.47 | 1663 | 1583 | 329.5 |
| B | 2 | 8 | 4204 | 7.95 | 1663 | 1583 | 329.5 |
| B | 3 | 17 | 4165 | 7.84 | 1663 | 1583 | 329.5 |
| C | 12 | 241 | 3662 | 6.76 | 1375 | 1288 | 351.4 |
| C | 3 | 187 | 3555 | 6.45 | 1375 | 1288 | 351.4 |
| C | 3 | 126 | 3470 | 6.21 | 1375 | 1288 | 351.4 |
| D | 15 | 46 | 4049 | 6.58 | 1520 | 1382 | 405.6 |
| D | 10 | 189 | 3797 | 5.95 | 1520 | 1382 | 405.6 |
| D | 3 | 14 | 3774 | 5.9 | 1520 | 1382 | 405.6 |
Histogram calculated using DETX and DETY for each event in the final _common_clean file
| Quadrant A | 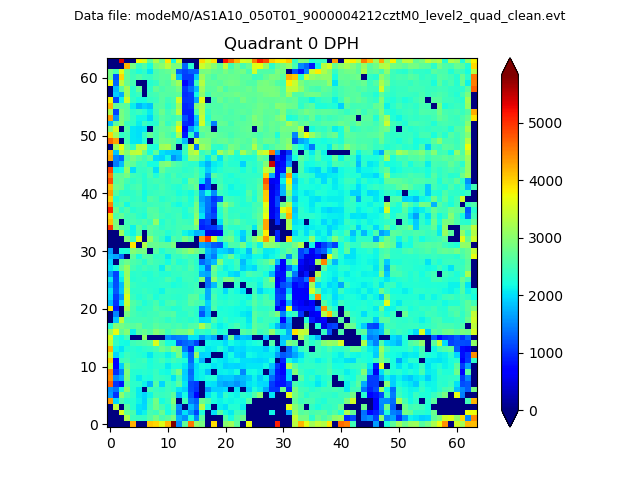 |
 |
Quadrant B |
|---|---|---|---|
| Quadrant D | 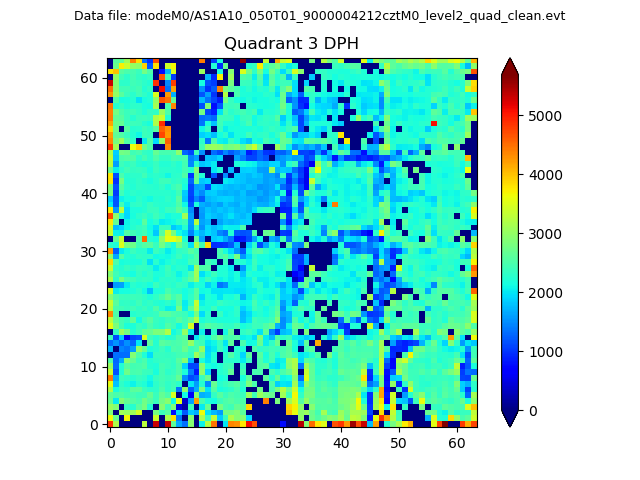 |
 |
Quadrant C |
| Plot type | Count rate plots | Images |
|---|---|---|
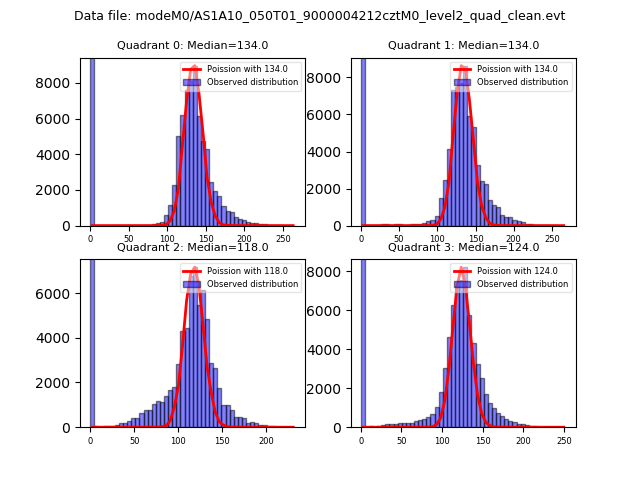
| Comparison with Poisson distribution Blue bars denote a histogram of data divided into 1 sec bins. Red curve is a Poisson curve with rate = median count rate of data. |
 |
 |
| Quadrant-wise count rates Data is divided into 100 sec bins |
 |
|
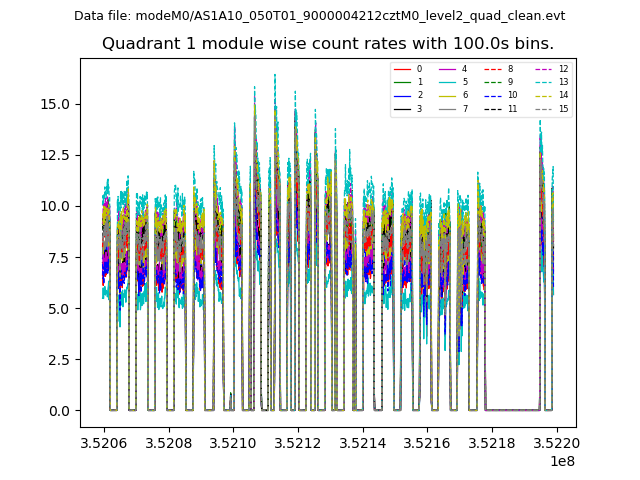
| Module-wise count rates for Quadrant A Data is divided into 100 sec bins |
 |
 |
| Module-wise count rates for Quadrant B Data is divided into 100 sec bins |
 |
 |
| Module-wise count rates for Quadrant C Data is divided into 100 sec bins |
 |
 |
| Module-wise count rates for Quadrant D Data is divided into 100 sec bins |
 |
 |
| Parameter | Plot |
|---|---|
| CZT HV Monitor |  |
| D_VDD | 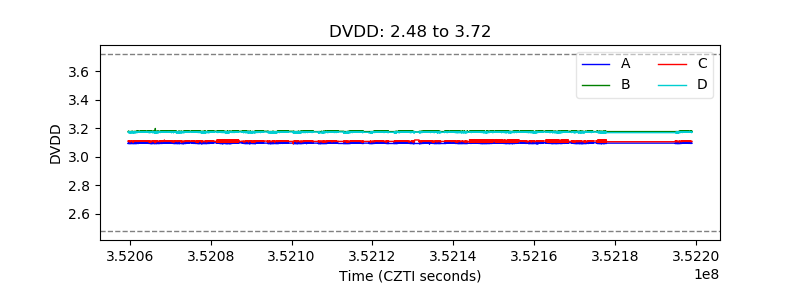 |
| Temperature 1 | 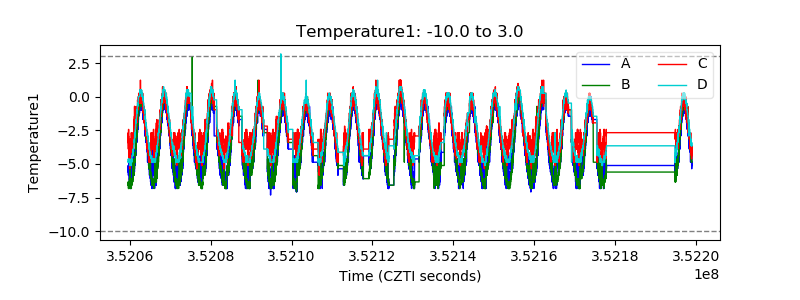 |
| Veto HV Monitor |  |
| Veto LLD | 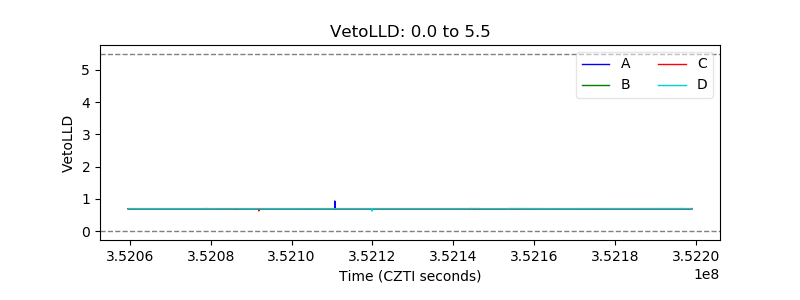 |
| Alpha Counter |  |
| _CPM_Rate |  |
| CZT Counter |  |
| +2.5 Volts monitor | 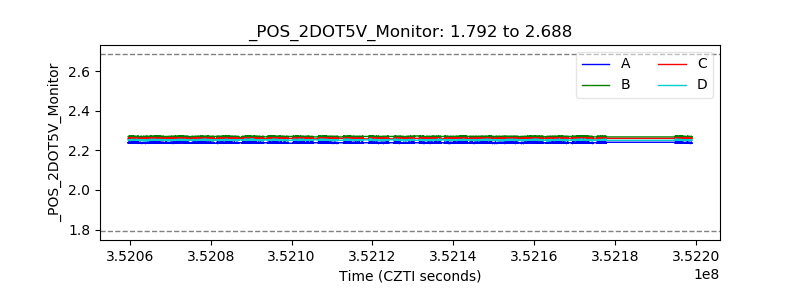 |
| +5 Volts monitor |  |
| _ROLL_ROT | 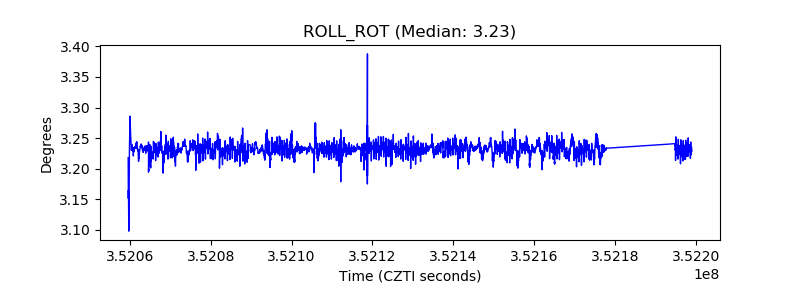 |
| _Roll_DEC | 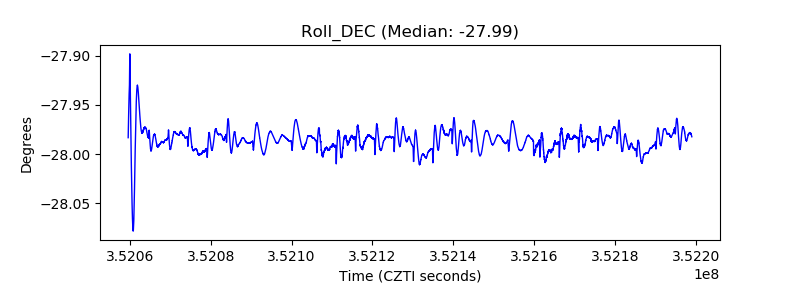 |
| _Roll_RA |  |
| Veto Counter |  |