| Param | Original file | Final file |
|---|---|---|
| Filename | modeM0/AS1A10_050T01_9000004212_29287cztM0_level2.evt | modeM0/AS1A10_050T01_9000004212_29287cztM0_level2_quad_clean.evt |
| Size (bytes) | 523,065,600 | 50,391,360 |
| Size | 498.8 MB | 48.1 MB |
| Events in quadrant A | 2,177,356 | 316,813 |
| Events in quadrant B | 2,318,824 | 319,728 |
| Events in quadrant C | 5,908,246 | 293,496 |
| Events in quadrant D | 5,147,557 | 295,219 |
| Mode M9 | |||
|---|---|---|---|
| Quadrant | BADHDUFLAG | Total packets | Discarded packets |
| A | 0 | 3 | 0 |
| B | 0 | 3 | 0 |
| C | 0 | 3 | 0 |
| D | 0 | 3 | 0 |
| Mode M0 | |||
|---|---|---|---|
| Quadrant | BADHDUFLAG | Total packets | Discarded packets |
| A | 0 | 9155 | 1 |
| B | 0 | 9615 | 1 |
| C | 0 | 20593 | 1 |
| D | 0 | 18337 | 3 |
| Mode SS | |||
|---|---|---|---|
| Quadrant | BADHDUFLAG | Total packets | Discarded packets |
| A | 0 | 88 | 0 |
| B | 0 | 88 | 0 |
| C | 0 | 88 | 0 |
| D | 0 | 88 | 0 |
| Quadrant | Total seconds | Saturated seconds | Saturation percentage |
|---|---|---|---|
| A | 4263 | 156 | 3.659395% |
| B | 4263 | 196 | 4.597701% |
| C | 4263 | 1562 | 36.640863% |
| D | 4262 | 961 | 22.548099% |
Noise dominated data is calculated using 1-second bins in cleaned event files. If a bin has >2000 counts, and if more than 50% of those come from <1% of pixels, then it is considered to be noise-dominated and hence unusable.
| Quadrant | # 1 sec bins | Bins with >0 counts | Bins with >2000 counts | High rate bins dominated by noise | Noise dominated (total time) | Noise dominated (detector-on time) | Marked lightcurve |
|---|---|---|---|---|---|---|---|
| A | 4513 | 4264 | 2 | 2 | 0.04% | 0.05% |  |
| B | 4513 | 4264 | 5 | 5 | 0.11% | 0.12% |  |
| C | 4513 | 4264 | 664 | 664 | 14.71% | 15.57% |  |
| D | 4512 | 4263 | 567 | 567 | 12.57% | 13.30% |  |
Top three noisy pixels from each quadrant. If the there are fewer than three noisy pixels in the level2.evt file, extra rows are filled as -1
| Pixel properties | Quadrant properties | ||||||
|---|---|---|---|---|---|---|---|
| Quadrant | DetID | PixID | Counts | Sigma | Mean | Median | Sigma |
| A | 15 | 174 | 18559 | 156.5 | 559 | 545 | 115.1 |
| A | 13 | 254 | 8624 | 70.19 | 559 | 545 | 115.1 |
| A | 3 | 137 | 5492 | 42.98 | 559 | 545 | 115.1 |
| B | 0 | 230 | 64170 | 582.32 | 551 | 537 | 109.3 |
| B | 10 | 245 | 19675 | 175.14 | 551 | 537 | 109.3 |
| B | 0 | 156 | 14830 | 130.8 | 551 | 537 | 109.3 |
| C | 3 | 233 | 3883169 | 34036.84 | 477 | 480 | 114.1 |
| C | 14 | 238 | 103414 | 902.35 | 477 | 480 | 114.1 |
| C | 14 | 254 | 50539 | 438.83 | 477 | 480 | 114.1 |
| D | 1 | 52 | 1129646 | 9042.44 | 507 | 491 | 124.9 |
| D | 8 | 195 | 862748 | 6905.08 | 507 | 491 | 124.9 |
| D | 12 | 233 | 648852 | 5192.17 | 507 | 491 | 124.9 |
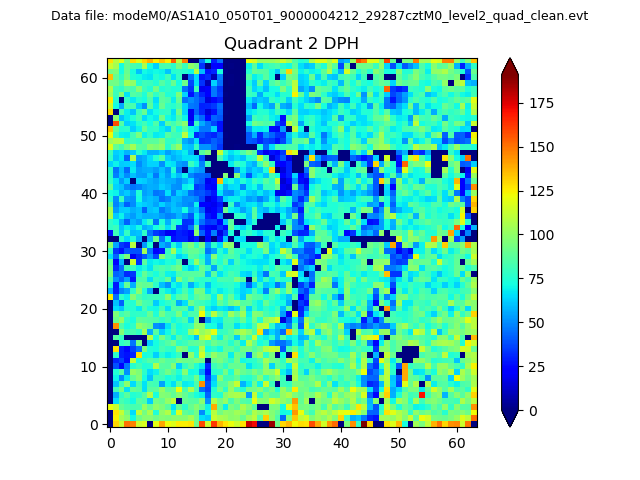
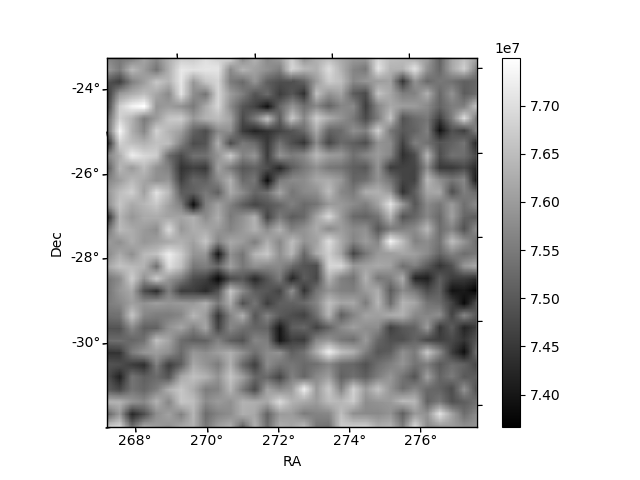
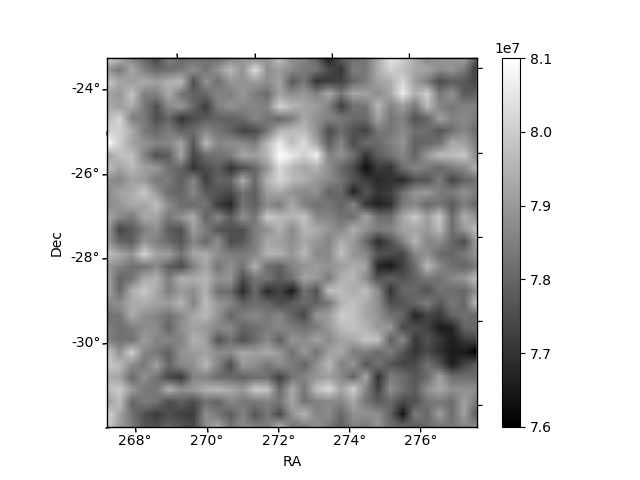
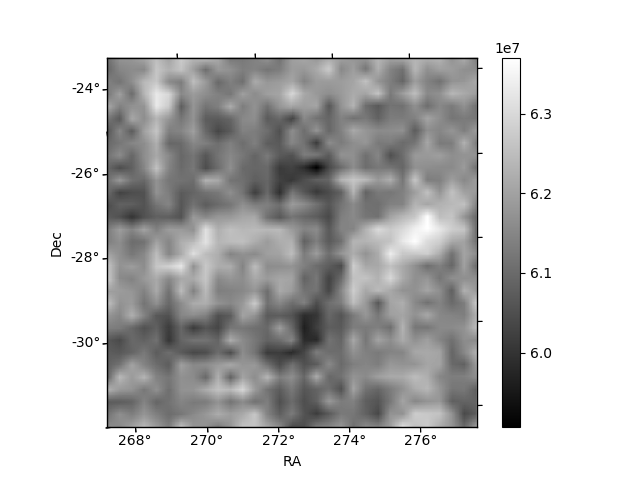
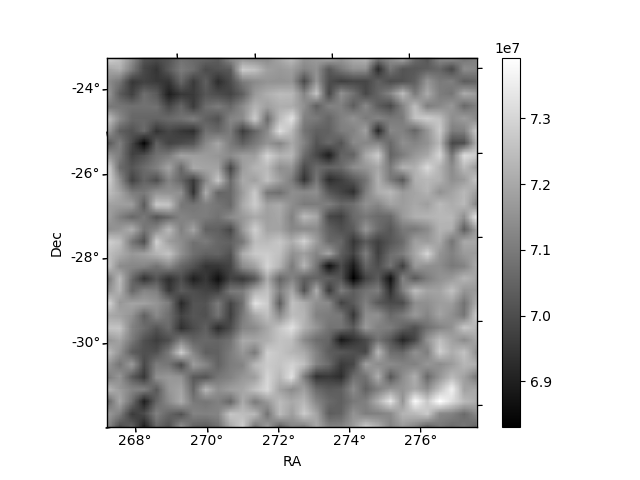
Histogram calculated using DETX and DETY for each event in the final _common_clean file
| Quadrant A | 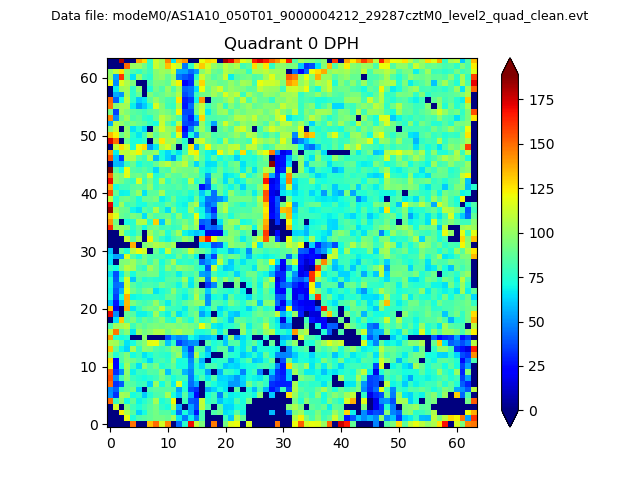 |
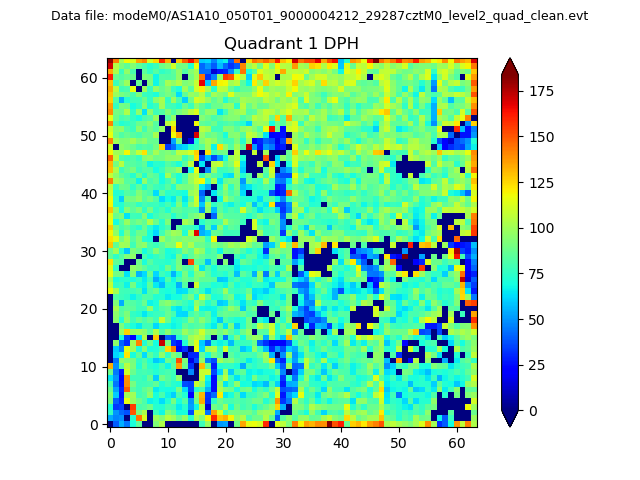 |
Quadrant B |
|---|---|---|---|
| Quadrant D | 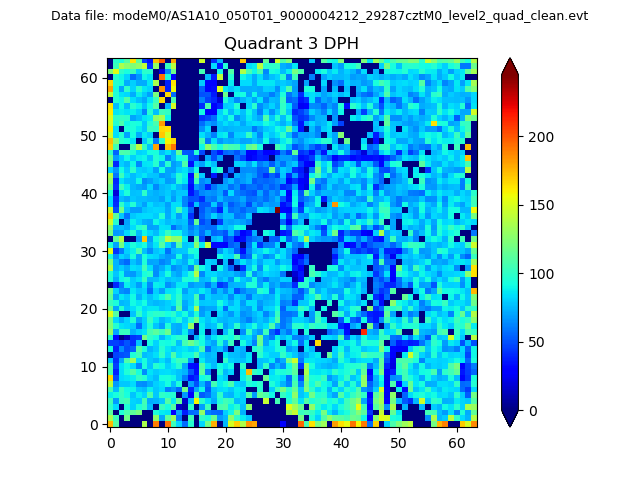 |
 |
Quadrant C |
| Plot type | Count rate plots | Images |
|---|---|---|
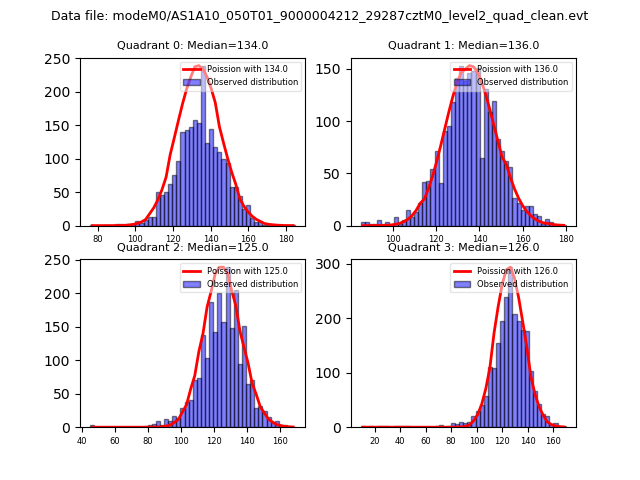
| Comparison with Poisson distribution Blue bars denote a histogram of data divided into 1 sec bins. Red curve is a Poisson curve with rate = median count rate of data. |
 |
 |
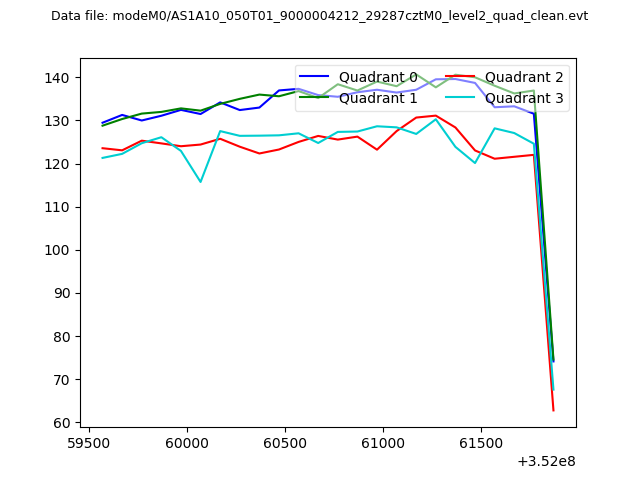
| Quadrant-wise count rates Data is divided into 100 sec bins |
 |
|
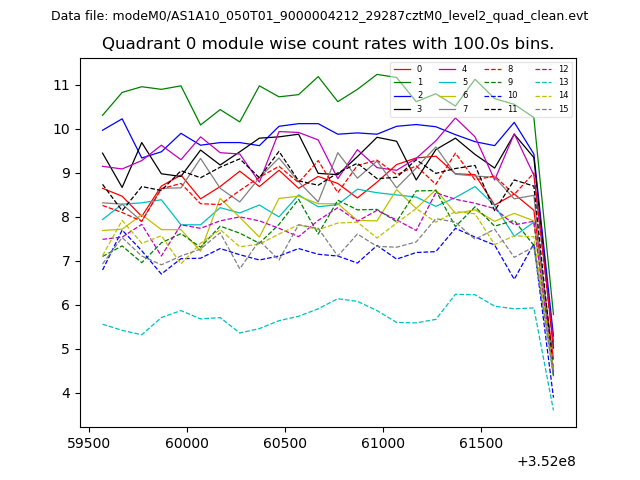
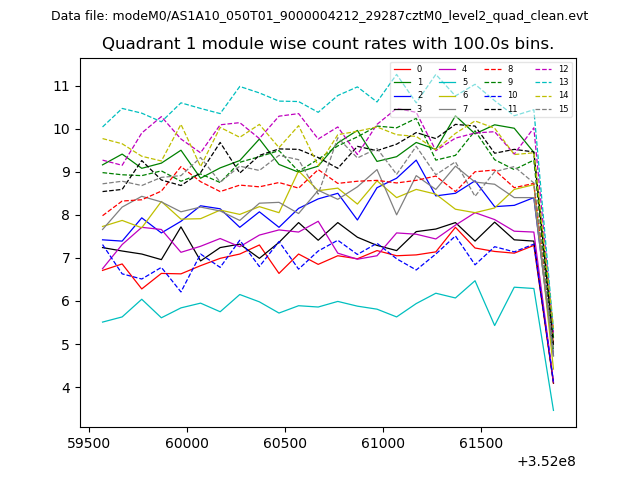
| Module-wise count rates for Quadrant A Data is divided into 100 sec bins |
 |
 |
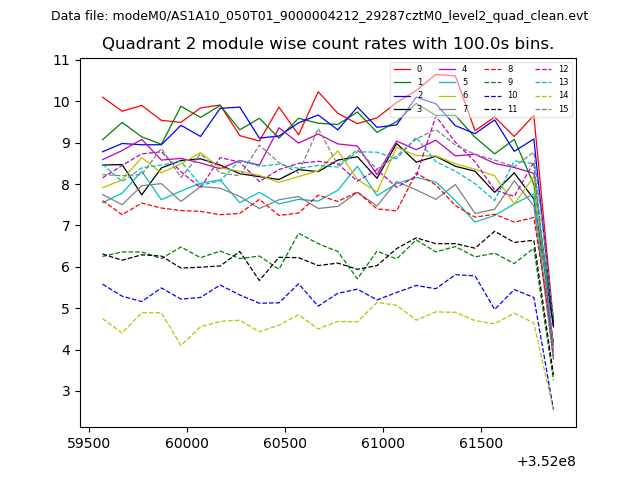
| Module-wise count rates for Quadrant B Data is divided into 100 sec bins |
 |
 |
| Module-wise count rates for Quadrant C Data is divided into 100 sec bins |
 |
 |
| Module-wise count rates for Quadrant D Data is divided into 100 sec bins |
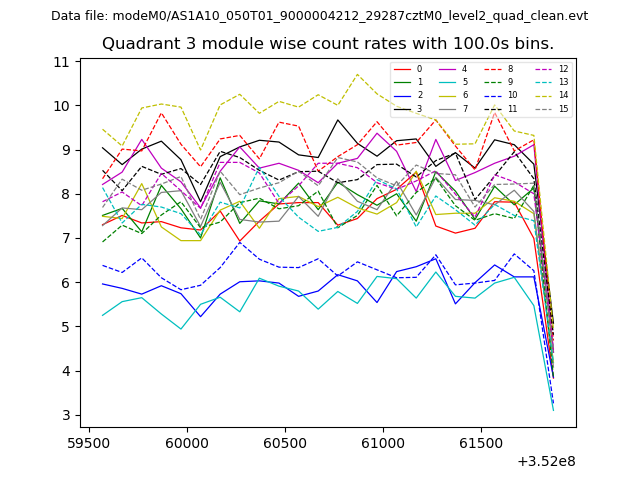 |
 |
| Parameter | Plot |
|---|---|
| CZT HV Monitor | 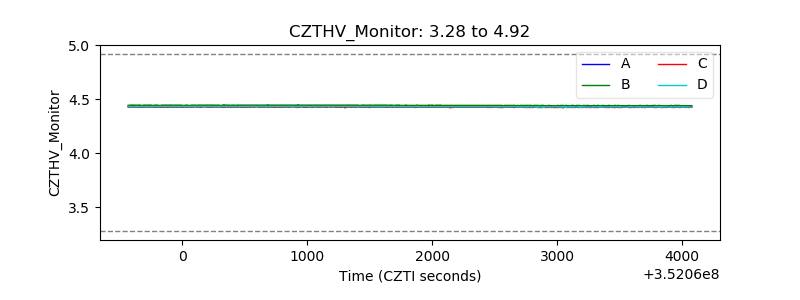 |
| D_VDD | 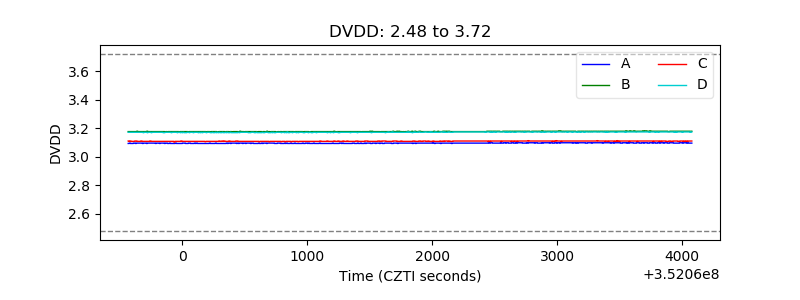 |
| Temperature 1 | 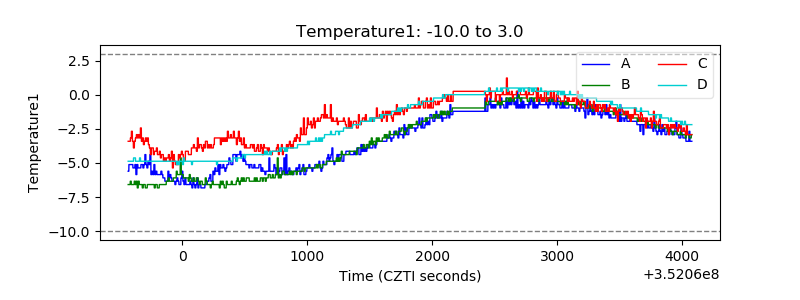 |
| Veto HV Monitor | 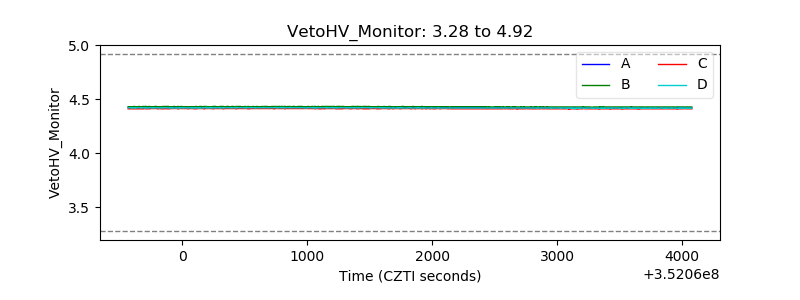 |
| Veto LLD | 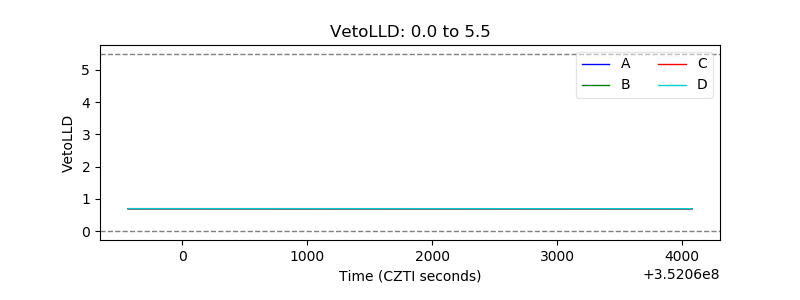 |
| Alpha Counter | 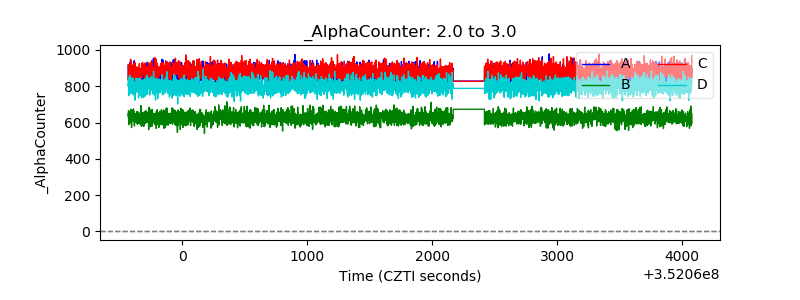 |
| _CPM_Rate | 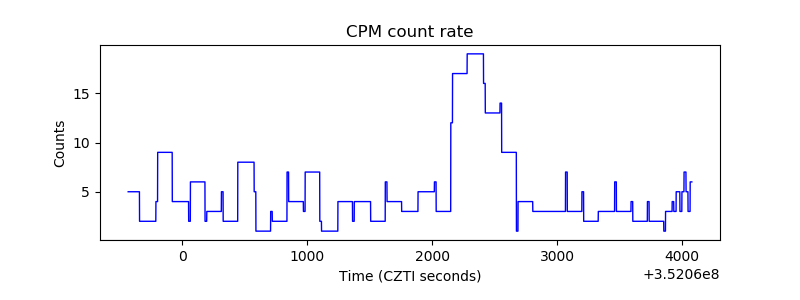 |
| CZT Counter | 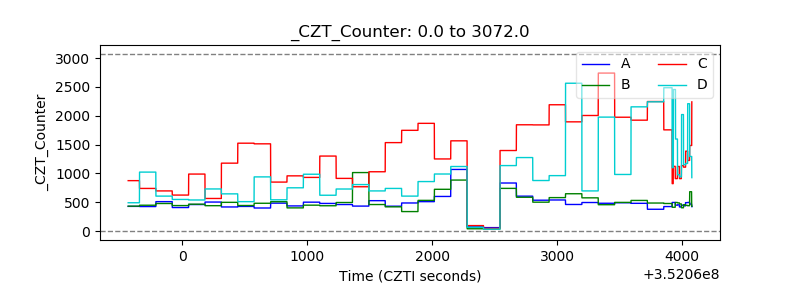 |
| +2.5 Volts monitor |  |
| +5 Volts monitor |  |
| _ROLL_ROT | 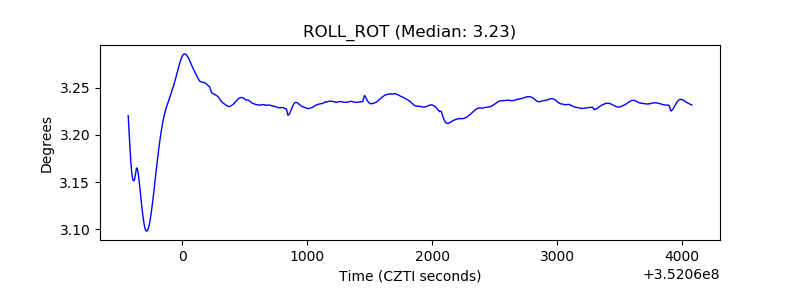 |
| _Roll_DEC | 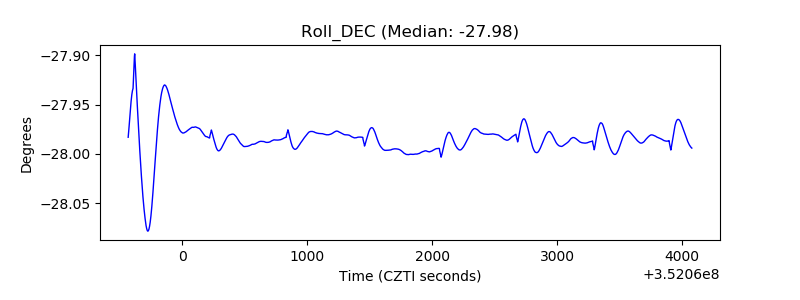 |
| _Roll_RA | 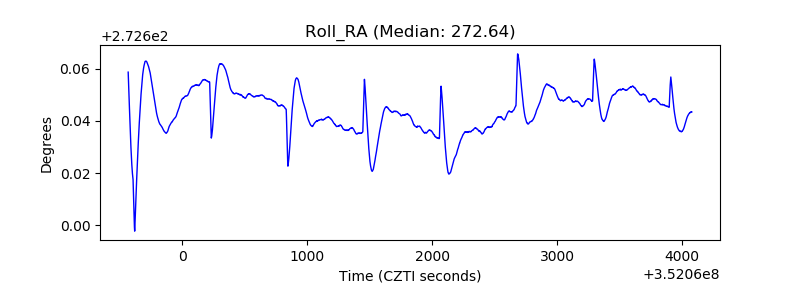 |
| Veto Counter |  |