| Param | Original file | Final file |
|---|---|---|
| Filename | modeM0/AS1A10_050T01_9000004212_29288cztM0_level2.evt | modeM0/AS1A10_050T01_9000004212_29288cztM0_level2_quad_clean.evt |
| Size (bytes) | 877,204,800 | 82,215,360 |
| Size | 836.6 MB | 78.4 MB |
| Events in quadrant A | 3,419,435 | 520,982 |
| Events in quadrant B | 3,903,618 | 520,657 |
| Events in quadrant C | 9,725,068 | 480,738 |
| Events in quadrant D | 9,038,011 | 471,087 |
| Mode M9 | |||
|---|---|---|---|
| Quadrant | BADHDUFLAG | Total packets | Discarded packets |
| A | 0 | 2 | 0 |
| B | 0 | 2 | 0 |
| C | 0 | 2 | 0 |
| D | 0 | 2 | 0 |
| Mode M0 | |||
|---|---|---|---|
| Quadrant | BADHDUFLAG | Total packets | Discarded packets |
| A | 0 | 14715 | 2 |
| B | 0 | 16195 | 2 |
| C | 0 | 33934 | 2 |
| D | 0 | 31771 | 2 |
| Mode SS | |||
|---|---|---|---|
| Quadrant | BADHDUFLAG | Total packets | Discarded packets |
| A | 0 | 146 | 0 |
| B | 0 | 146 | 0 |
| C | 0 | 146 | 0 |
| D | 0 | 146 | 0 |
| Quadrant | Total seconds | Saturated seconds | Saturation percentage |
|---|---|---|---|
| A | 7114 | 116 | 1.630588% |
| B | 7114 | 294 | 4.132696% |
| C | 7114 | 2337 | 32.850717% |
| D | 7114 | 1577 | 22.167557% |
Noise dominated data is calculated using 1-second bins in cleaned event files. If a bin has >2000 counts, and if more than 50% of those come from <1% of pixels, then it is considered to be noise-dominated and hence unusable.
| Quadrant | # 1 sec bins | Bins with >0 counts | Bins with >2000 counts | High rate bins dominated by noise | Noise dominated (total time) | Noise dominated (detector-on time) | Marked lightcurve |
|---|---|---|---|---|---|---|---|
| A | 7354 | 7117 | 4 | 4 | 0.05% | 0.06% | 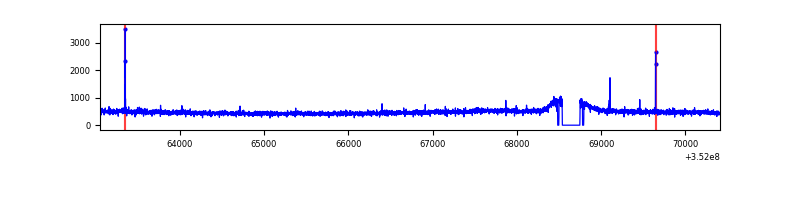 |
| B | 7354 | 7117 | 74 | 74 | 1.01% | 1.04% | 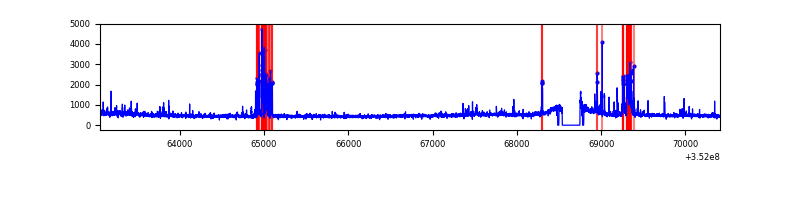 |
| C | 7354 | 7117 | 1173 | 1173 | 15.95% | 16.48% | 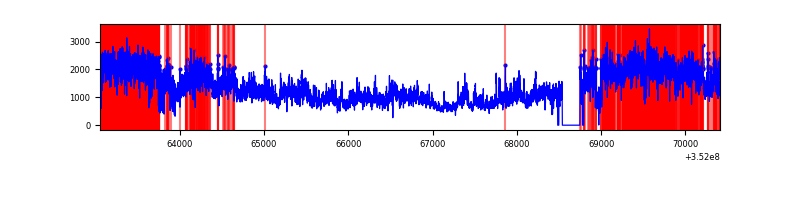 |
| D | 7354 | 7116 | 1169 | 1169 | 15.90% | 16.43% | 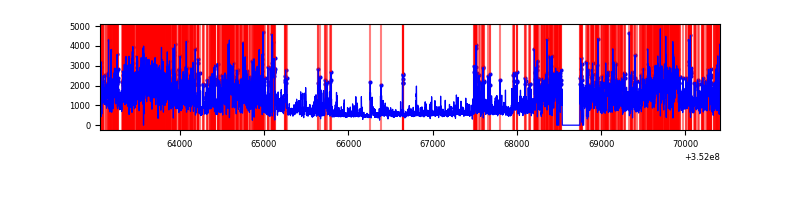 |
Top three noisy pixels from each quadrant. If the there are fewer than three noisy pixels in the level2.evt file, extra rows are filled as -1
| Pixel properties | Quadrant properties | ||||||
|---|---|---|---|---|---|---|---|
| Quadrant | DetID | PixID | Counts | Sigma | Mean | Median | Sigma |
| A | 13 | 254 | 14269 | 75.36 | 879 | 859 | 177.9 |
| A | 15 | 174 | 12559 | 65.75 | 879 | 859 | 177.9 |
| A | 14 | 31 | 9282 | 47.33 | 879 | 859 | 177.9 |
| B | 10 | 245 | 223824 | 1343.76 | 865 | 843 | 165.9 |
| B | 5 | 172 | 161937 | 970.81 | 865 | 843 | 165.9 |
| B | 0 | 230 | 52289 | 310.03 | 865 | 843 | 165.9 |
| C | 3 | 233 | 6491960 | 36725.35 | 752 | 759 | 176.7 |
| C | 14 | 238 | 179643 | 1012.07 | 752 | 759 | 176.7 |
| C | 14 | 254 | 100357 | 563.5 | 752 | 759 | 176.7 |
| D | 1 | 52 | 2224511 | 11602.33 | 786 | 764 | 191.7 |
| D | 8 | 195 | 1904234 | 9931.3 | 786 | 764 | 191.7 |
| D | 12 | 233 | 866026 | 4514.48 | 786 | 764 | 191.7 |
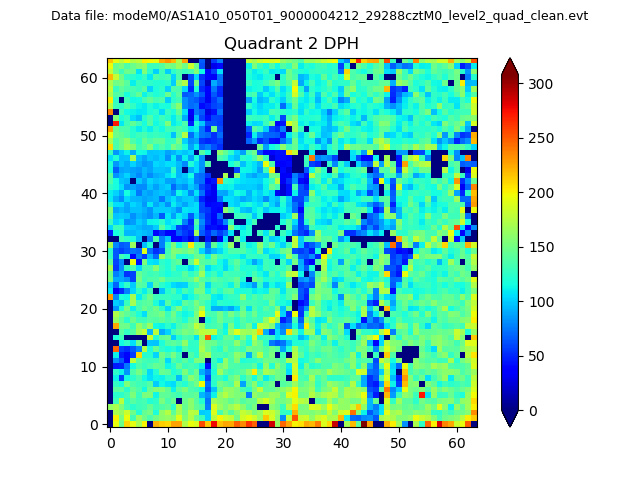
Histogram calculated using DETX and DETY for each event in the final _common_clean file
| Quadrant A | 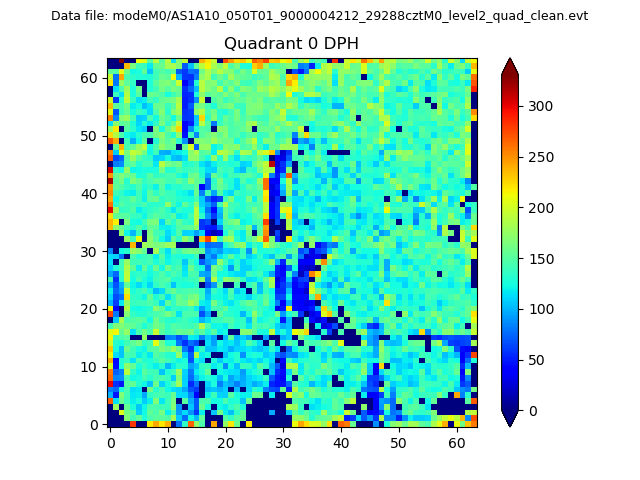 |
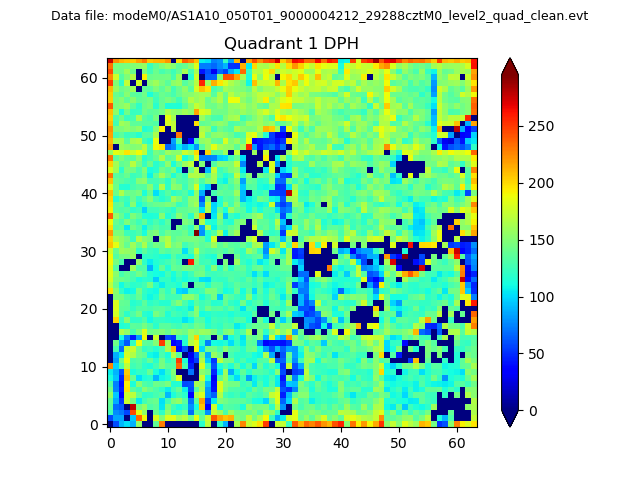 |
Quadrant B |
|---|---|---|---|
| Quadrant D | 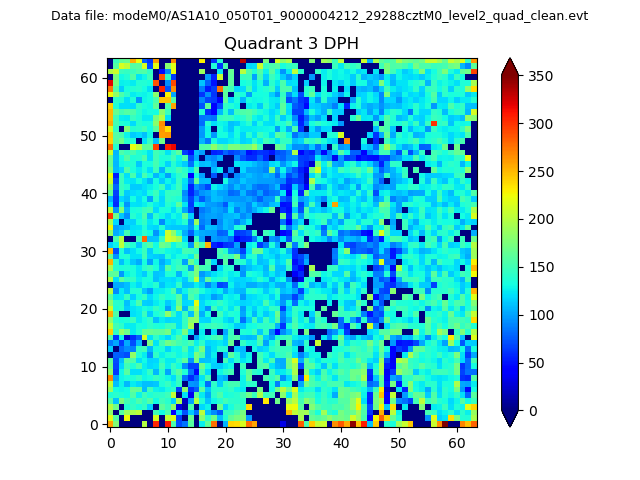 |
 |
Quadrant C |
| Plot type | Count rate plots | Images |
|---|---|---|
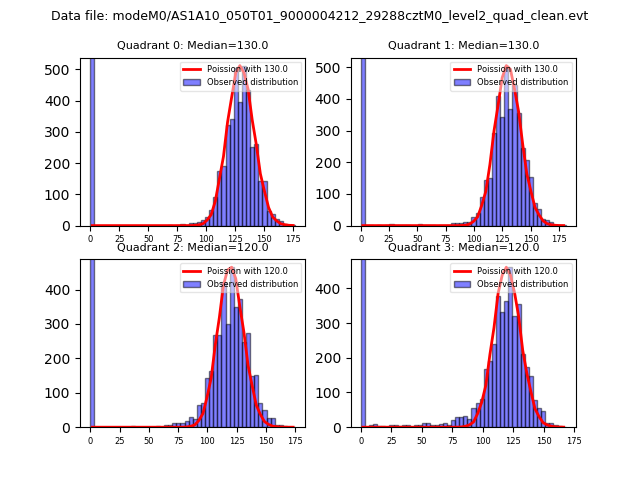
| Comparison with Poisson distribution Blue bars denote a histogram of data divided into 1 sec bins. Red curve is a Poisson curve with rate = median count rate of data. |
 |
 |
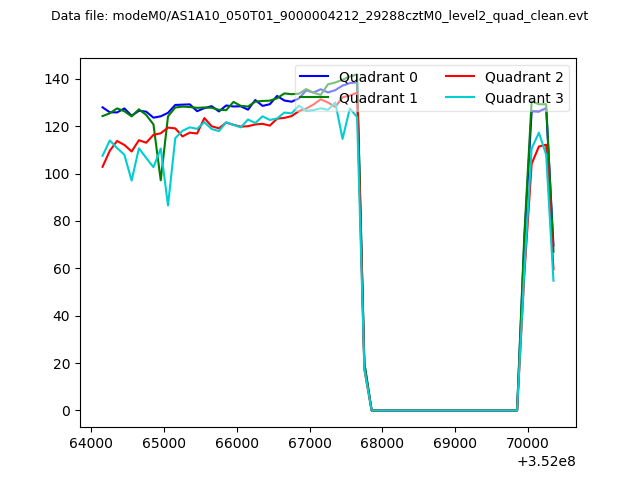
| Quadrant-wise count rates Data is divided into 100 sec bins |
 |
|
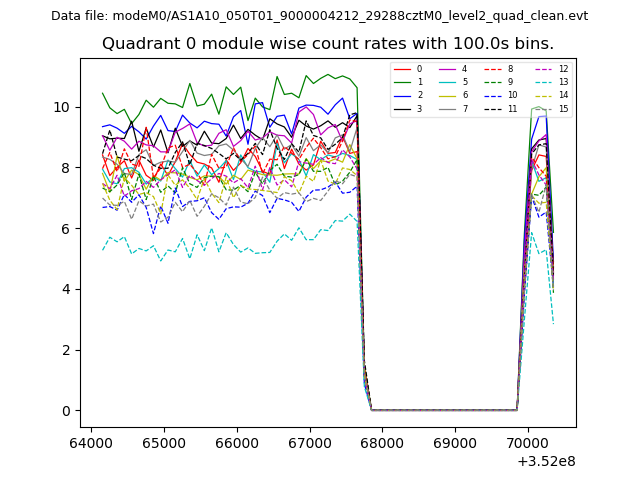
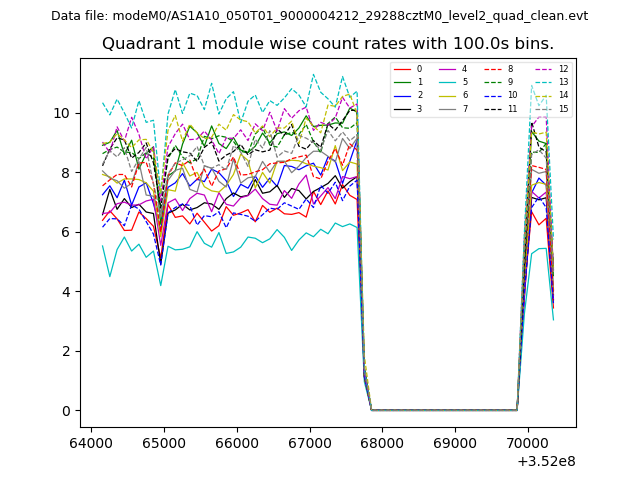
| Module-wise count rates for Quadrant A Data is divided into 100 sec bins |
 |
 |
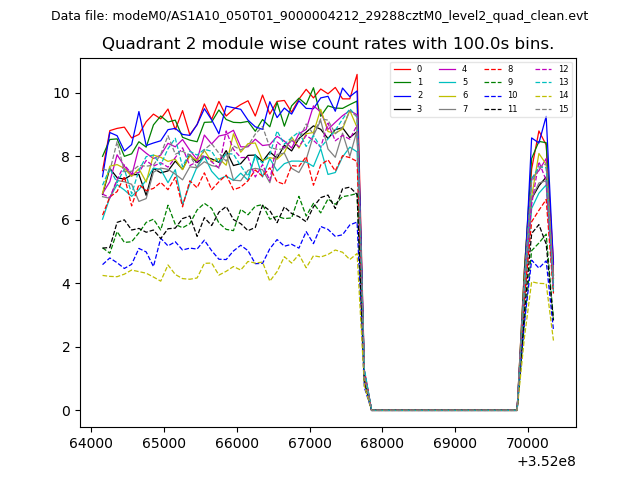
| Module-wise count rates for Quadrant B Data is divided into 100 sec bins |
 |
 |
| Module-wise count rates for Quadrant C Data is divided into 100 sec bins |
 |
 |
| Module-wise count rates for Quadrant D Data is divided into 100 sec bins |
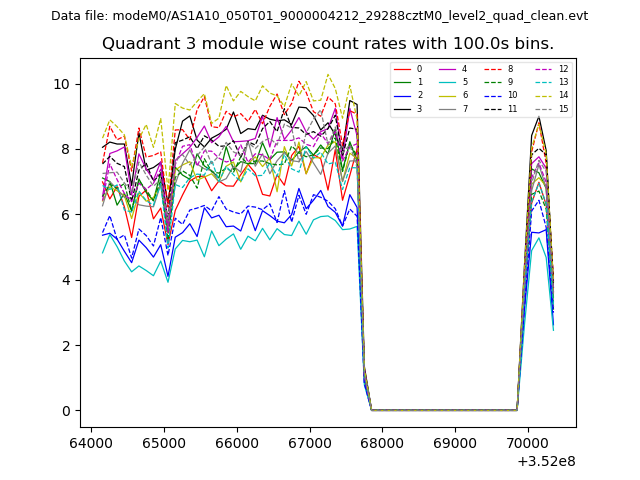 |
 |
| Parameter | Plot |
|---|---|
| CZT HV Monitor | 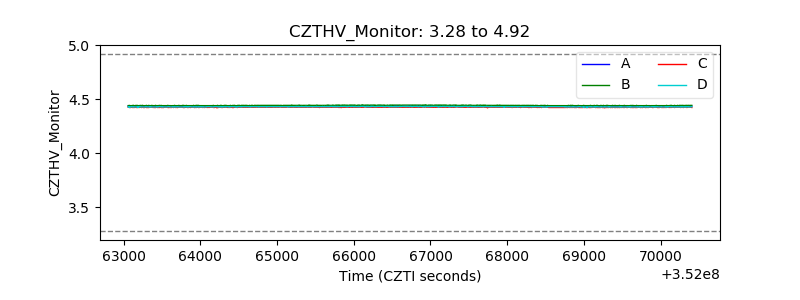 |
| D_VDD | 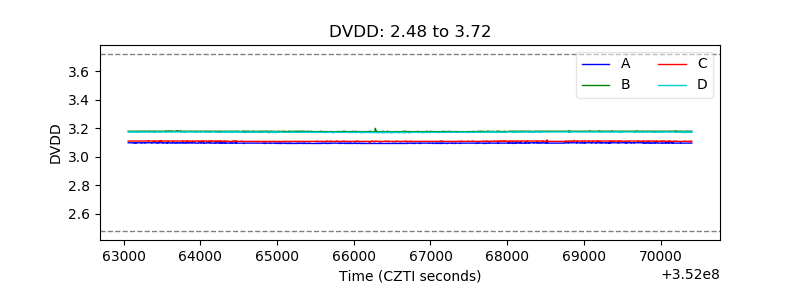 |
| Temperature 1 | 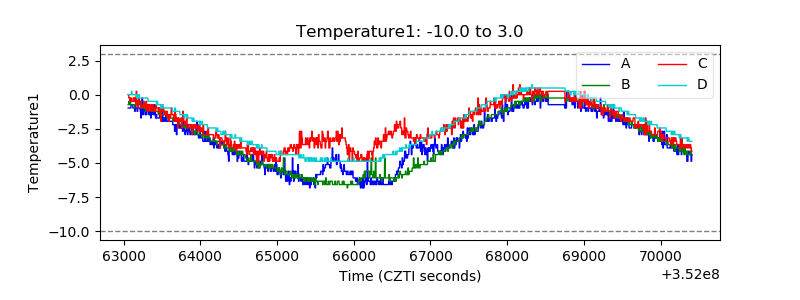 |
| Veto HV Monitor |  |
| Veto LLD | 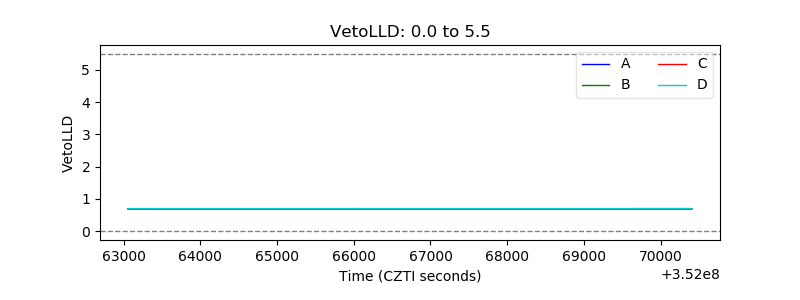 |
| Alpha Counter | 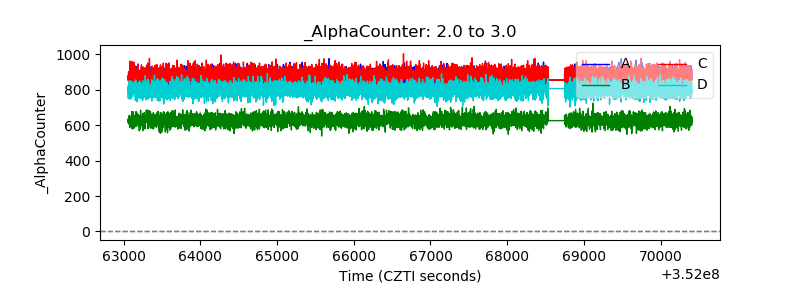 |
| _CPM_Rate | 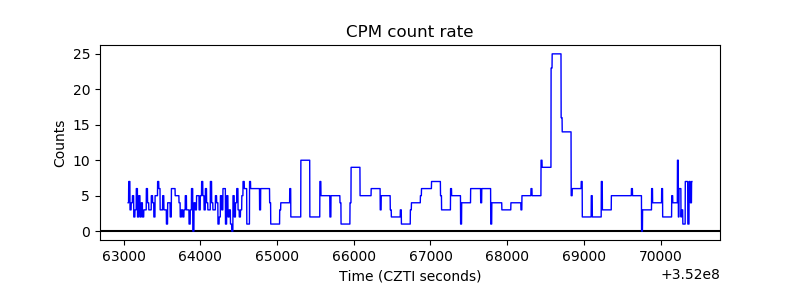 |
| CZT Counter | 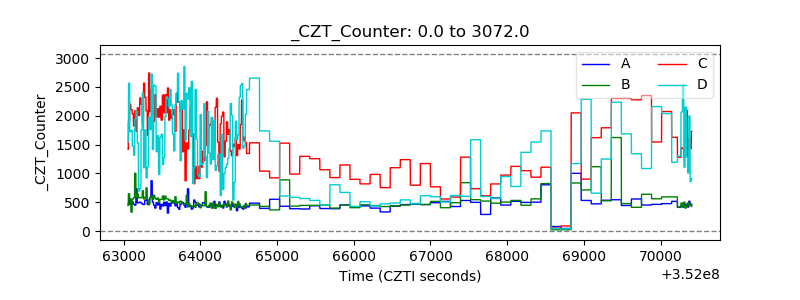 |
| +2.5 Volts monitor |  |
| +5 Volts monitor | 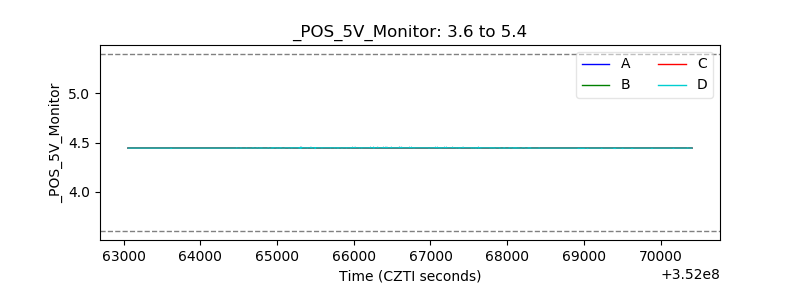 |
| _ROLL_ROT |  |
| _Roll_DEC | 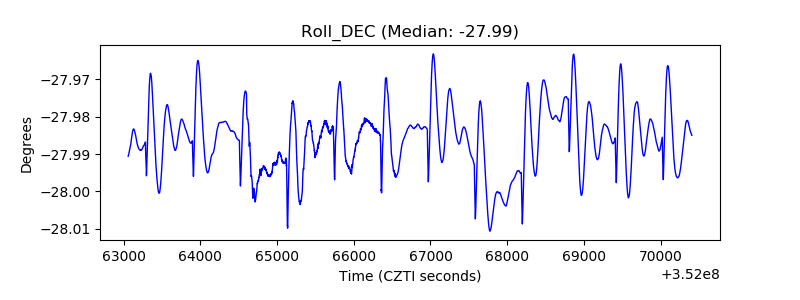 |
| _Roll_RA | 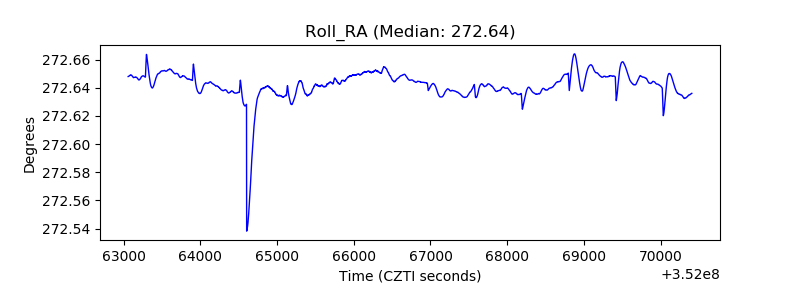 |
| Veto Counter |  |