| Param | Original file | Final file |
|---|---|---|
| Filename | modeM0/AS1A10_050T01_9000004212_29291cztM0_level2.evt | modeM0/AS1A10_050T01_9000004212_29291cztM0_level2_quad_clean.evt |
| Size (bytes) | 948,032,640 | 95,022,720 |
| Size | 904.1 MB | 90.6 MB |
| Events in quadrant A | 3,407,417 | 631,866 |
| Events in quadrant B | 3,602,854 | 632,830 |
| Events in quadrant C | 9,920,768 | 574,981 |
| Events in quadrant D | 11,291,174 | 530,915 |
| Mode M9 | |||
|---|---|---|---|
| Quadrant | BADHDUFLAG | Total packets | Discarded packets |
| A | 0 | 4 | 0 |
| B | 0 | 4 | 0 |
| C | 0 | 4 | 0 |
| D | 0 | 4 | 0 |
| Mode M0 | |||
|---|---|---|---|
| Quadrant | BADHDUFLAG | Total packets | Discarded packets |
| A | 0 | 14890 | 2 |
| B | 0 | 15382 | 2 |
| C | 0 | 34614 | 2 |
| D | 0 | 38644 | 2 |
| Mode SS | |||
|---|---|---|---|
| Quadrant | BADHDUFLAG | Total packets | Discarded packets |
| A | 0 | 150 | 0 |
| B | 0 | 150 | 0 |
| C | 0 | 150 | 0 |
| D | 0 | 150 | 0 |
| Quadrant | Total seconds | Saturated seconds | Saturation percentage |
|---|---|---|---|
| A | 7261 | 48 | 0.661066% |
| B | 7261 | 82 | 1.129321% |
| C | 7261 | 1900 | 26.167195% |
| D | 7261 | 2137 | 29.431208% |
Noise dominated data is calculated using 1-second bins in cleaned event files. If a bin has >2000 counts, and if more than 50% of those come from <1% of pixels, then it is considered to be noise-dominated and hence unusable.
| Quadrant | # 1 sec bins | Bins with >0 counts | Bins with >2000 counts | High rate bins dominated by noise | Noise dominated (total time) | Noise dominated (detector-on time) | Marked lightcurve |
|---|---|---|---|---|---|---|---|
| A | 7726 | 7263 | 5 | 5 | 0.06% | 0.07% | 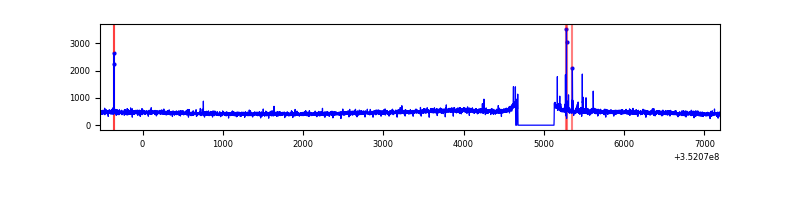 |
| B | 7726 | 7263 | 10 | 10 | 0.13% | 0.14% | 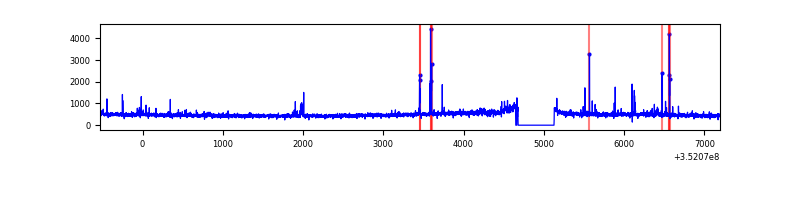 |
| C | 7726 | 7263 | 798 | 798 | 10.33% | 10.99% | 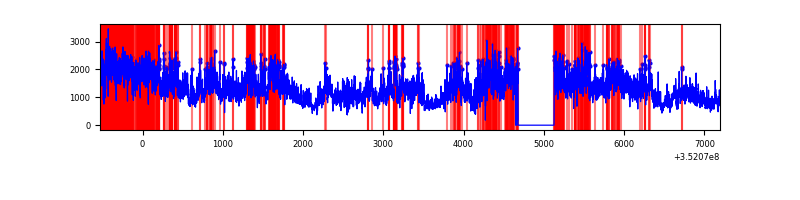 |
| D | 7726 | 7263 | 1865 | 1865 | 24.14% | 25.68% | 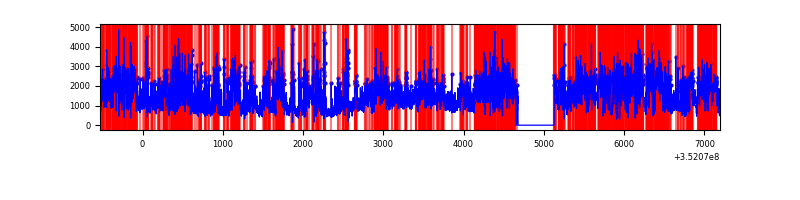 |
Top three noisy pixels from each quadrant. If the there are fewer than three noisy pixels in the level2.evt file, extra rows are filled as -1
| Pixel properties | Quadrant properties | ||||||
|---|---|---|---|---|---|---|---|
| Quadrant | DetID | PixID | Counts | Sigma | Mean | Median | Sigma |
| A | 12 | 96 | 33502 | 184.05 | 872 | 853 | 177.4 |
| A | 13 | 254 | 15573 | 82.98 | 872 | 853 | 177.4 |
| A | 14 | 31 | 8249 | 41.69 | 872 | 853 | 177.4 |
| B | 0 | 230 | 53391 | 318.19 | 868 | 849 | 165.1 |
| B | 10 | 245 | 36372 | 215.12 | 868 | 849 | 165.1 |
| B | 10 | 247 | 34372 | 203.01 | 868 | 849 | 165.1 |
| C | 3 | 233 | 6565285 | 35710.73 | 779 | 784 | 183.8 |
| C | 14 | 238 | 191866 | 1039.48 | 779 | 784 | 183.8 |
| C | 14 | 254 | 105869 | 571.66 | 779 | 784 | 183.8 |
| D | 1 | 52 | 5746934 | 30757.87 | 768 | 747 | 186.8 |
| D | 8 | 195 | 1602478 | 8573.66 | 768 | 747 | 186.8 |
| D | 7 | 69 | 375312 | 2004.95 | 768 | 747 | 186.8 |
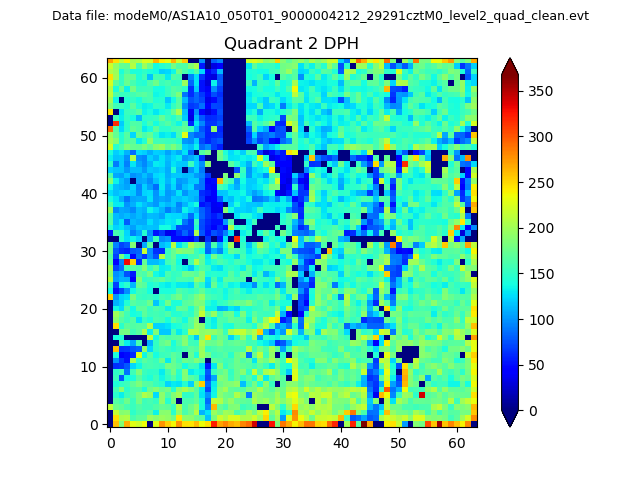
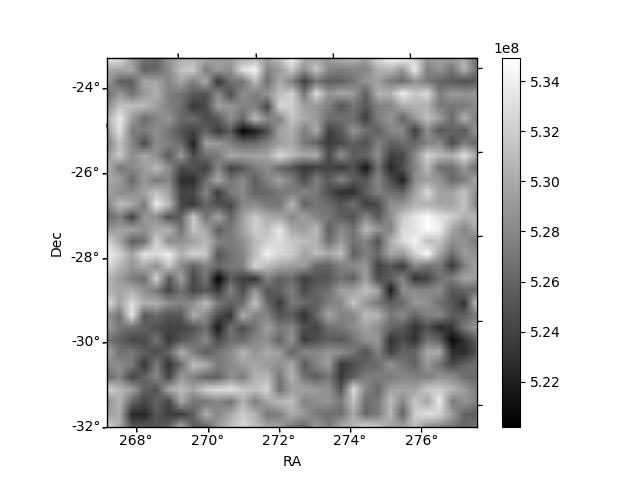
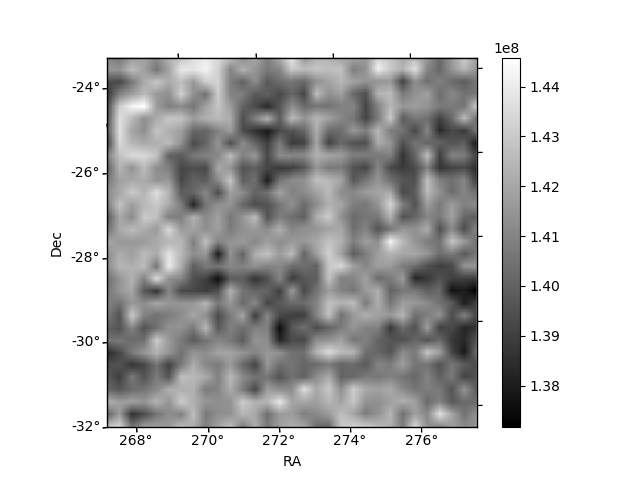
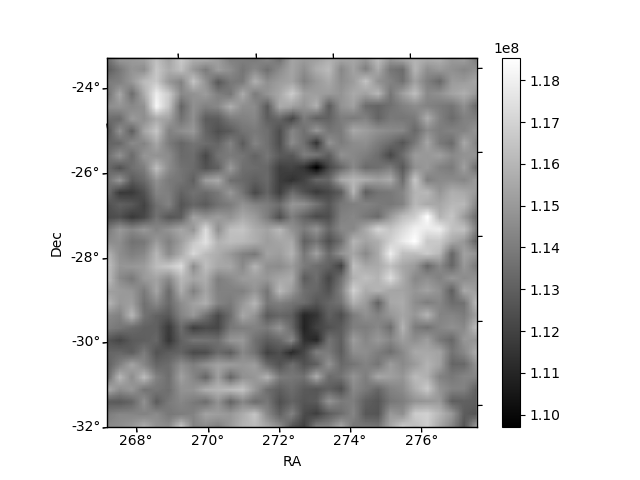
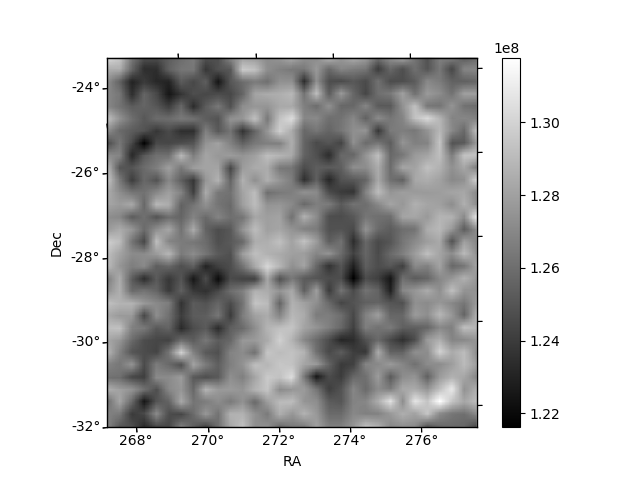
Histogram calculated using DETX and DETY for each event in the final _common_clean file
| Quadrant A | 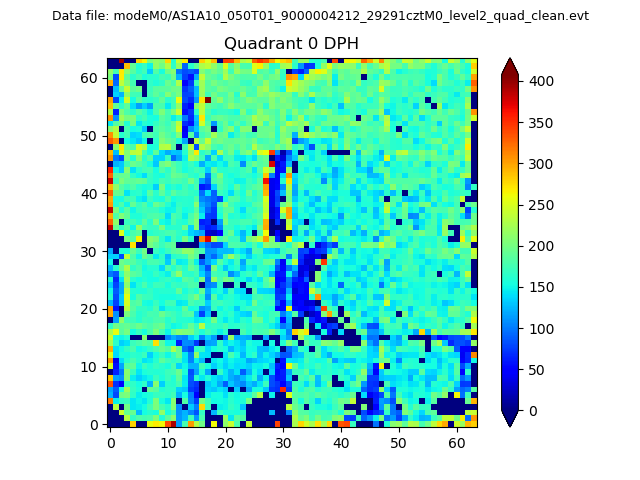 |
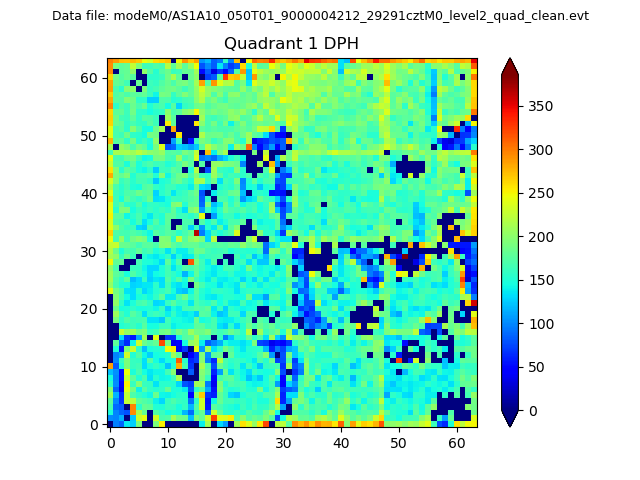 |
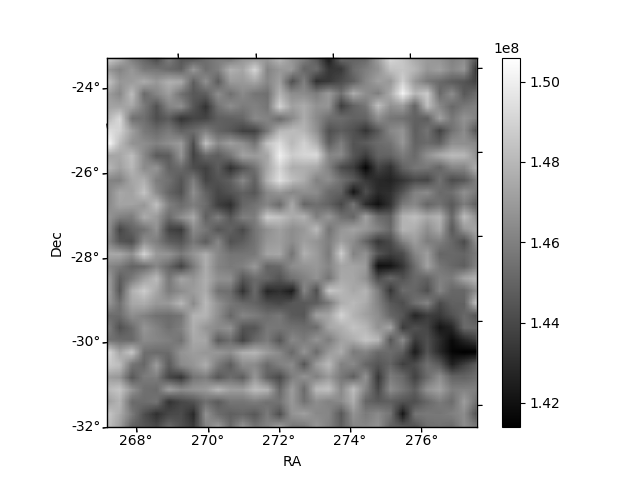
Quadrant B |
|---|---|---|---|
| Quadrant D | 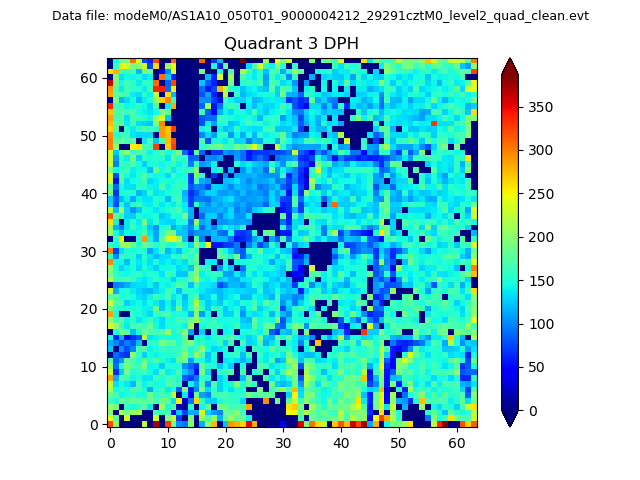 |
 |
Quadrant C |
| Plot type | Count rate plots | Images |
|---|---|---|
| Comparison with Poisson distribution Blue bars denote a histogram of data divided into 1 sec bins. Red curve is a Poisson curve with rate = median count rate of data. |
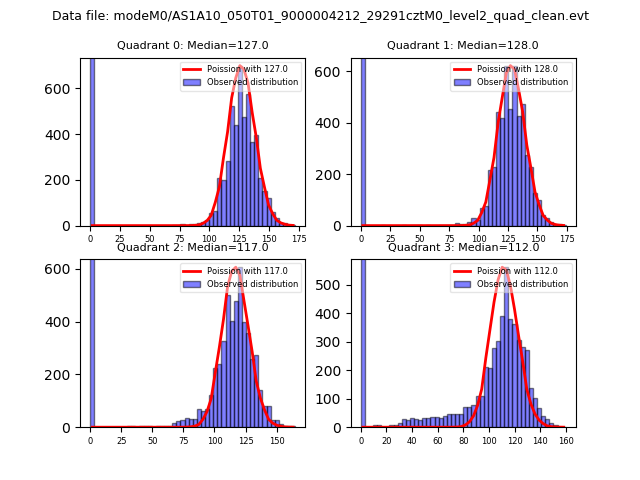 |
 |
| Quadrant-wise count rates Data is divided into 100 sec bins |
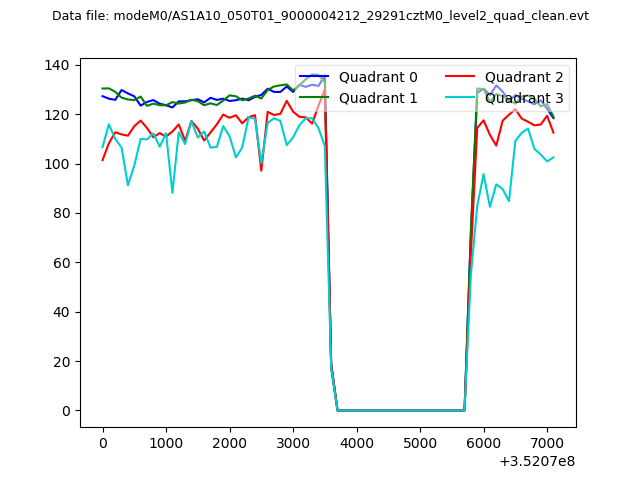 |
|
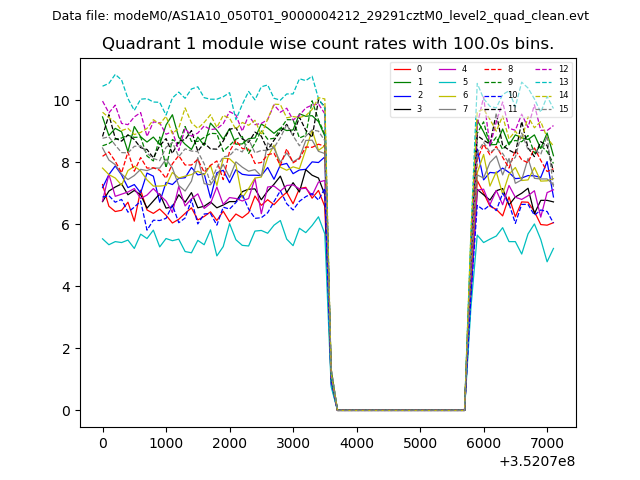
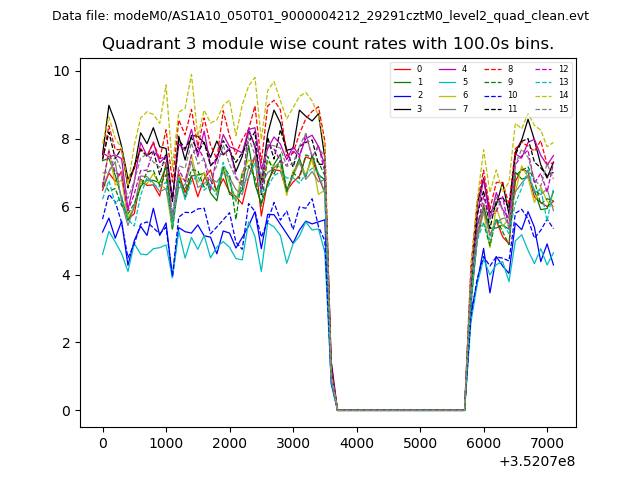
| Module-wise count rates for Quadrant A Data is divided into 100 sec bins |
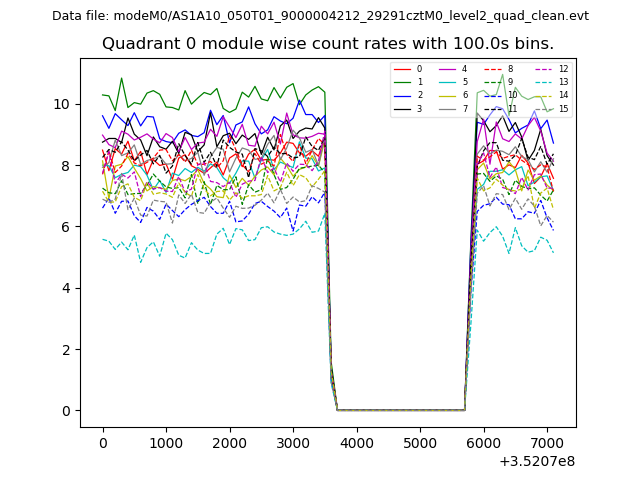 |
 |
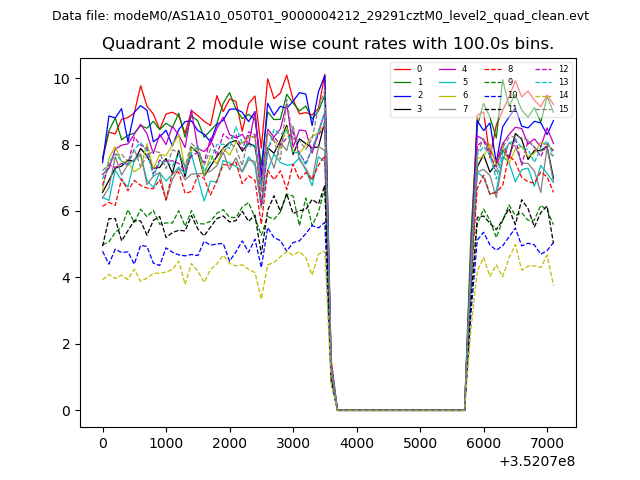
| Module-wise count rates for Quadrant B Data is divided into 100 sec bins |
 |
 |
| Module-wise count rates for Quadrant C Data is divided into 100 sec bins |
 |
 |
| Module-wise count rates for Quadrant D Data is divided into 100 sec bins |
 |
 |
| Parameter | Plot |
|---|---|
| CZT HV Monitor | 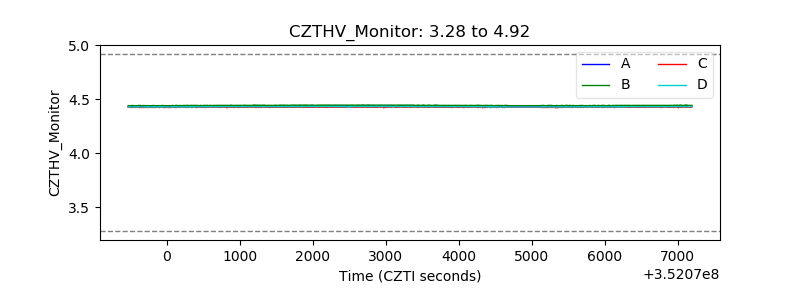 |
| D_VDD |  |
| Temperature 1 | 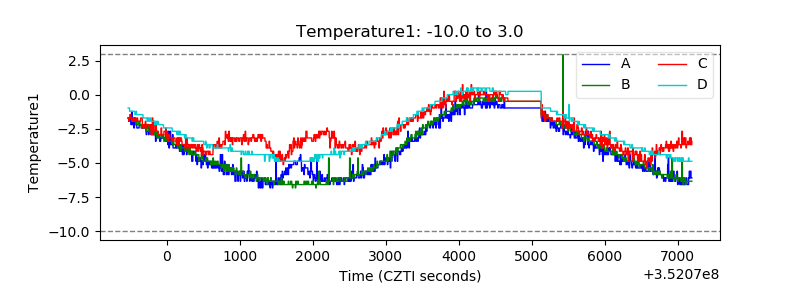 |
| Veto HV Monitor | 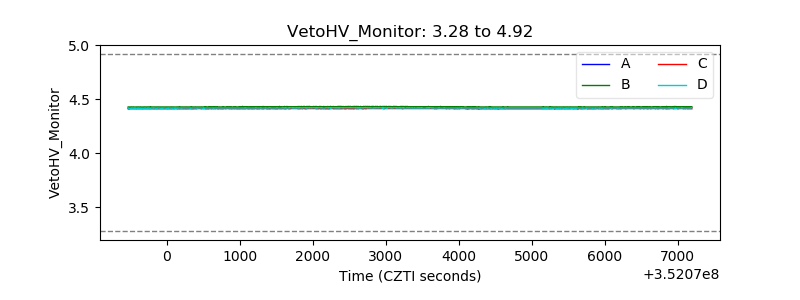 |
| Veto LLD | 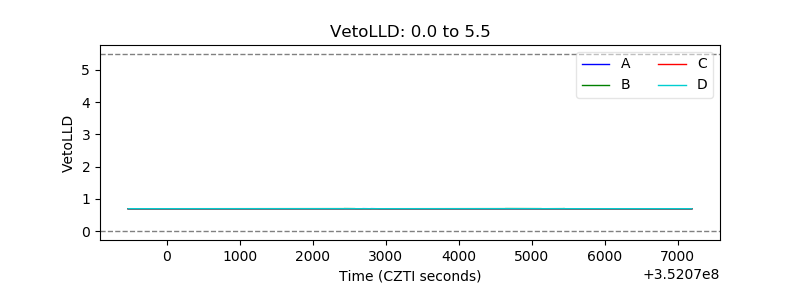 |
| Alpha Counter | 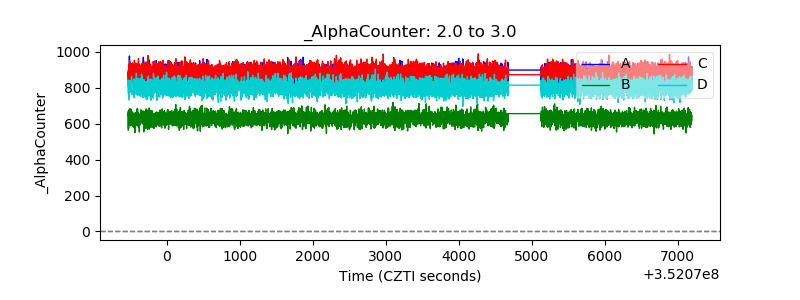 |
| _CPM_Rate | 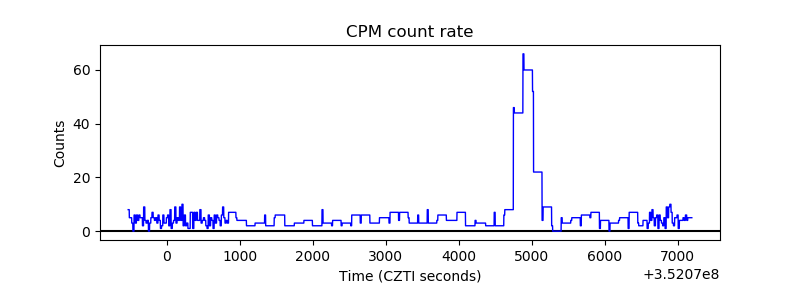 |
| CZT Counter | 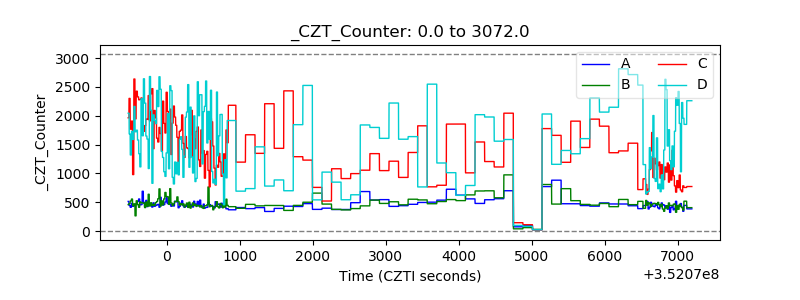 |
| +2.5 Volts monitor |  |
| +5 Volts monitor |  |
| _ROLL_ROT | 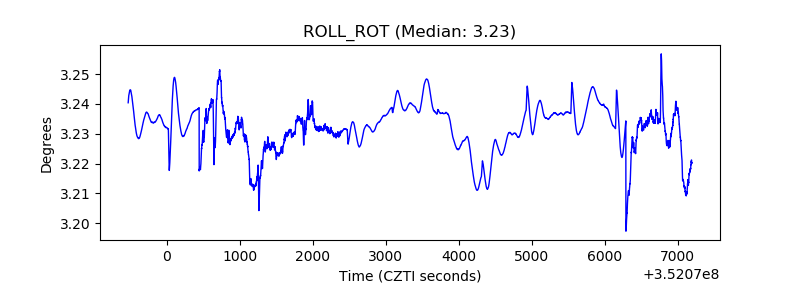 |
| _Roll_DEC | 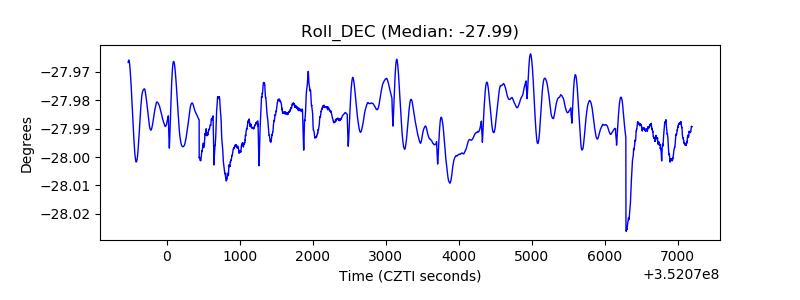 |
| _Roll_RA | 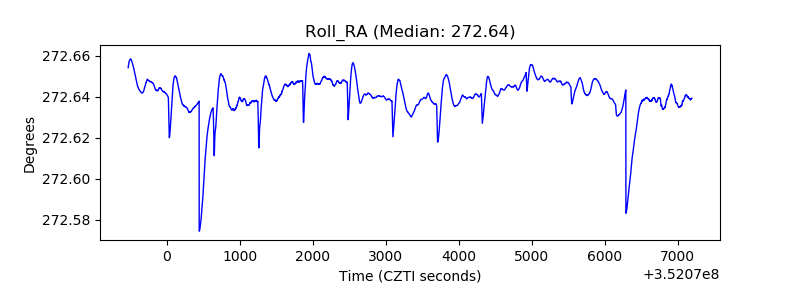 |
| Veto Counter | 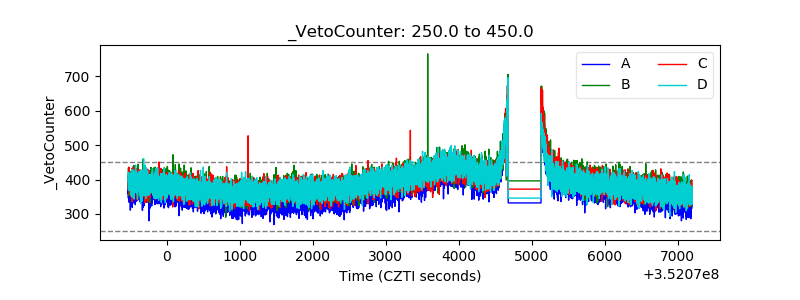 |