| Param | Original file | Final file |
|---|---|---|
| Filename | modeM0/AS1A10_050T01_9000004212_29292cztM0_level2.evt | modeM0/AS1A10_050T01_9000004212_29292cztM0_level2_quad_clean.evt |
| Size (bytes) | 1,571,077,440 | 165,435,840 |
| Size | 1.5 GB | 157.8 MB |
| Events in quadrant A | 5,592,489 | 1,113,503 |
| Events in quadrant B | 5,887,370 | 1,130,268 |
| Events in quadrant C | 19,747,795 | 945,661 |
| Events in quadrant D | 15,542,101 | 984,899 |
| Mode M9 | |||
|---|---|---|---|
| Quadrant | BADHDUFLAG | Total packets | Discarded packets |
| A | 0 | 14 | 0 |
| B | 0 | 14 | 0 |
| C | 0 | 14 | 0 |
| D | 0 | 14 | 0 |
| Mode M0 | |||
|---|---|---|---|
| Quadrant | BADHDUFLAG | Total packets | Discarded packets |
| A | 0 | 24654 | 2 |
| B | 0 | 25456 | 2 |
| C | 0 | 67088 | 2 |
| D | 0 | 54574 | 2 |
| Mode SS | |||
|---|---|---|---|
| Quadrant | BADHDUFLAG | Total packets | Discarded packets |
| A | 0 | 246 | 0 |
| B | 0 | 246 | 0 |
| C | 0 | 246 | 0 |
| D | 0 | 246 | 0 |
| Quadrant | Total seconds | Saturated seconds | Saturation percentage |
|---|---|---|---|
| A | 12064 | 33 | 0.273541% |
| B | 12064 | 107 | 0.886936% |
| C | 12065 | 5420 | 44.923332% |
| D | 12065 | 2714 | 22.494820% |
Noise dominated data is calculated using 1-second bins in cleaned event files. If a bin has >2000 counts, and if more than 50% of those come from <1% of pixels, then it is considered to be noise-dominated and hence unusable.
| Quadrant | # 1 sec bins | Bins with >0 counts | Bins with >2000 counts | High rate bins dominated by noise | Noise dominated (total time) | Noise dominated (detector-on time) | Marked lightcurve |
|---|---|---|---|---|---|---|---|
| A | 13479 | 12066 | 3 | 3 | 0.02% | 0.02% | 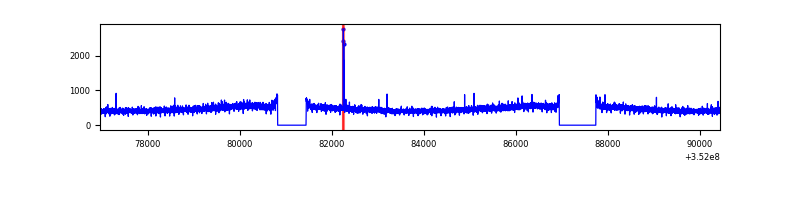 |
| B | 13479 | 12066 | 19 | 19 | 0.14% | 0.16% | 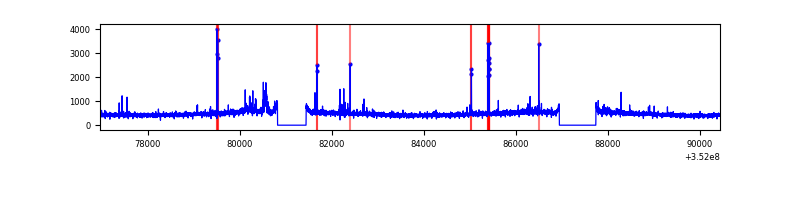 |
| C | 13480 | 12066 | 3273 | 3273 | 24.28% | 27.13% | 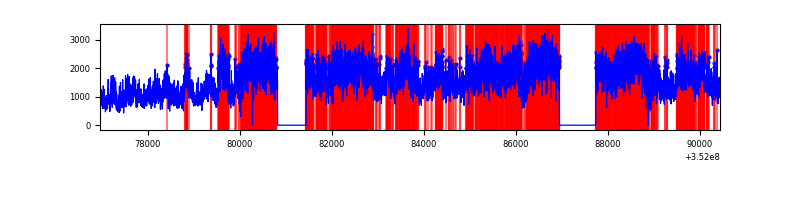 |
| D | 13480 | 12066 | 2464 | 2464 | 18.28% | 20.42% |  |
Top three noisy pixels from each quadrant. If the there are fewer than three noisy pixels in the level2.evt file, extra rows are filled as -1
| Pixel properties | Quadrant properties | ||||||
|---|---|---|---|---|---|---|---|
| Quadrant | DetID | PixID | Counts | Sigma | Mean | Median | Sigma |
| A | 13 | 254 | 25431 | 81.92 | 1445 | 1413 | 293.2 |
| A | 3 | 137 | 13898 | 42.58 | 1445 | 1413 | 293.2 |
| A | 0 | 226 | 12073 | 36.36 | 1445 | 1413 | 293.2 |
| B | 0 | 190 | 91650 | 330.39 | 1437 | 1403 | 273.2 |
| B | 4 | 171 | 54221 | 193.36 | 1437 | 1403 | 273.2 |
| B | 12 | 111 | 33456 | 117.34 | 1437 | 1403 | 273.2 |
| C | 3 | 233 | 14575770 | 51807.67 | 1198 | 1208 | 281.3 |
| C | 14 | 238 | 292523 | 1035.53 | 1198 | 1208 | 281.3 |
| C | 14 | 254 | 164680 | 581.09 | 1198 | 1208 | 281.3 |
| D | 1 | 52 | 4810261 | 15881.56 | 1262 | 1228 | 302.8 |
| D | 12 | 233 | 2565911 | 8469.72 | 1262 | 1228 | 302.8 |
| D | 8 | 195 | 1966937 | 6491.64 | 1262 | 1228 | 302.8 |
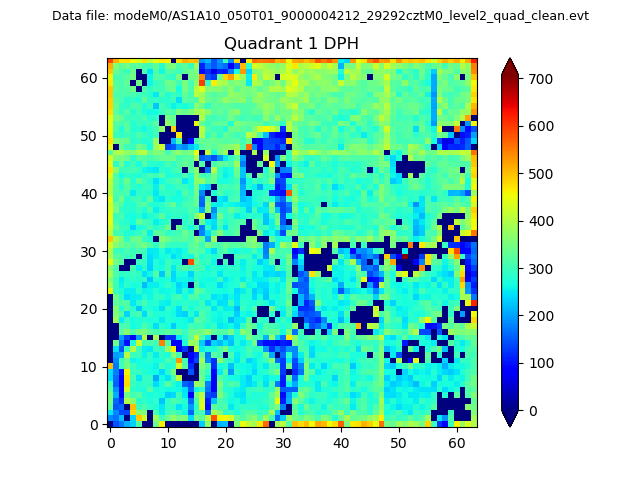
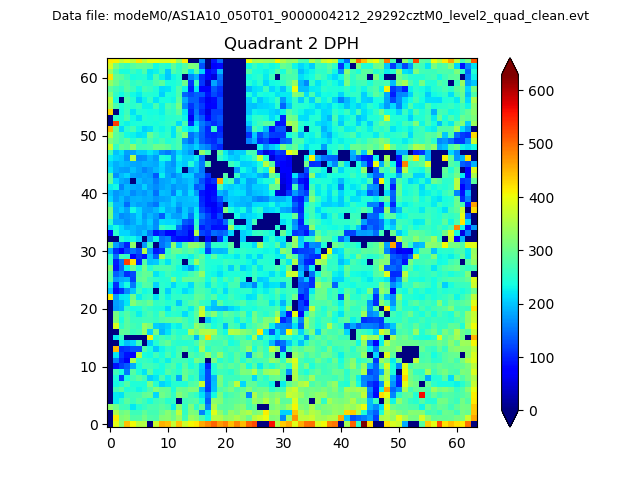
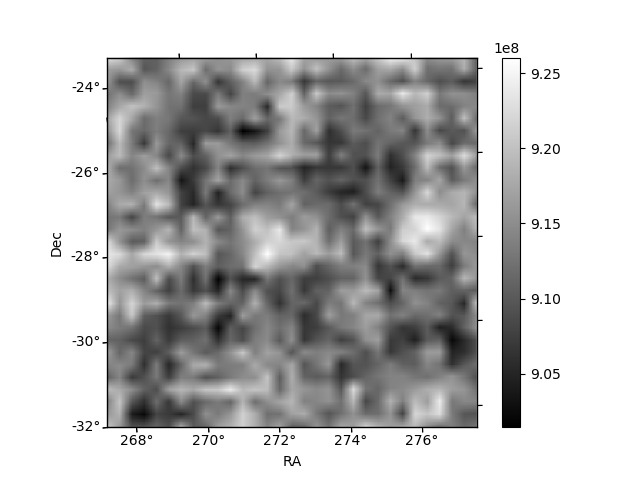
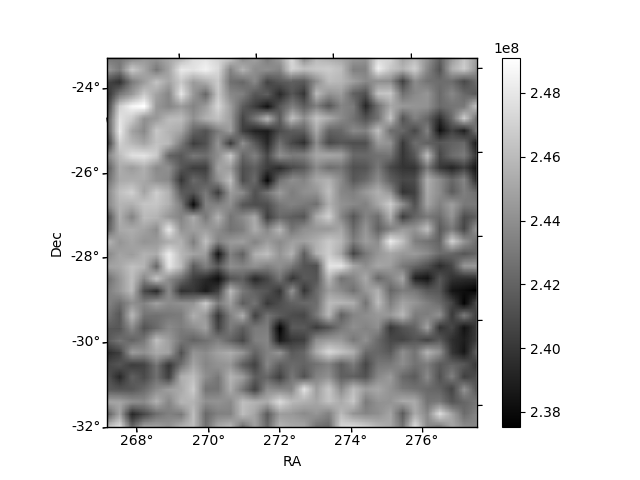
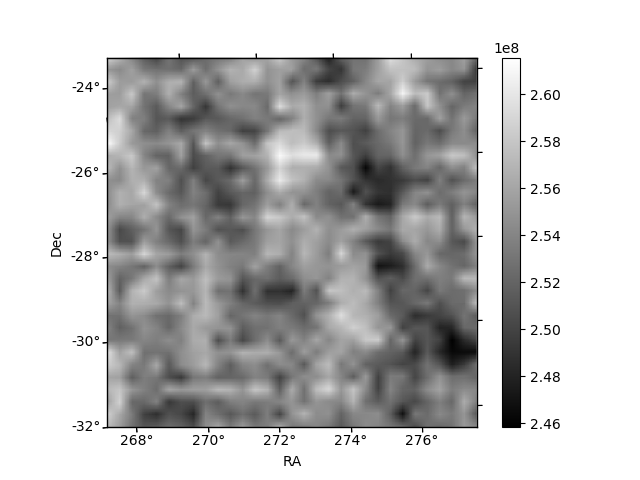
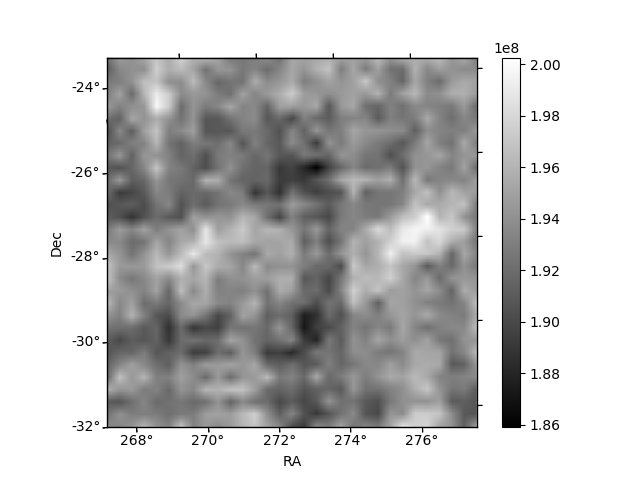
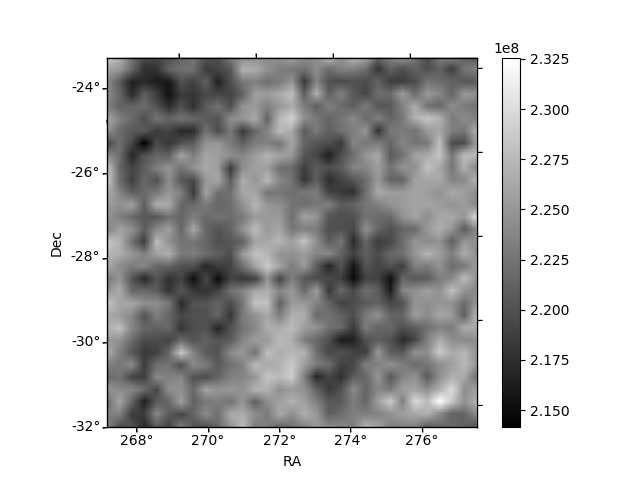
Histogram calculated using DETX and DETY for each event in the final _common_clean file
| Quadrant A | 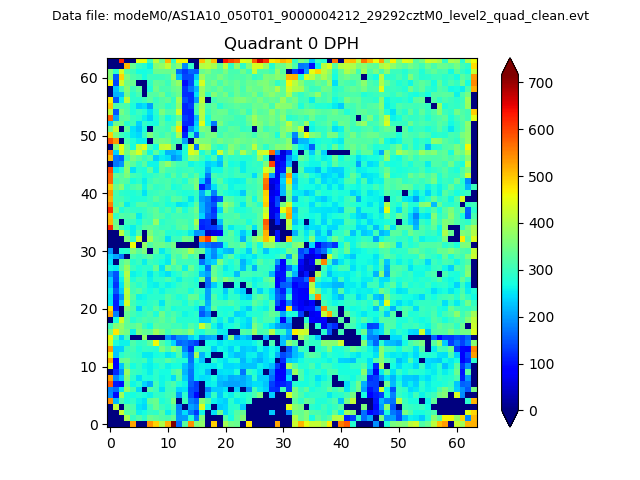 |
 |
Quadrant B |
|---|---|---|---|
| Quadrant D | 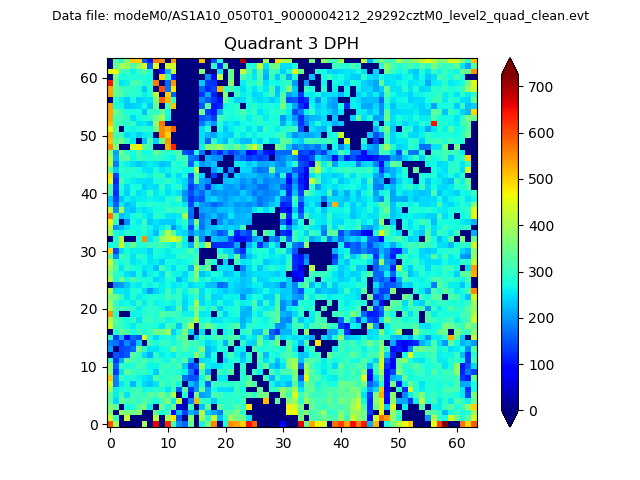 |
 |
Quadrant C |
| Plot type | Count rate plots | Images |
|---|---|---|
| Comparison with Poisson distribution Blue bars denote a histogram of data divided into 1 sec bins. Red curve is a Poisson curve with rate = median count rate of data. |
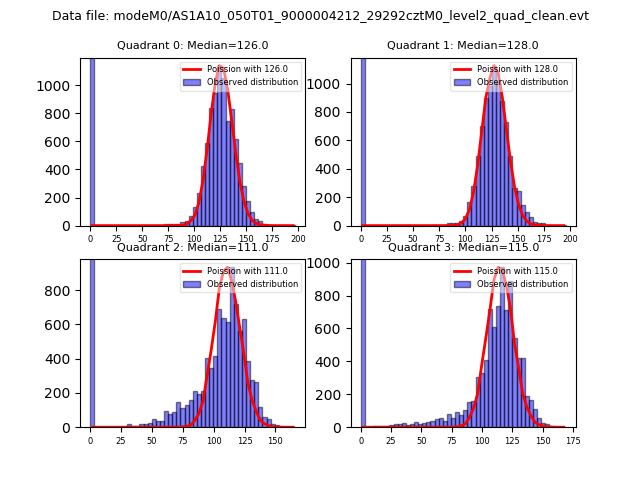 |
 |
| Quadrant-wise count rates Data is divided into 100 sec bins |
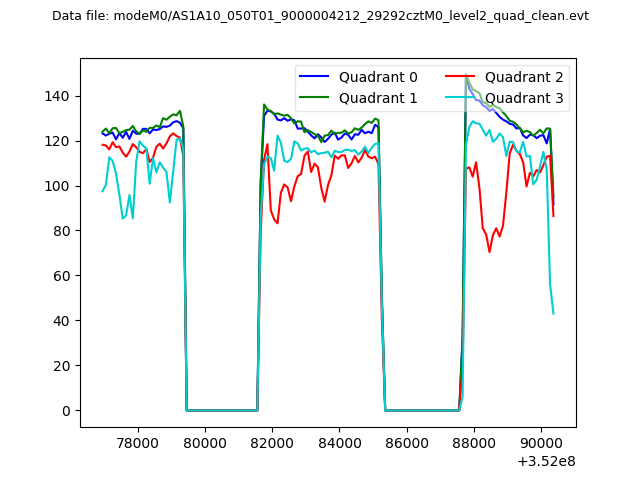 |
|
| Module-wise count rates for Quadrant A Data is divided into 100 sec bins |
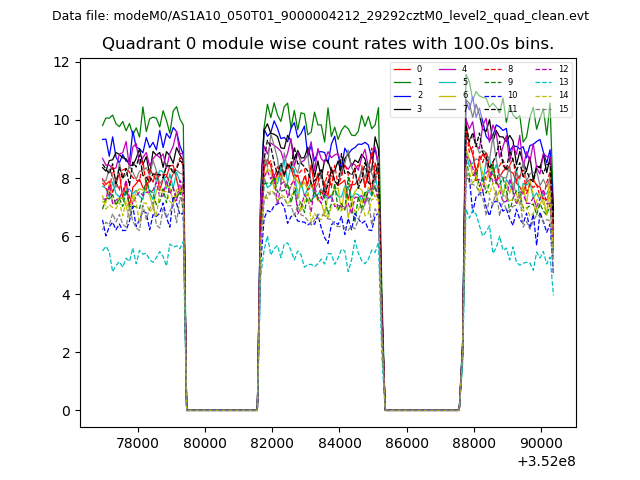 |
 |
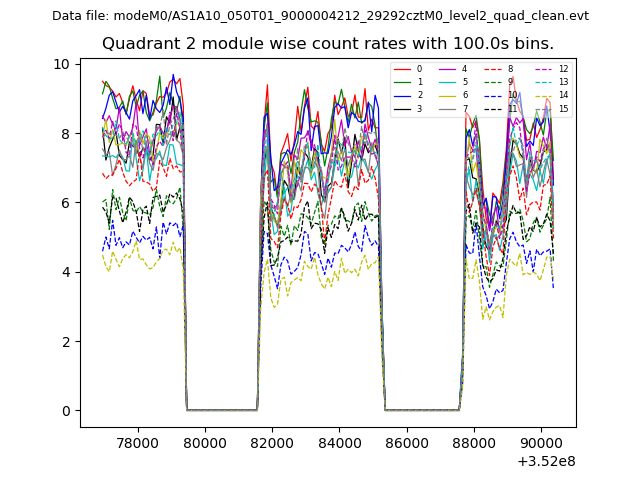
| Module-wise count rates for Quadrant B Data is divided into 100 sec bins |
 |
 |
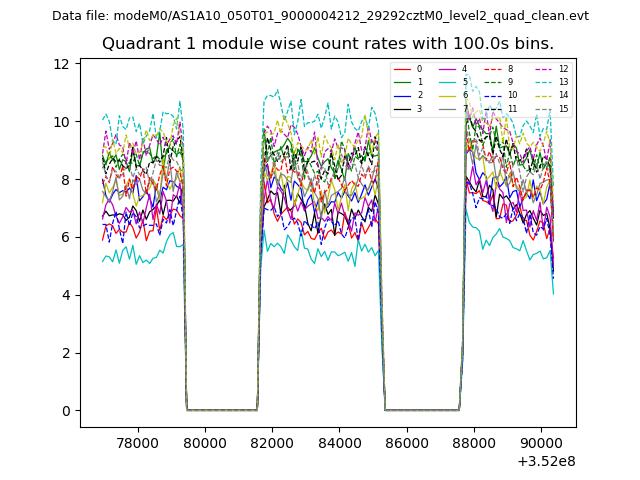
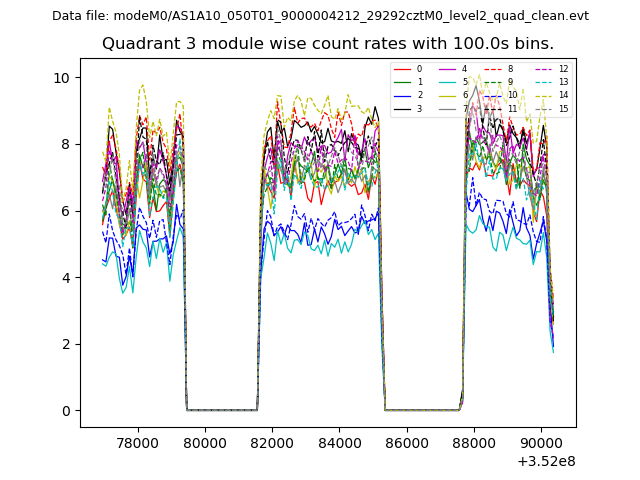
| Module-wise count rates for Quadrant C Data is divided into 100 sec bins |
 |
 |
| Module-wise count rates for Quadrant D Data is divided into 100 sec bins |
 |
 |
| Parameter | Plot |
|---|---|
| CZT HV Monitor | 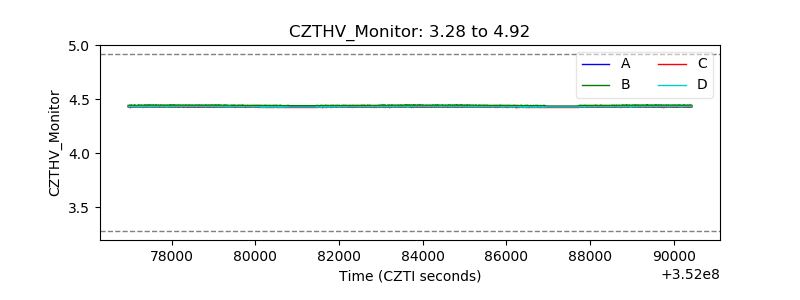 |
| D_VDD | 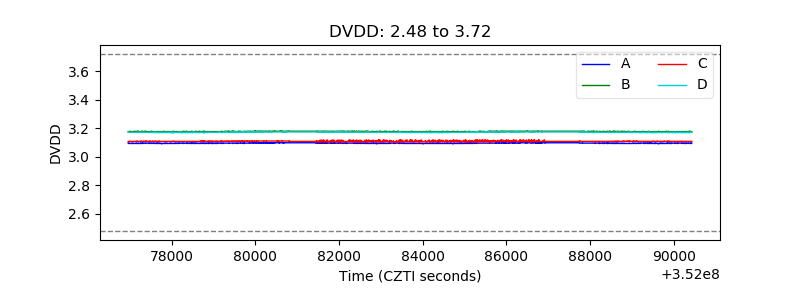 |
| Temperature 1 | 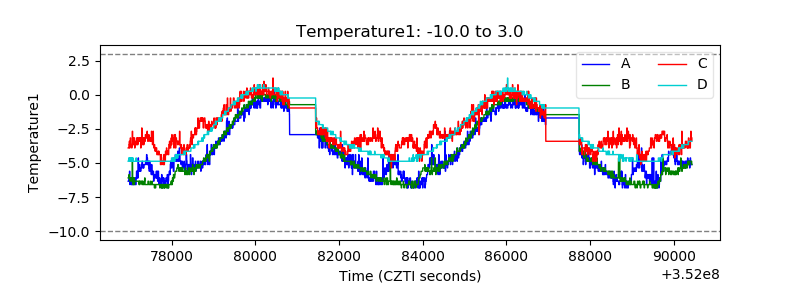 |
| Veto HV Monitor | 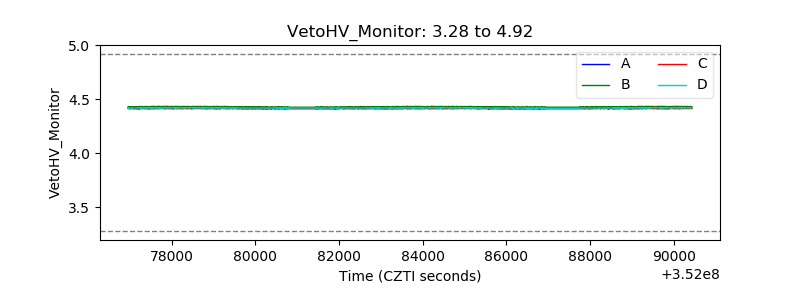 |
| Veto LLD | 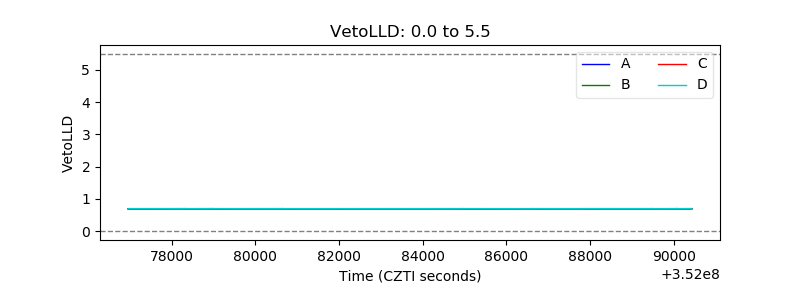 |
| Alpha Counter | 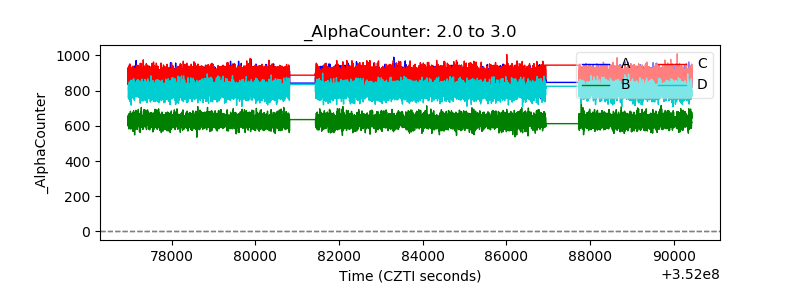 |
| _CPM_Rate | 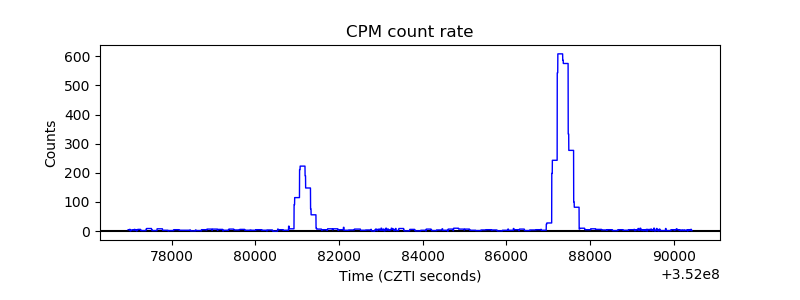 |
| CZT Counter | 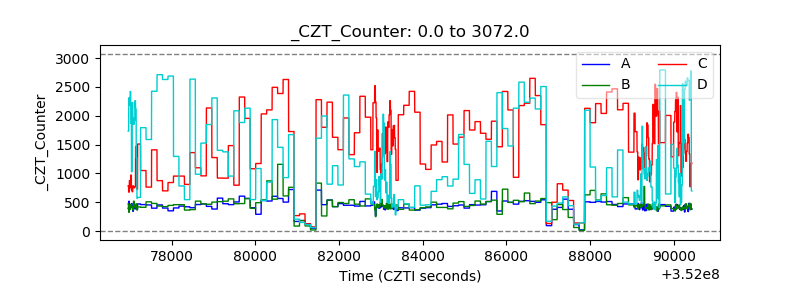 |
| +2.5 Volts monitor | 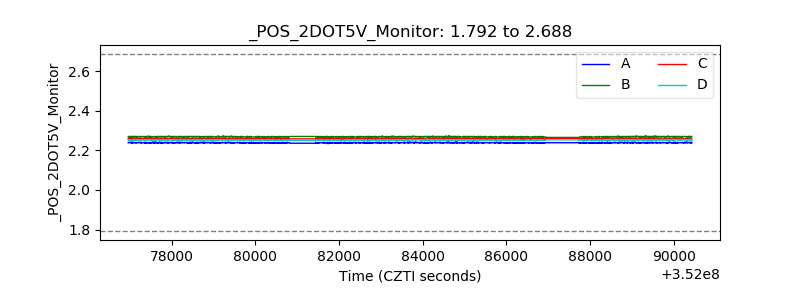 |
| +5 Volts monitor | 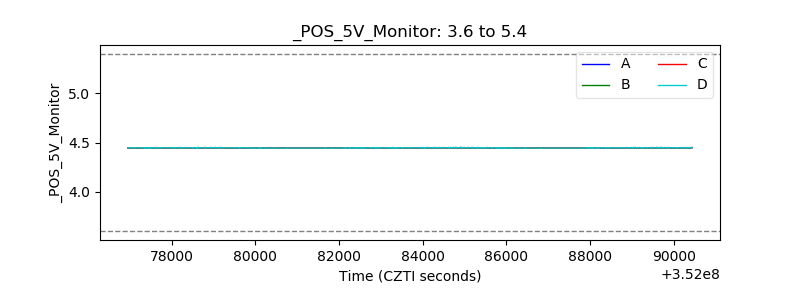 |
| _ROLL_ROT |  |
| _Roll_DEC | 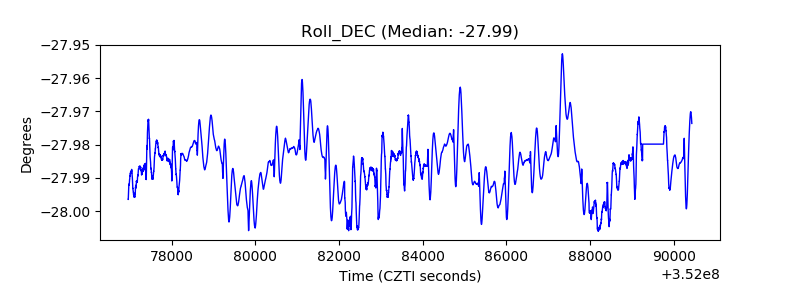 |
| _Roll_RA | 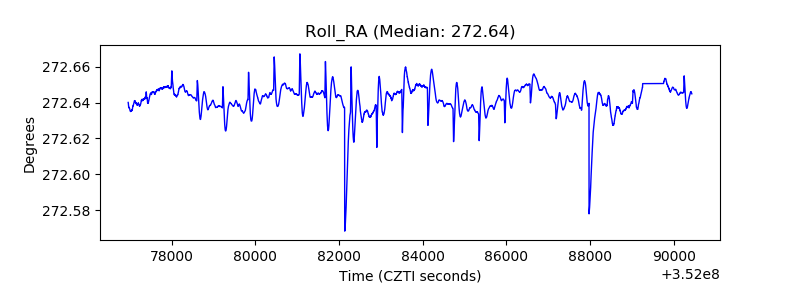 |
| Veto Counter |  |