| Param | Original file | Final file |
|---|---|---|
| Filename | modeM0/AS1A10_050T01_9000004212_29294cztM0_level2.evt | modeM0/AS1A10_050T01_9000004212_29294cztM0_level2_quad_clean.evt |
| Size (bytes) | 1,284,909,120 | 83,318,400 |
| Size | 1.2 GB | 79.5 MB |
| Events in quadrant A | 3,984,637 | 537,644 |
| Events in quadrant B | 4,113,041 | 550,458 |
| Events in quadrant C | 17,782,991 | 380,032 |
| Events in quadrant D | 12,480,198 | 481,720 |
| Mode M9 | |||
|---|---|---|---|
| Quadrant | BADHDUFLAG | Total packets | Discarded packets |
| A | 0 | 20 | 0 |
| B | 0 | 20 | 0 |
| C | 0 | 20 | 0 |
| D | 0 | 20 | 0 |
| Mode M0 | |||
|---|---|---|---|
| Quadrant | BADHDUFLAG | Total packets | Discarded packets |
| A | 0 | 16967 | 2 |
| B | 0 | 17340 | 2 |
| C | 0 | 58414 | 2 |
| D | 0 | 42815 | 2 |
| Mode SS | |||
|---|---|---|---|
| Quadrant | BADHDUFLAG | Total packets | Discarded packets |
| A | 0 | 168 | 0 |
| B | 0 | 168 | 0 |
| C | 0 | 168 | 0 |
| D | 0 | 168 | 0 |
| Quadrant | Total seconds | Saturated seconds | Saturation percentage |
|---|---|---|---|
| A | 8226 | 47 | 0.571359% |
| B | 8227 | 72 | 0.875167% |
| C | 8227 | 6680 | 81.196062% |
| D | 8227 | 2420 | 29.415340% |
Noise dominated data is calculated using 1-second bins in cleaned event files. If a bin has >2000 counts, and if more than 50% of those come from <1% of pixels, then it is considered to be noise-dominated and hence unusable.
| Quadrant | # 1 sec bins | Bins with >0 counts | Bins with >2000 counts | High rate bins dominated by noise | Noise dominated (total time) | Noise dominated (detector-on time) | Marked lightcurve |
|---|---|---|---|---|---|---|---|
| A | 10216 | 8228 | 0 | 0 | 0.00% | 0.00% | 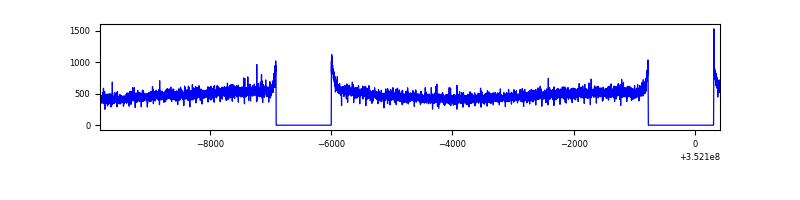 |
| B | 10217 | 8229 | 7 | 7 | 0.07% | 0.09% | 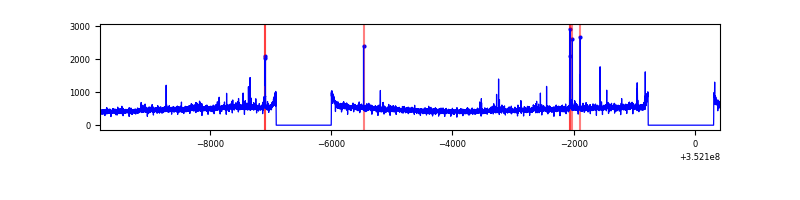 |
| C | 10217 | 8229 | 5629 | 5629 | 55.09% | 68.40% | 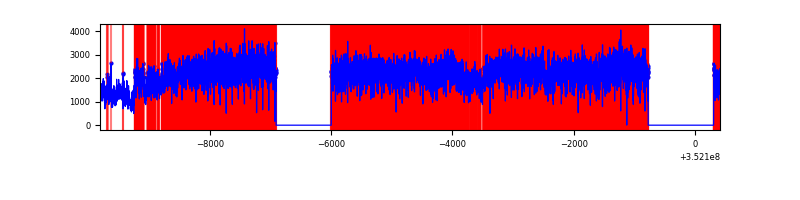 |
| D | 10217 | 8229 | 1999 | 1999 | 19.57% | 24.29% | 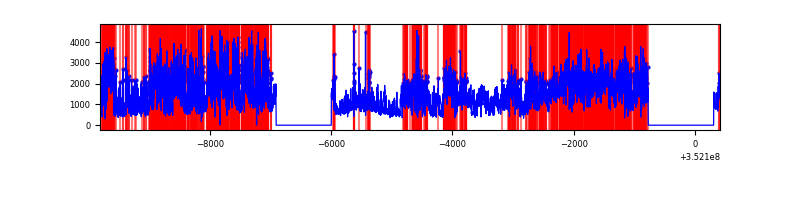 |
Top three noisy pixels from each quadrant. If the there are fewer than three noisy pixels in the level2.evt file, extra rows are filled as -1
| Pixel properties | Quadrant properties | ||||||
|---|---|---|---|---|---|---|---|
| Quadrant | DetID | PixID | Counts | Sigma | Mean | Median | Sigma |
| A | 13 | 254 | 17017 | 77.57 | 1031 | 1011 | 206.3 |
| A | 3 | 137 | 9576 | 41.51 | 1031 | 1011 | 206.3 |
| A | 0 | 226 | 8783 | 37.67 | 1031 | 1011 | 206.3 |
| B | 10 | 245 | 24163 | 119.13 | 1022 | 994 | 194.5 |
| B | 12 | 111 | 23249 | 114.43 | 1022 | 994 | 194.5 |
| B | 11 | 111 | 20820 | 101.94 | 1022 | 994 | 194.5 |
| C | 3 | 233 | 14992308 | 96207.97 | 669 | 672 | 155.8 |
| C | 14 | 238 | 122839 | 784.0 | 669 | 672 | 155.8 |
| C | 14 | 254 | 34991 | 220.24 | 669 | 672 | 155.8 |
| D | 1 | 52 | 5042426 | 23368.54 | 902 | 879 | 215.7 |
| D | 8 | 195 | 1530542 | 7090.28 | 902 | 879 | 215.7 |
| D | 12 | 233 | 1302160 | 6031.69 | 902 | 879 | 215.7 |
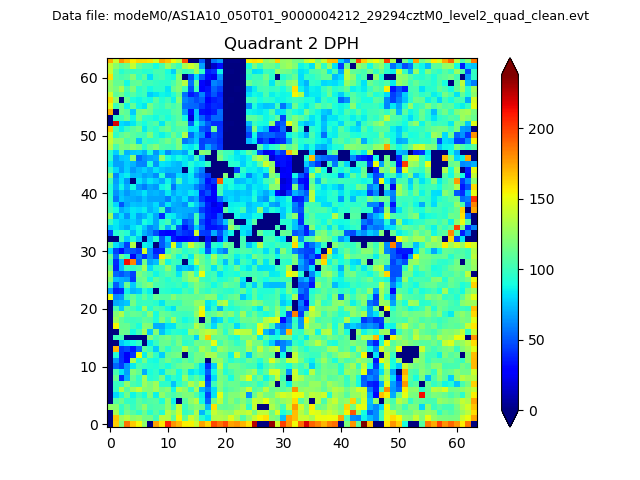
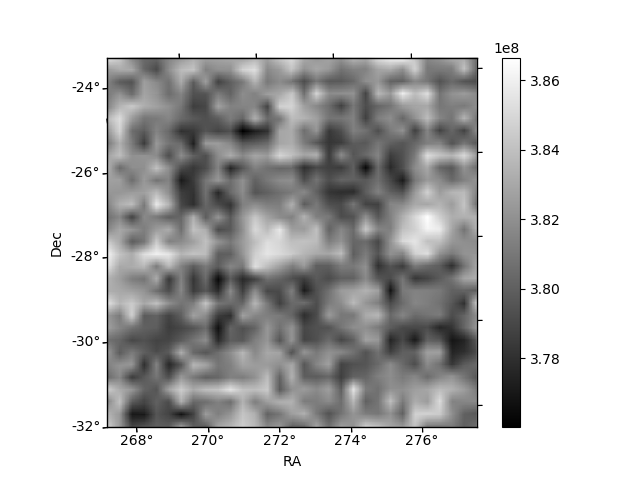
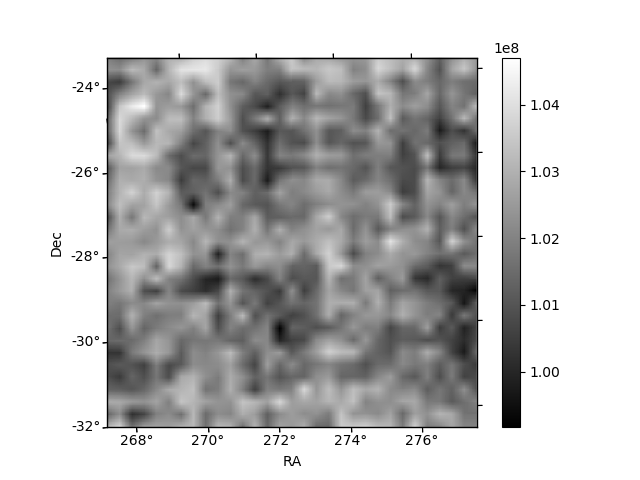
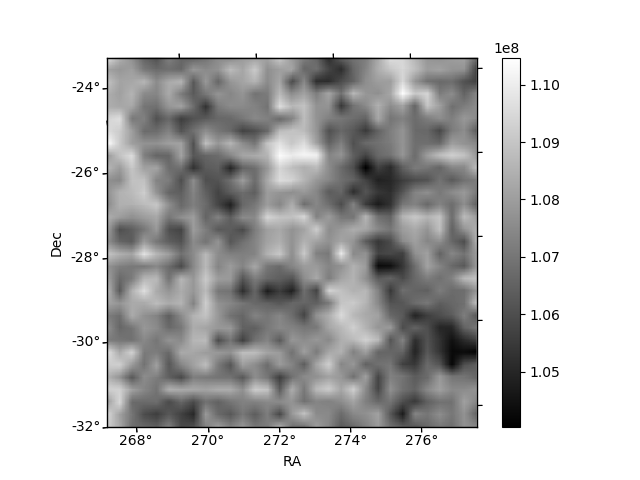
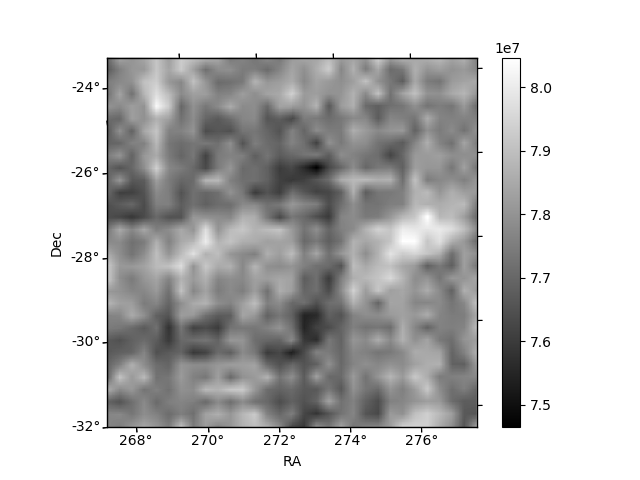
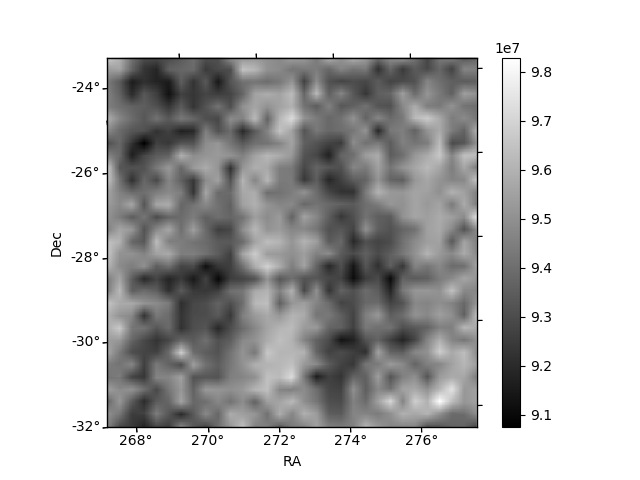
Histogram calculated using DETX and DETY for each event in the final _common_clean file
| Quadrant A | 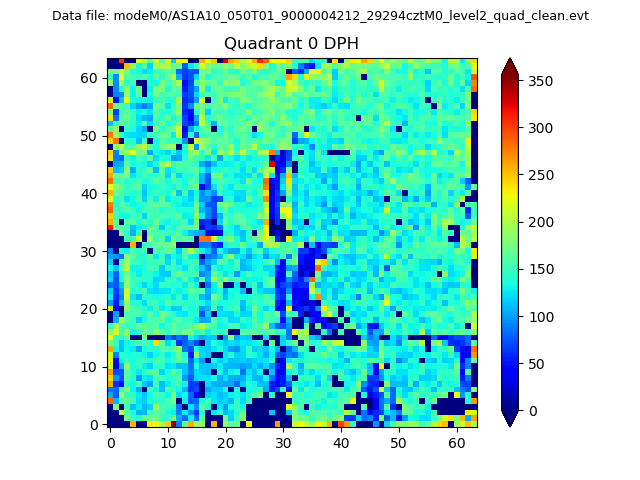 |
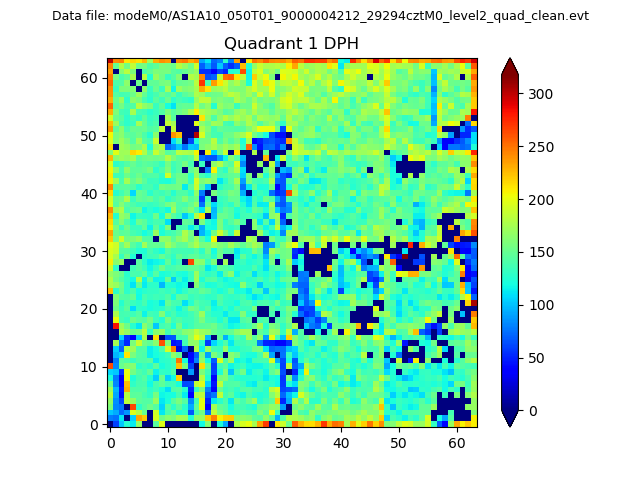 |
Quadrant B |
|---|---|---|---|
| Quadrant D | 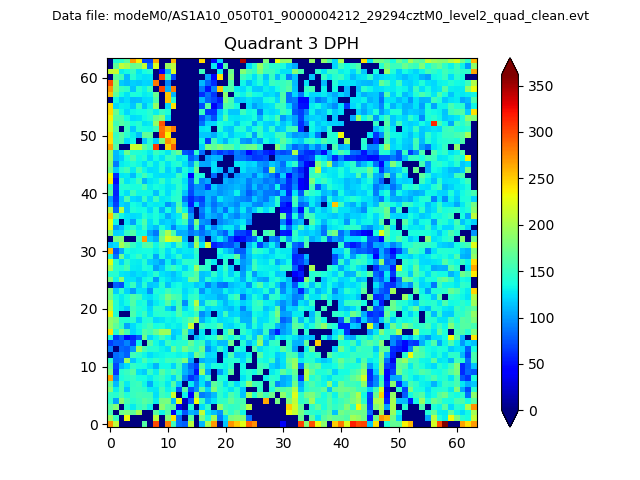 |
 |
Quadrant C |
| Plot type | Count rate plots | Images |
|---|---|---|
| Comparison with Poisson distribution Blue bars denote a histogram of data divided into 1 sec bins. Red curve is a Poisson curve with rate = median count rate of data. |
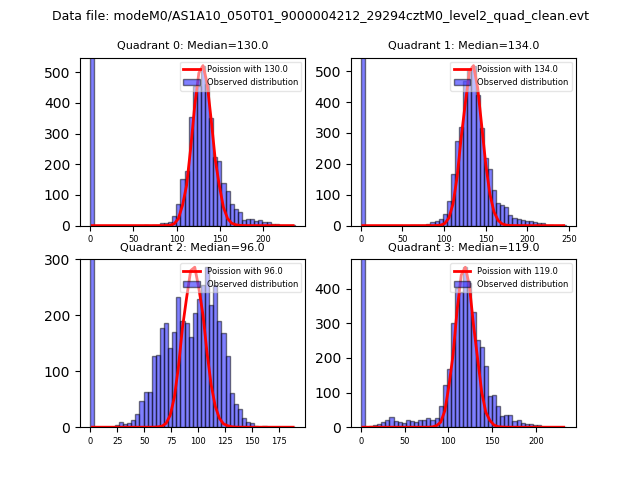 |
 |
| Quadrant-wise count rates Data is divided into 100 sec bins |
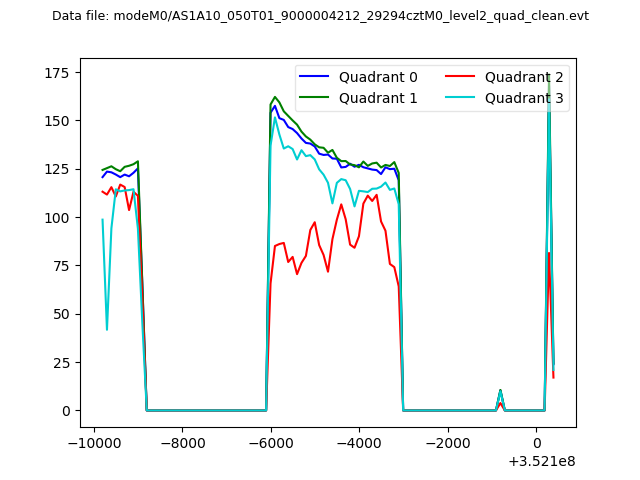 |
|
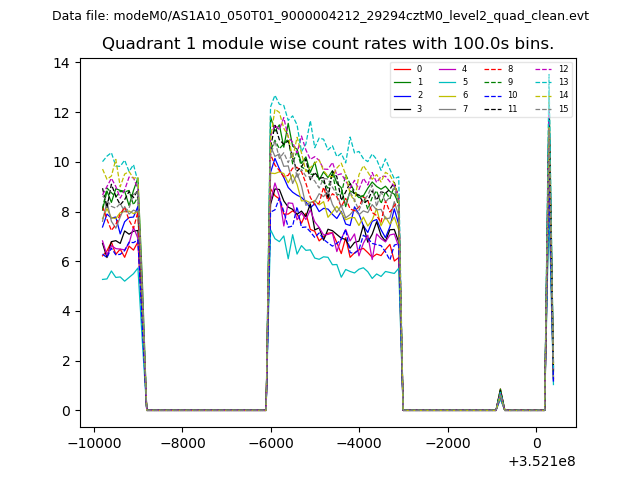
| Module-wise count rates for Quadrant A Data is divided into 100 sec bins |
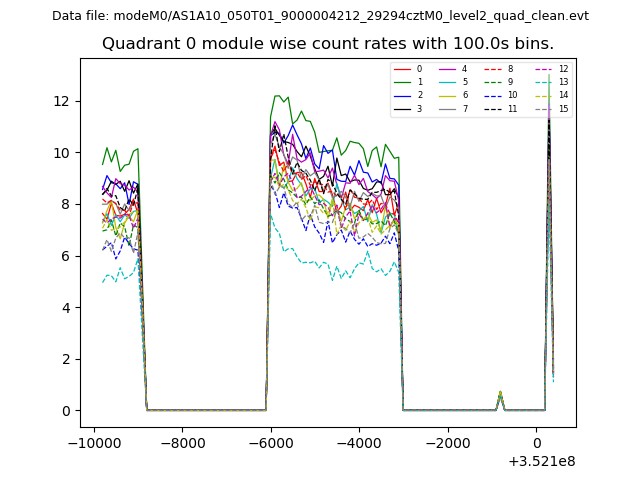 |
 |
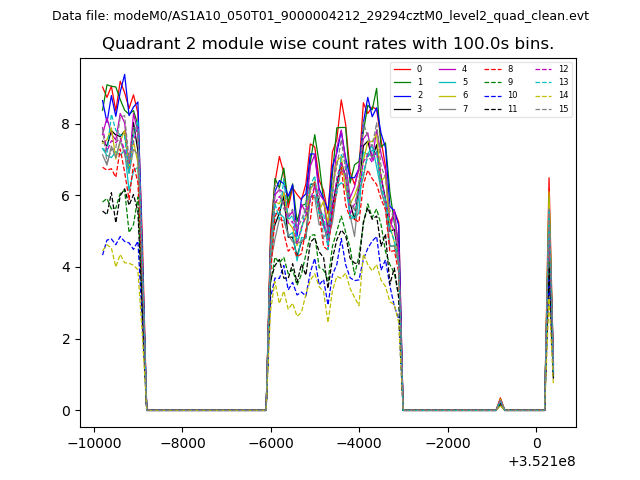
| Module-wise count rates for Quadrant B Data is divided into 100 sec bins |
 |
 |
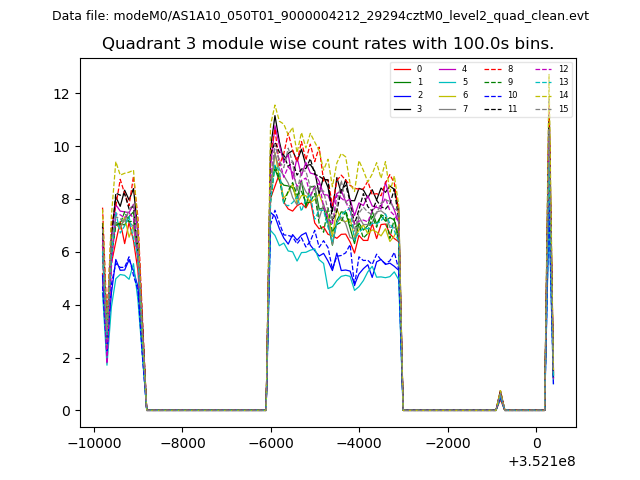
| Module-wise count rates for Quadrant C Data is divided into 100 sec bins |
 |
 |
| Module-wise count rates for Quadrant D Data is divided into 100 sec bins |
 |
 |
| Parameter | Plot |
|---|---|
| CZT HV Monitor | 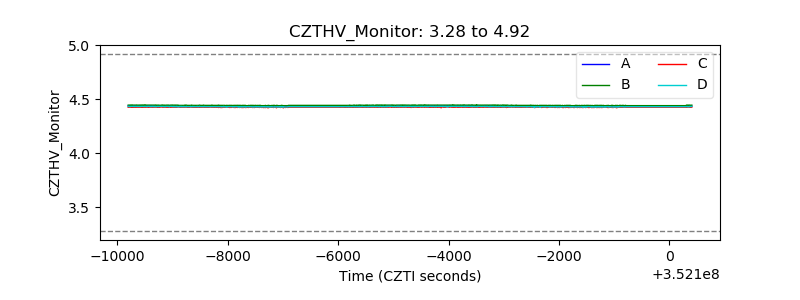 |
| D_VDD | 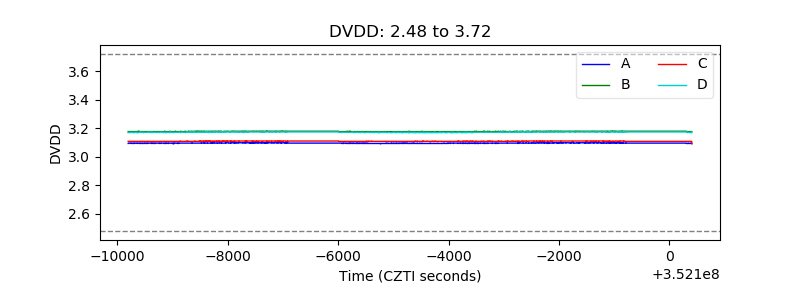 |
| Temperature 1 | 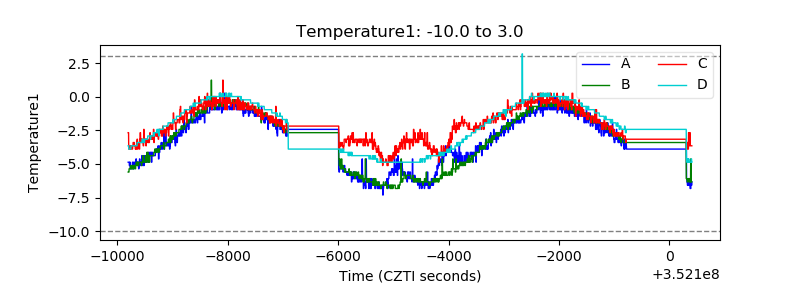 |
| Veto HV Monitor | 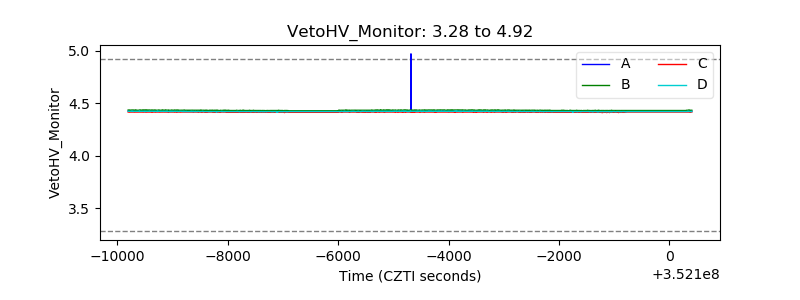 |
| Veto LLD | 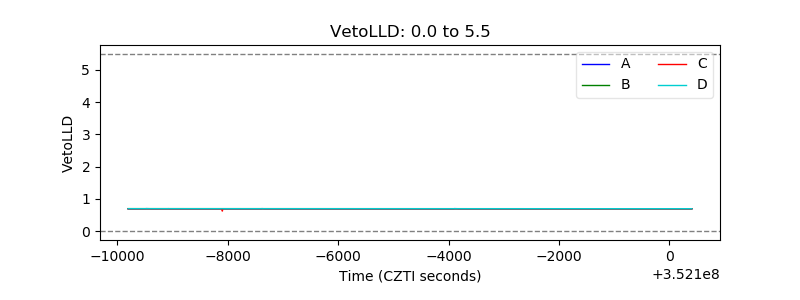 |
| Alpha Counter | 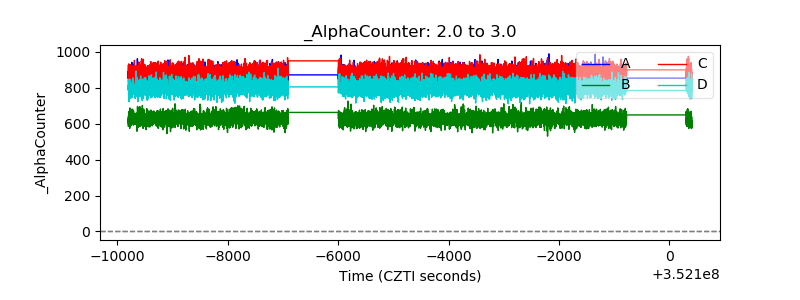 |
| _CPM_Rate | 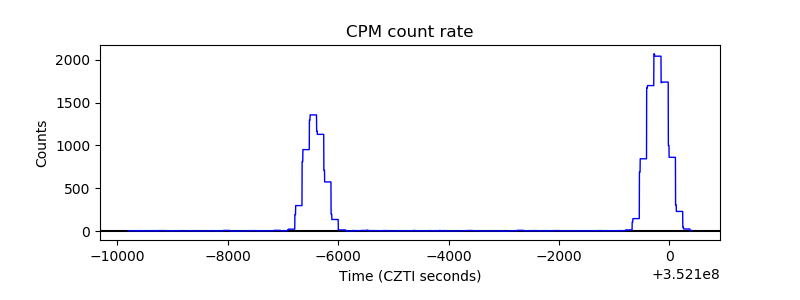 |
| CZT Counter | 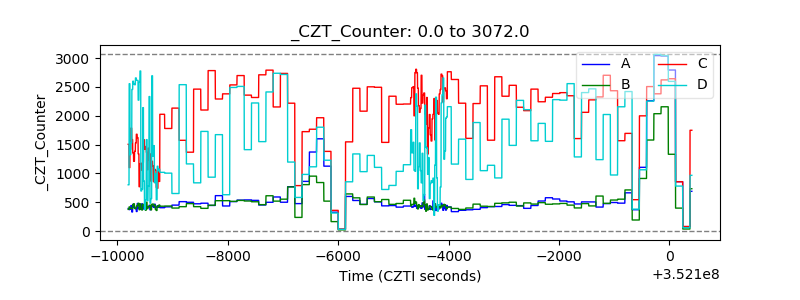 |
| +2.5 Volts monitor | 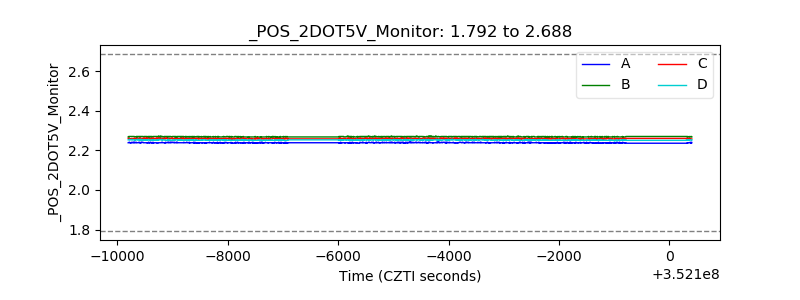 |
| +5 Volts monitor | 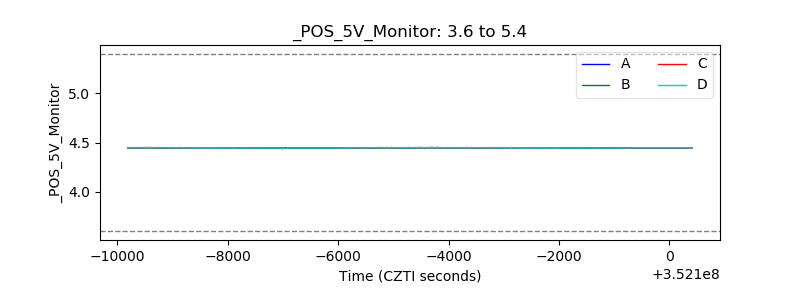 |
| _ROLL_ROT | 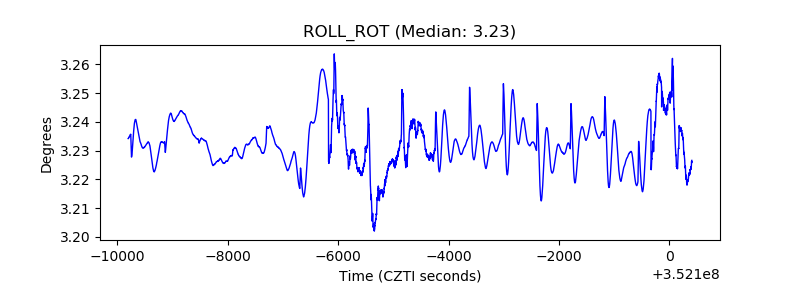 |
| _Roll_DEC |  |
| _Roll_RA | 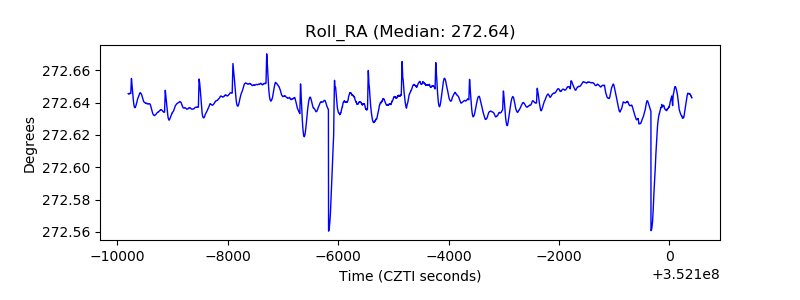 |
| Veto Counter | 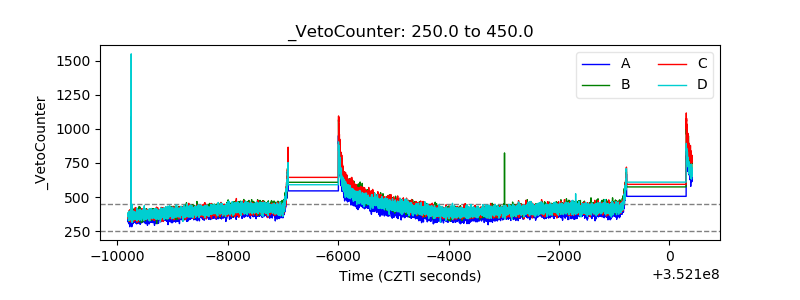 |