| Param | Original file | Final file |
|---|---|---|
| Filename | modeM0/AS1A10_050T01_9000004212_29295cztM0_level2.evt | modeM0/AS1A10_050T01_9000004212_29295cztM0_level2_quad_clean.evt |
| Size (bytes) | 915,410,880 | 99,362,880 |
| Size | 873.0 MB | 94.8 MB |
| Events in quadrant A | 3,424,705 | 704,024 |
| Events in quadrant B | 3,503,156 | 716,811 |
| Events in quadrant C | 14,404,326 | 451,747 |
| Events in quadrant D | 5,930,678 | 660,075 |
| Mode M9 | |||
|---|---|---|---|
| Quadrant | BADHDUFLAG | Total packets | Discarded packets |
| A | 0 | 11 | 0 |
| B | 0 | 11 | 0 |
| C | 0 | 11 | 0 |
| D | 0 | 11 | 0 |
| Mode M0 | |||
|---|---|---|---|
| Quadrant | BADHDUFLAG | Total packets | Discarded packets |
| A | 0 | 14194 | 1 |
| B | 0 | 14460 | 1 |
| C | 0 | 47459 | 1 |
| D | 0 | 22199 | 1 |
| Mode SS | |||
|---|---|---|---|
| Quadrant | BADHDUFLAG | Total packets | Discarded packets |
| A | 0 | 140 | 0 |
| B | 0 | 140 | 0 |
| C | 0 | 140 | 0 |
| D | 0 | 140 | 0 |
| Quadrant | Total seconds | Saturated seconds | Saturation percentage |
|---|---|---|---|
| A | 6806 | 20 | 0.293858% |
| B | 6806 | 38 | 0.558331% |
| C | 6807 | 5729 | 84.163361% |
| D | 6807 | 481 | 7.066255% |
Noise dominated data is calculated using 1-second bins in cleaned event files. If a bin has >2000 counts, and if more than 50% of those come from <1% of pixels, then it is considered to be noise-dominated and hence unusable.
| Quadrant | # 1 sec bins | Bins with >0 counts | Bins with >2000 counts | High rate bins dominated by noise | Noise dominated (total time) | Noise dominated (detector-on time) | Marked lightcurve |
|---|---|---|---|---|---|---|---|
| A | 7986 | 6807 | 0 | 0 | 0.00% | 0.00% | 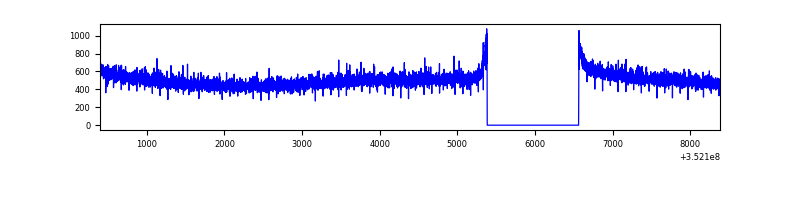 |
| B | 7986 | 6807 | 6 | 6 | 0.08% | 0.09% | 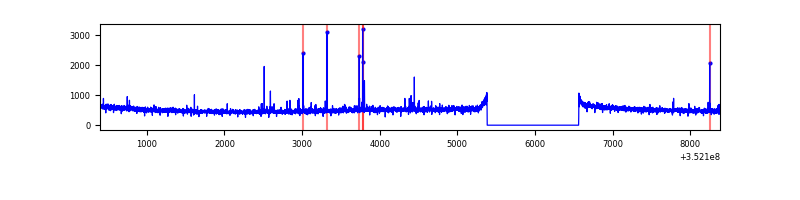 |
| C | 7987 | 6808 | 4219 | 4219 | 52.82% | 61.97% | 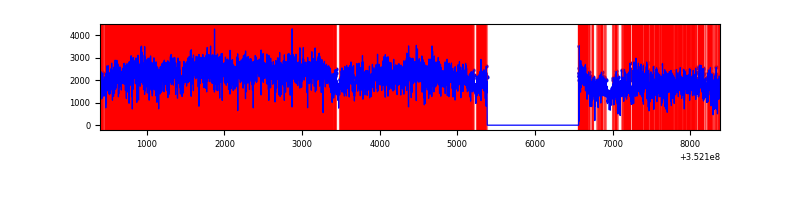 |
| D | 7987 | 6807 | 380 | 380 | 4.76% | 5.58% | 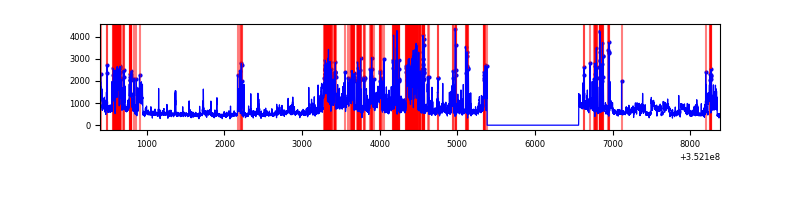 |
Top three noisy pixels from each quadrant. If the there are fewer than three noisy pixels in the level2.evt file, extra rows are filled as -1
| Pixel properties | Quadrant properties | ||||||
|---|---|---|---|---|---|---|---|
| Quadrant | DetID | PixID | Counts | Sigma | Mean | Median | Sigma |
| A | 13 | 254 | 13700 | 72.69 | 887 | 871 | 176.5 |
| A | 3 | 137 | 7813 | 39.33 | 887 | 871 | 176.5 |
| A | 0 | 226 | 7427 | 37.14 | 887 | 871 | 176.5 |
| B | 10 | 245 | 28999 | 171.28 | 878 | 857 | 164.3 |
| B | 12 | 111 | 19220 | 111.76 | 878 | 857 | 164.3 |
| B | 11 | 111 | 17158 | 99.21 | 878 | 857 | 164.3 |
| C | 3 | 233 | 11672111 | 81949.08 | 614 | 620 | 142.4 |
| C | 14 | 238 | 179234 | 1254.1 | 614 | 620 | 142.4 |
| C | 14 | 254 | 132706 | 927.42 | 614 | 620 | 142.4 |
| D | 1 | 52 | 1934985 | 9514.76 | 854 | 834 | 203.3 |
| D | 12 | 233 | 364576 | 1789.37 | 854 | 834 | 203.3 |
| D | 8 | 195 | 102083 | 498.08 | 854 | 834 | 203.3 |
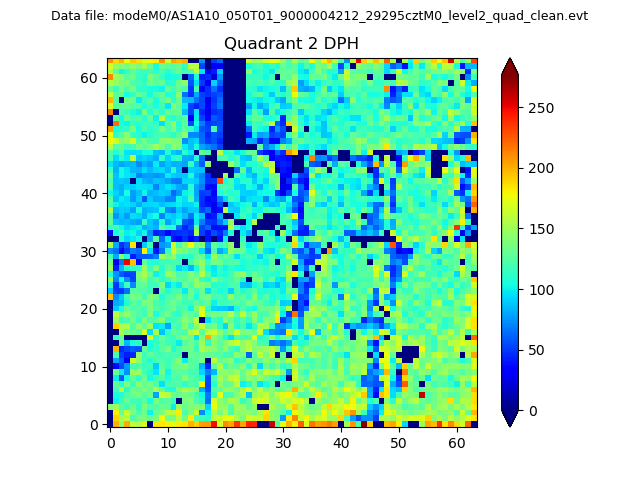
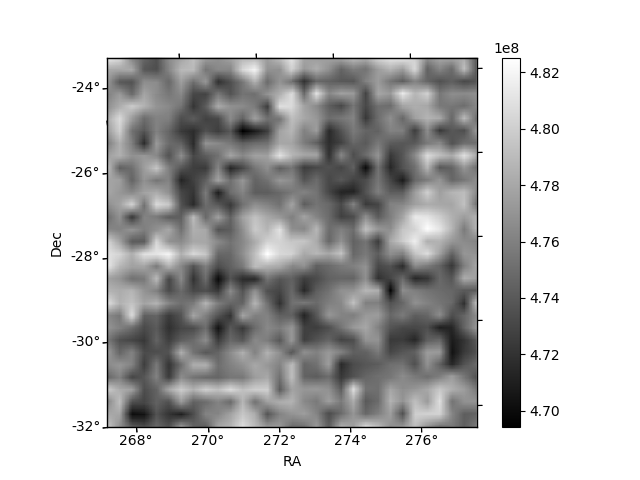
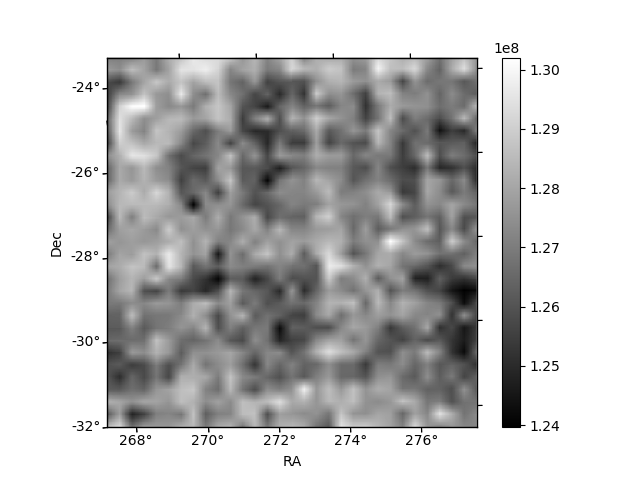
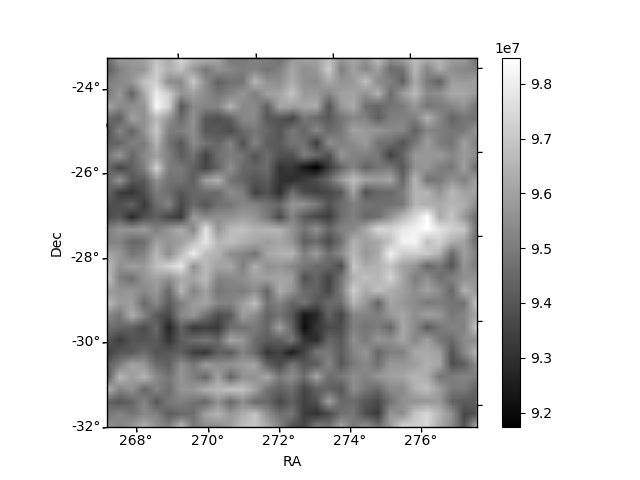
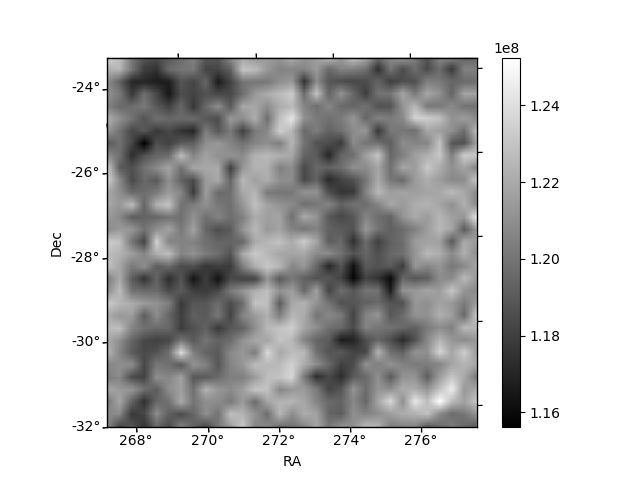
Histogram calculated using DETX and DETY for each event in the final _common_clean file
| Quadrant A | 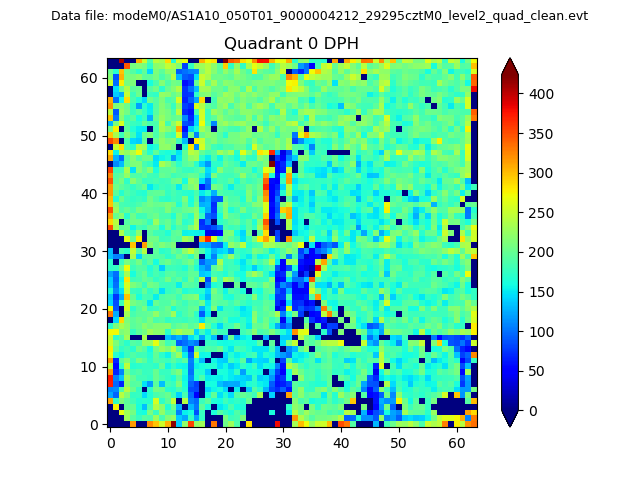 |
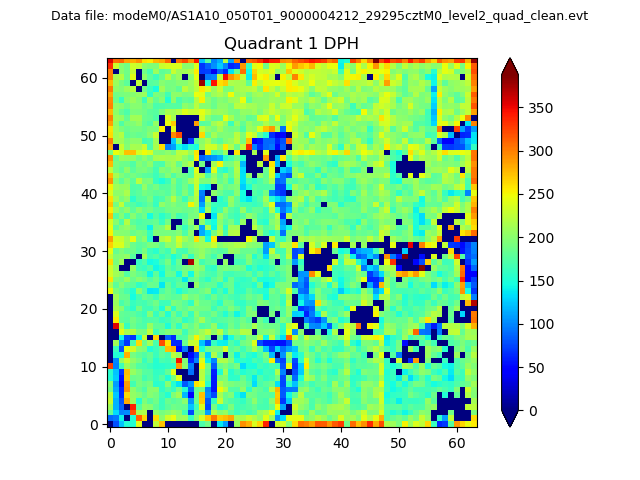 |
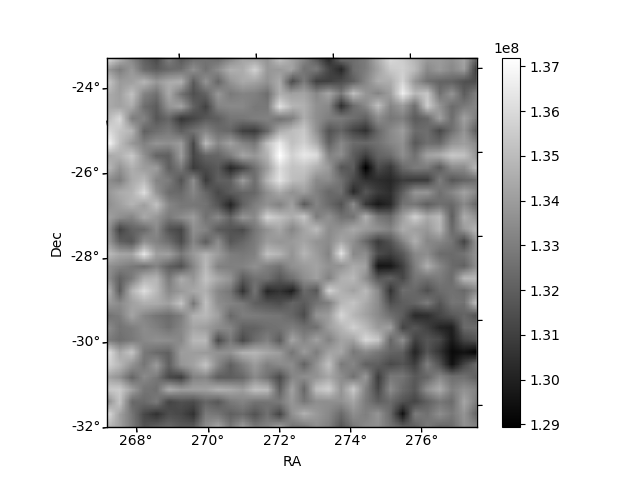
Quadrant B |
|---|---|---|---|
| Quadrant D | 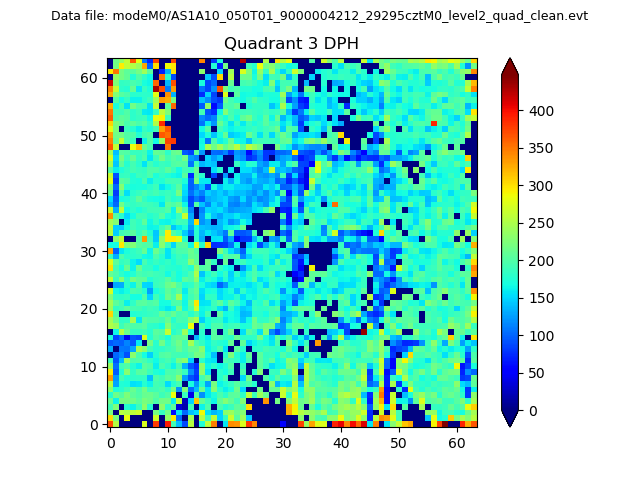 |
 |
Quadrant C |
| Plot type | Count rate plots | Images |
|---|---|---|
| Comparison with Poisson distribution Blue bars denote a histogram of data divided into 1 sec bins. Red curve is a Poisson curve with rate = median count rate of data. |
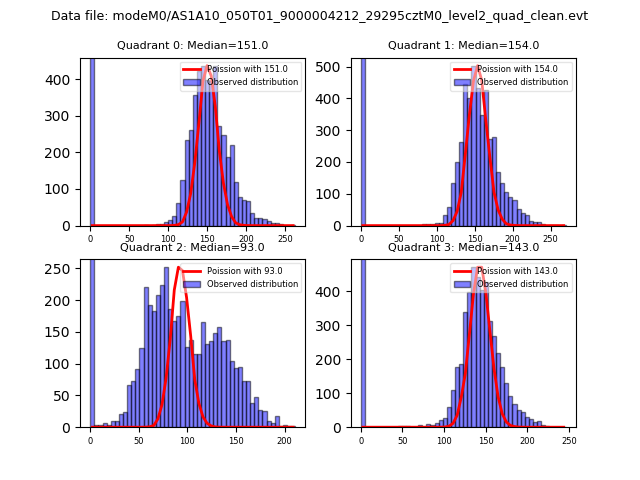 |
 |
| Quadrant-wise count rates Data is divided into 100 sec bins |
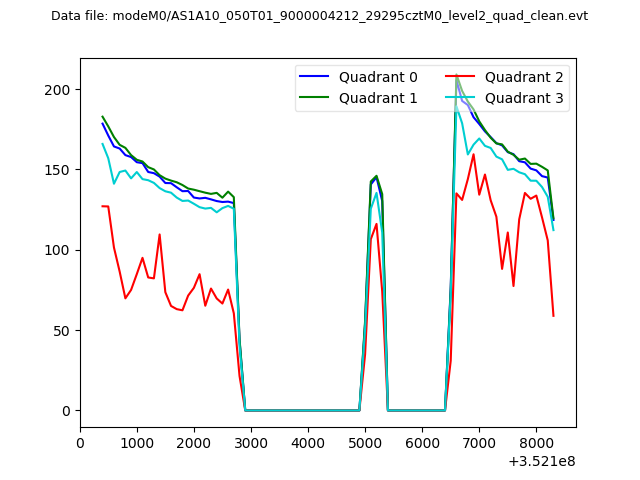 |
|
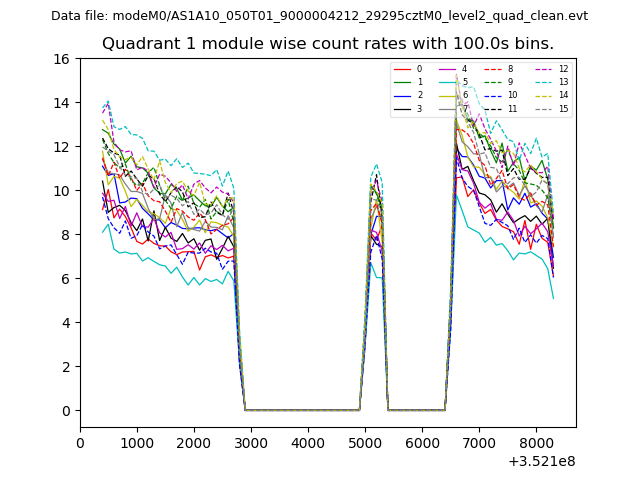
| Module-wise count rates for Quadrant A Data is divided into 100 sec bins |
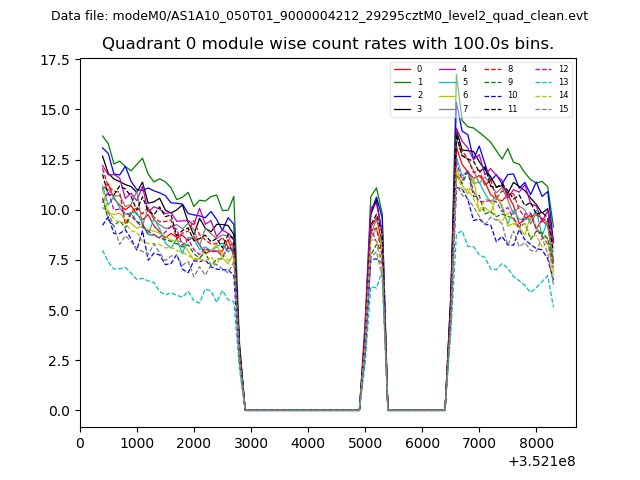 |
 |
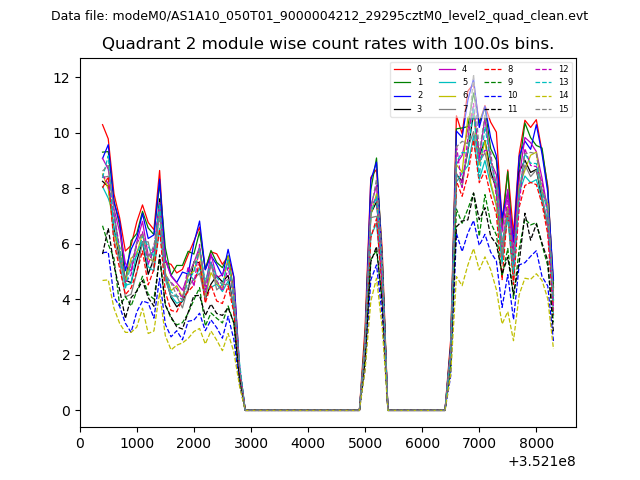
| Module-wise count rates for Quadrant B Data is divided into 100 sec bins |
 |
 |
| Module-wise count rates for Quadrant C Data is divided into 100 sec bins |
 |
 |
| Module-wise count rates for Quadrant D Data is divided into 100 sec bins |
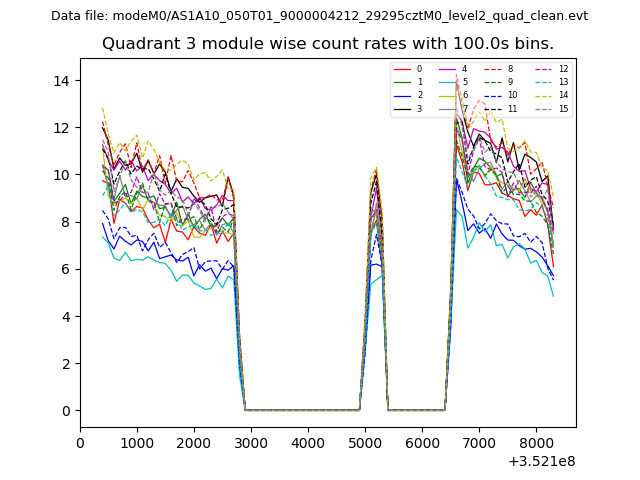 |
 |
| Parameter | Plot |
|---|---|
| CZT HV Monitor | 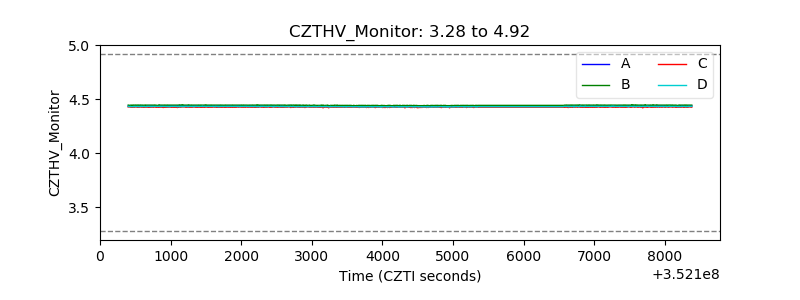 |
| D_VDD | 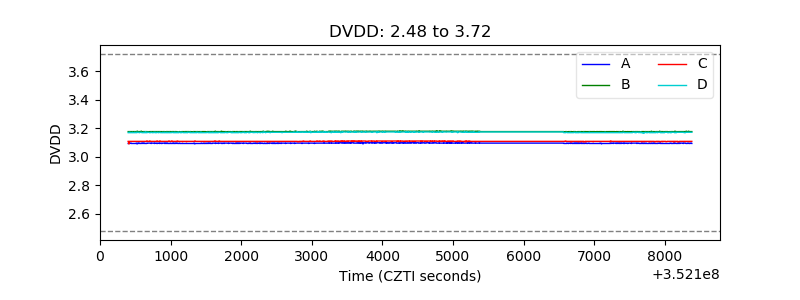 |
| Temperature 1 | 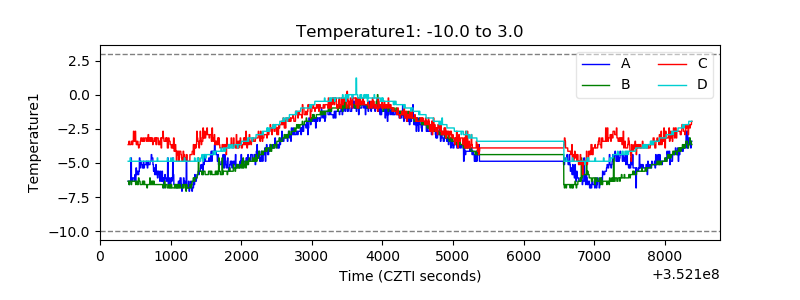 |
| Veto HV Monitor | 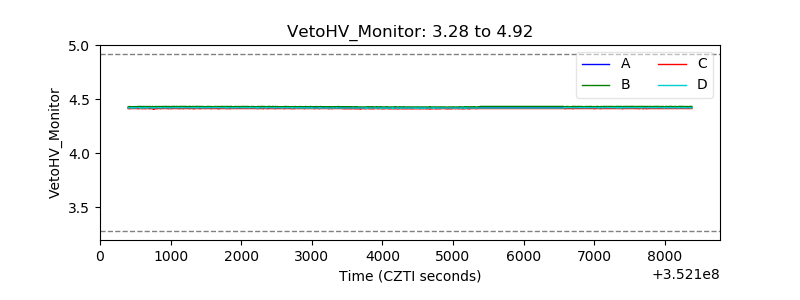 |
| Veto LLD | 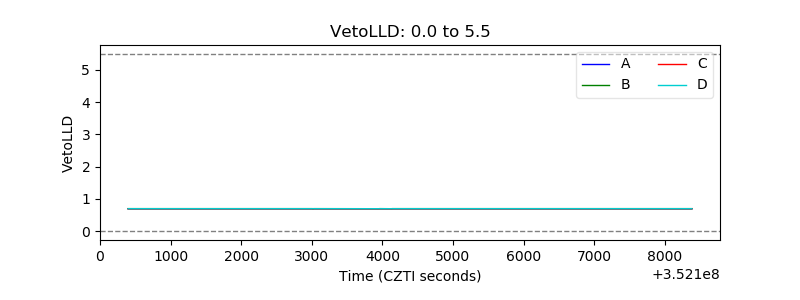 |
| Alpha Counter | 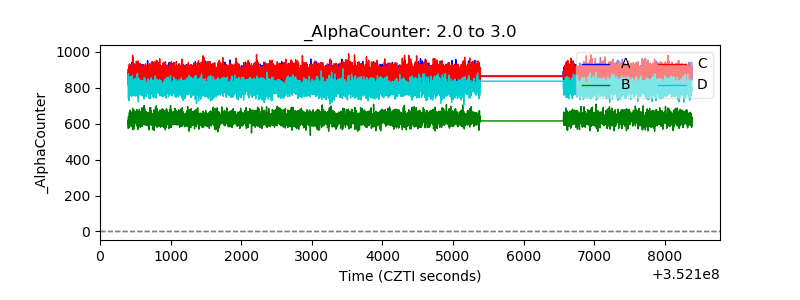 |
| _CPM_Rate | 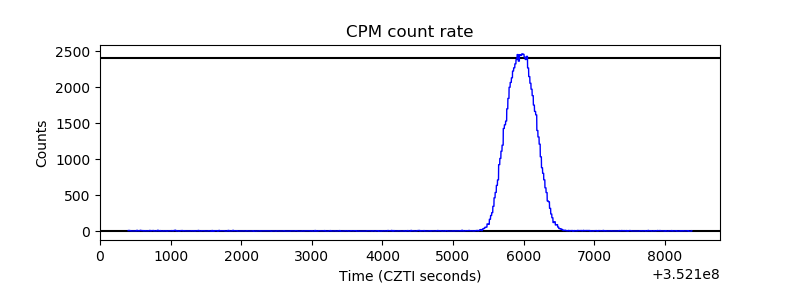 |
| CZT Counter | 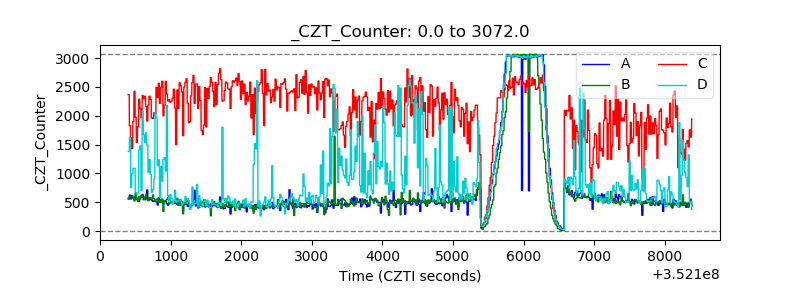 |
| +2.5 Volts monitor |  |
| +5 Volts monitor | 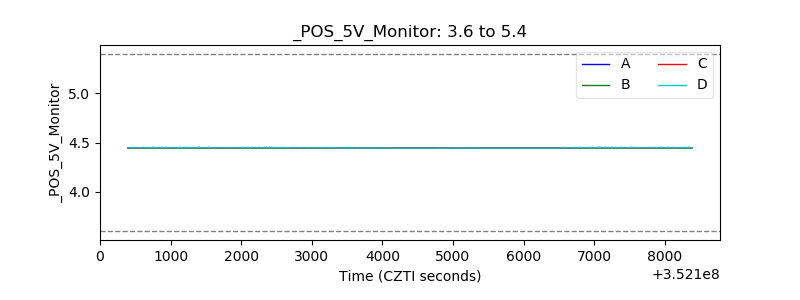 |
| _ROLL_ROT | 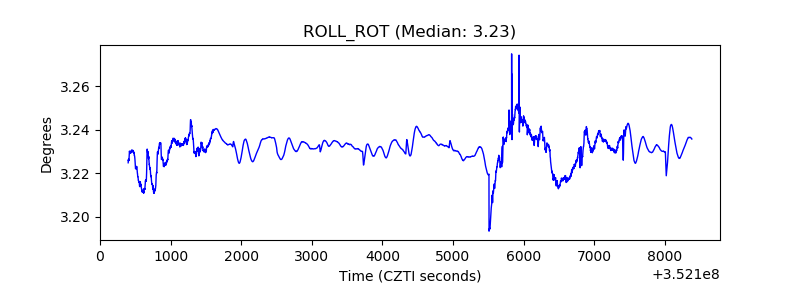 |
| _Roll_DEC | 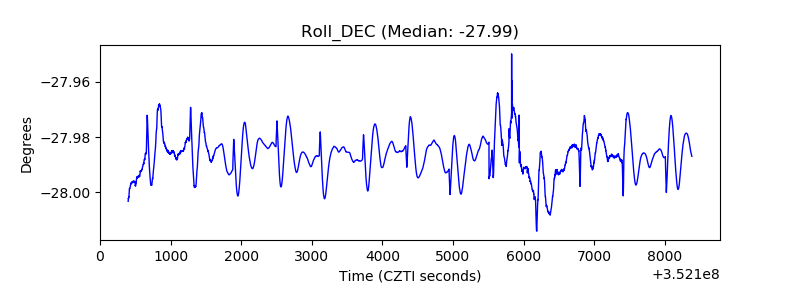 |
| _Roll_RA | 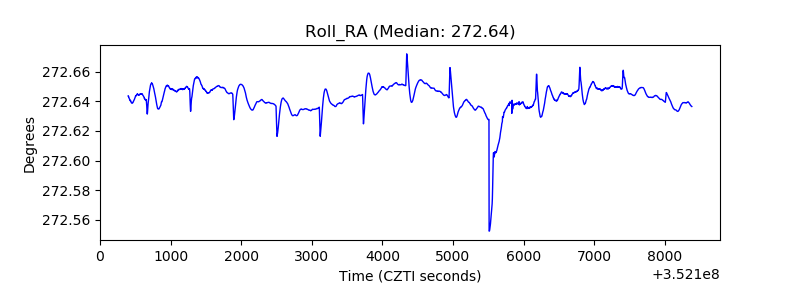 |
| Veto Counter | 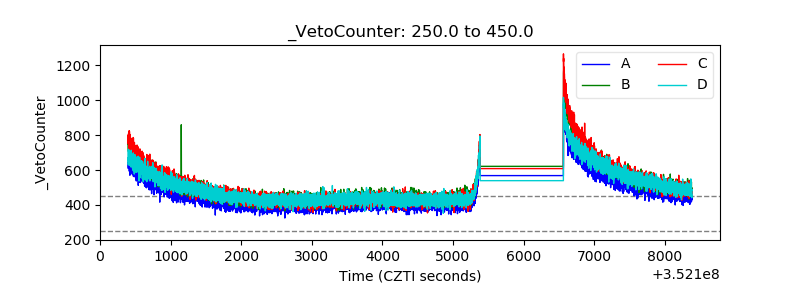 |