| Param | Original file | Final file |
|---|---|---|
| Filename | modeM0/AS1A10_050T01_9000004212_29296cztM0_level2.evt | modeM0/AS1A10_050T01_9000004212_29296cztM0_level2_quad_clean.evt |
| Size (bytes) | 788,549,760 | 86,685,120 |
| Size | 752.0 MB | 82.7 MB |
| Events in quadrant A | 3,086,615 | 595,554 |
| Events in quadrant B | 3,817,278 | 596,997 |
| Events in quadrant C | 11,190,920 | 471,223 |
| Events in quadrant D | 5,389,175 | 549,125 |
| Mode M9 | |||
|---|---|---|---|
| Quadrant | BADHDUFLAG | Total packets | Discarded packets |
| A | 0 | 13 | 0 |
| B | 0 | 13 | 0 |
| C | 0 | 13 | 0 |
| D | 0 | 13 | 0 |
| Mode M0 | |||
|---|---|---|---|
| Quadrant | BADHDUFLAG | Total packets | Discarded packets |
| A | 0 | 12505 | 1 |
| B | 0 | 14909 | 1 |
| C | 0 | 37297 | 1 |
| D | 0 | 20121 | 1 |
| Mode SS | |||
|---|---|---|---|
| Quadrant | BADHDUFLAG | Total packets | Discarded packets |
| A | 0 | 120 | 0 |
| B | 0 | 120 | 0 |
| C | 0 | 120 | 0 |
| D | 0 | 120 | 0 |
| Quadrant | Total seconds | Saturated seconds | Saturation percentage |
|---|---|---|---|
| A | 5882 | 28 | 0.476029% |
| B | 5883 | 271 | 4.606493% |
| C | 5883 | 3902 | 66.326704% |
| D | 5883 | 392 | 6.663267% |
Noise dominated data is calculated using 1-second bins in cleaned event files. If a bin has >2000 counts, and if more than 50% of those come from <1% of pixels, then it is considered to be noise-dominated and hence unusable.
| Quadrant | # 1 sec bins | Bins with >0 counts | Bins with >2000 counts | High rate bins dominated by noise | Noise dominated (total time) | Noise dominated (detector-on time) | Marked lightcurve |
|---|---|---|---|---|---|---|---|
| A | 7152 | 5883 | 0 | 0 | 0.00% | 0.00% | 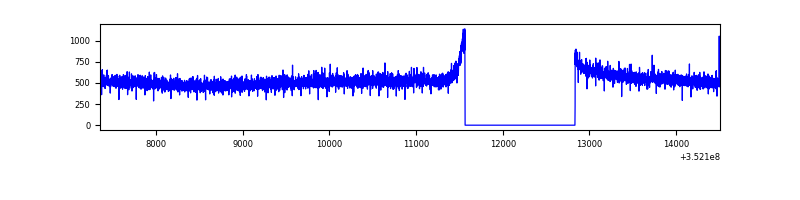 |
| B | 7153 | 5884 | 136 | 136 | 1.90% | 2.31% | 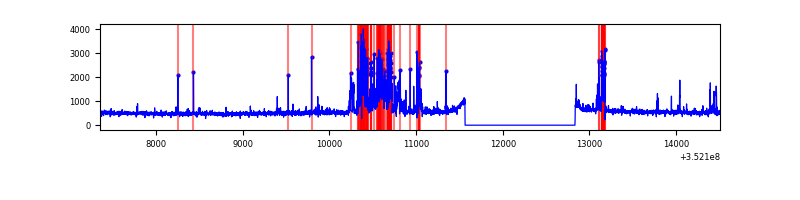 |
| C | 7153 | 5884 | 2600 | 2600 | 36.35% | 44.19% | 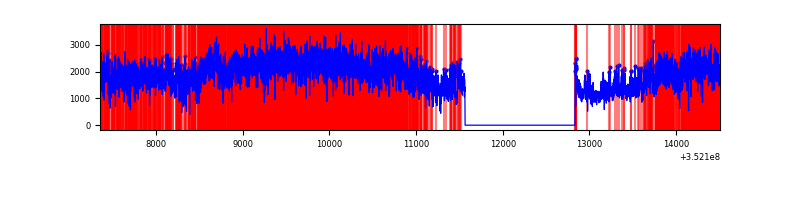 |
| D | 7153 | 5884 | 300 | 300 | 4.19% | 5.10% | 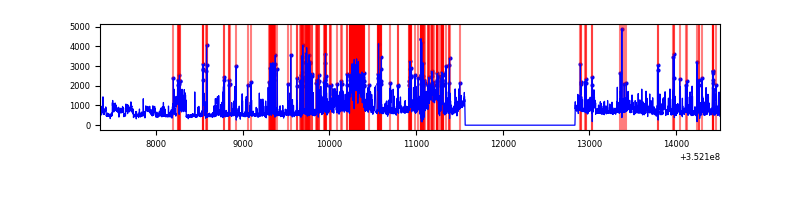 |
Top three noisy pixels from each quadrant. If the there are fewer than three noisy pixels in the level2.evt file, extra rows are filled as -1
| Pixel properties | Quadrant properties | ||||||
|---|---|---|---|---|---|---|---|
| Quadrant | DetID | PixID | Counts | Sigma | Mean | Median | Sigma |
| A | 13 | 254 | 12042 | 71.18 | 800 | 787 | 158.1 |
| A | 0 | 226 | 6901 | 38.67 | 800 | 787 | 158.1 |
| A | 3 | 137 | 6882 | 38.55 | 800 | 787 | 158.1 |
| B | 10 | 245 | 734034 | 4998.85 | 774 | 756 | 146.7 |
| B | 0 | 229 | 21320 | 140.19 | 774 | 756 | 146.7 |
| B | 0 | 190 | 20806 | 136.68 | 774 | 756 | 146.7 |
| C | 3 | 233 | 8458429 | 59277.95 | 620 | 627 | 142.7 |
| C | 14 | 238 | 175133 | 1223.06 | 620 | 627 | 142.7 |
| C | 14 | 254 | 121448 | 846.79 | 620 | 627 | 142.7 |
| D | 1 | 52 | 1574422 | 8838.01 | 761 | 744 | 178.1 |
| D | 8 | 195 | 553824 | 3106.18 | 761 | 744 | 178.1 |
| D | 12 | 233 | 185299 | 1036.49 | 761 | 744 | 178.1 |
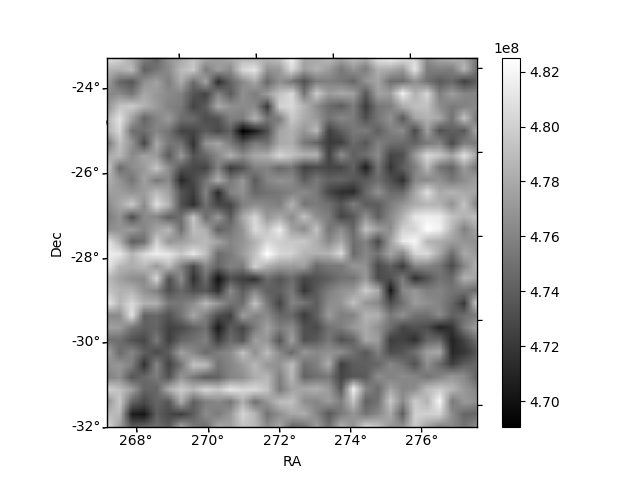
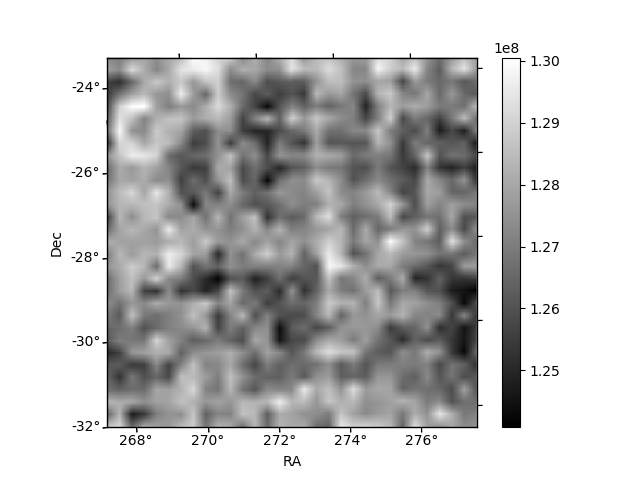
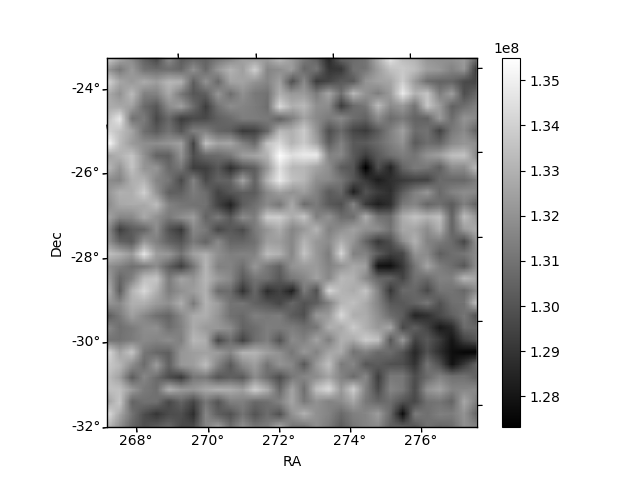
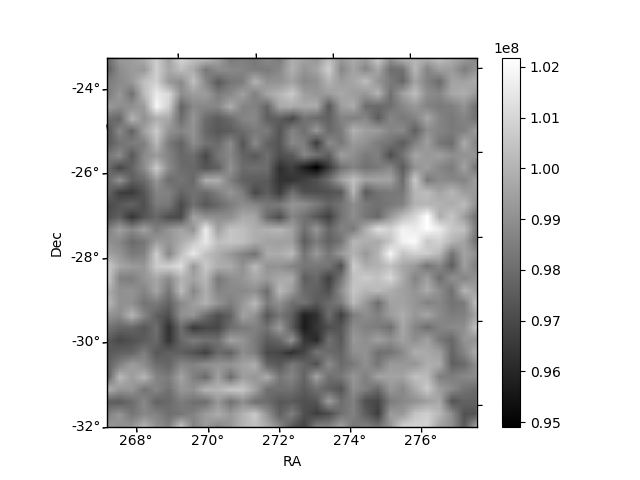
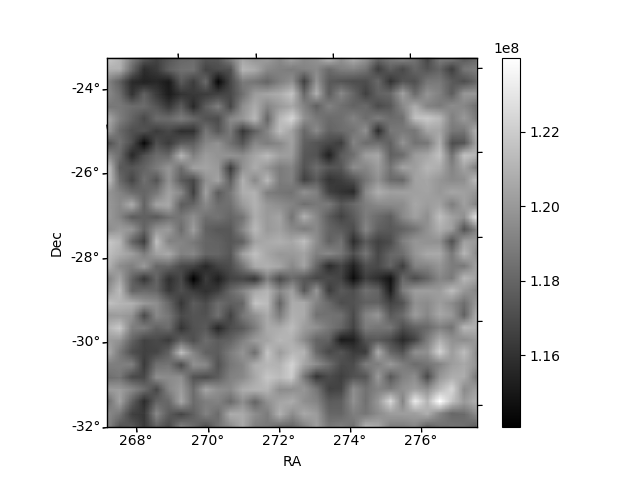
Histogram calculated using DETX and DETY for each event in the final _common_clean file
| Quadrant A | 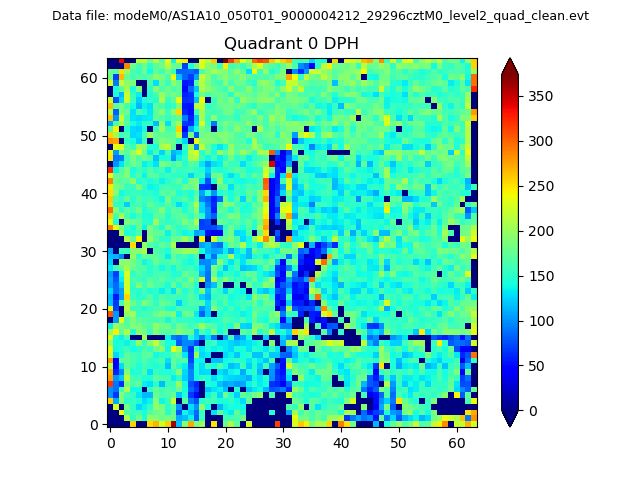 |
 |
Quadrant B |
|---|---|---|---|
| Quadrant D | 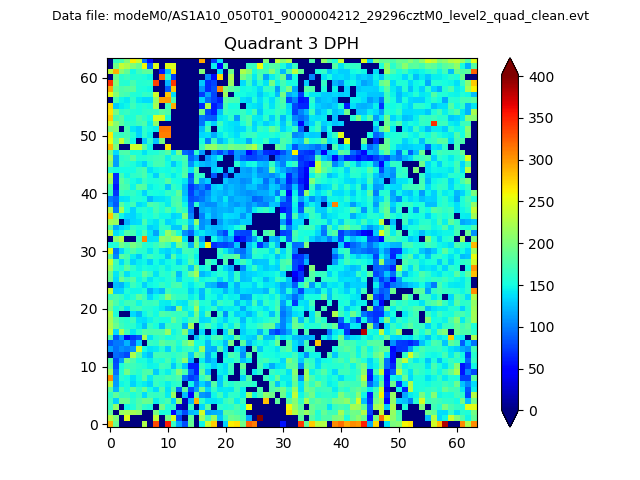 |
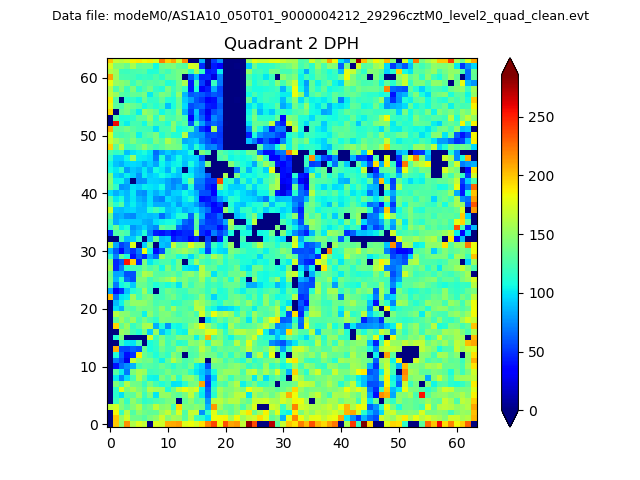 |
Quadrant C |
| Plot type | Count rate plots | Images |
|---|---|---|
| Comparison with Poisson distribution Blue bars denote a histogram of data divided into 1 sec bins. Red curve is a Poisson curve with rate = median count rate of data. |
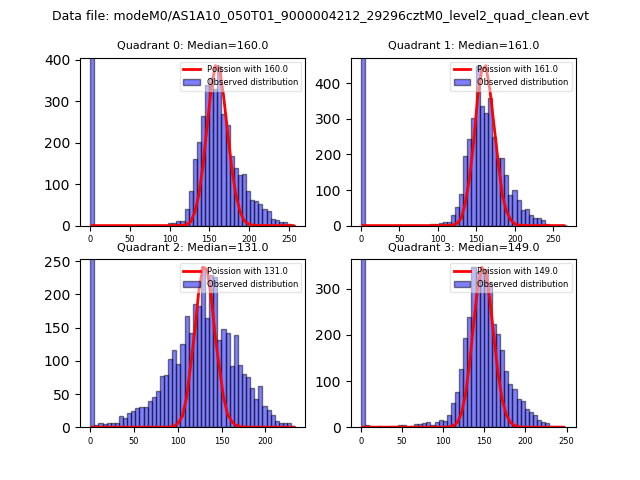 |
 |
| Quadrant-wise count rates Data is divided into 100 sec bins |
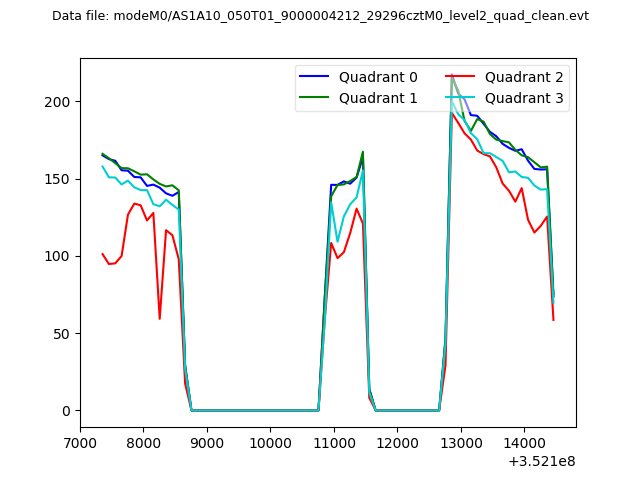 |
|
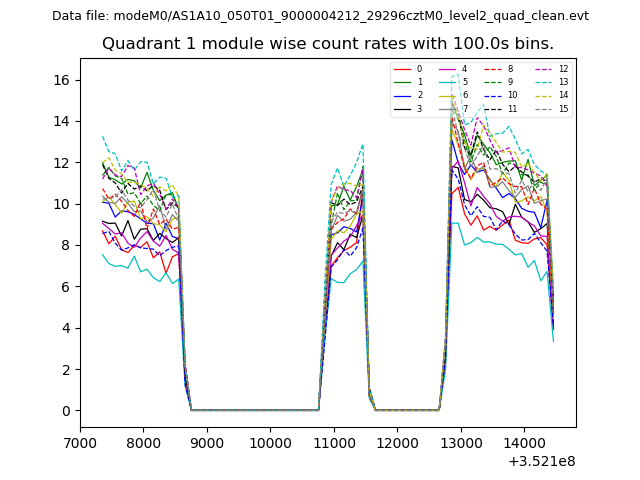
| Module-wise count rates for Quadrant A Data is divided into 100 sec bins |
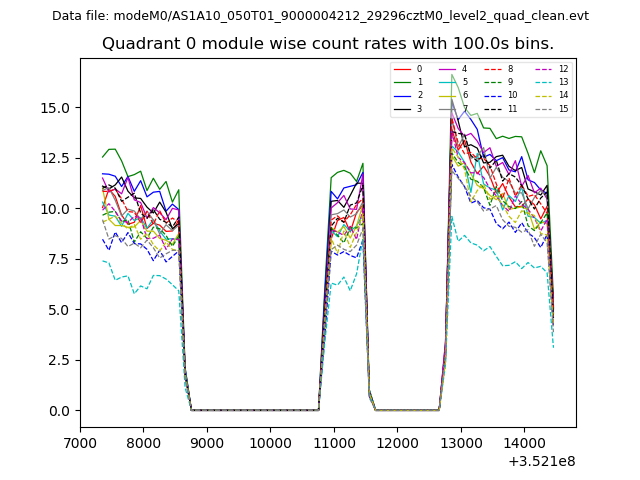 |
 |
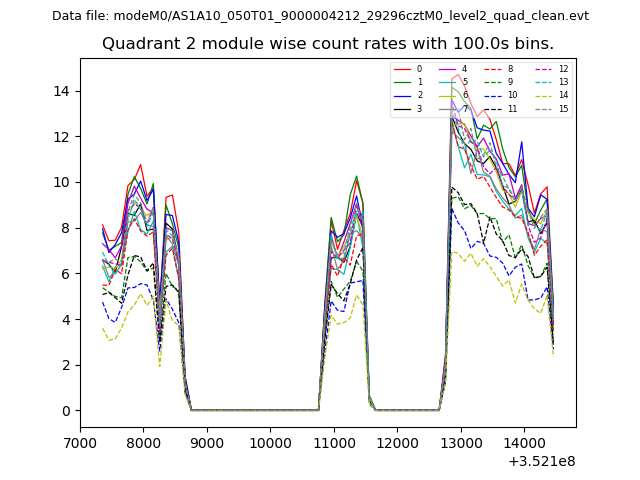
| Module-wise count rates for Quadrant B Data is divided into 100 sec bins |
 |
 |
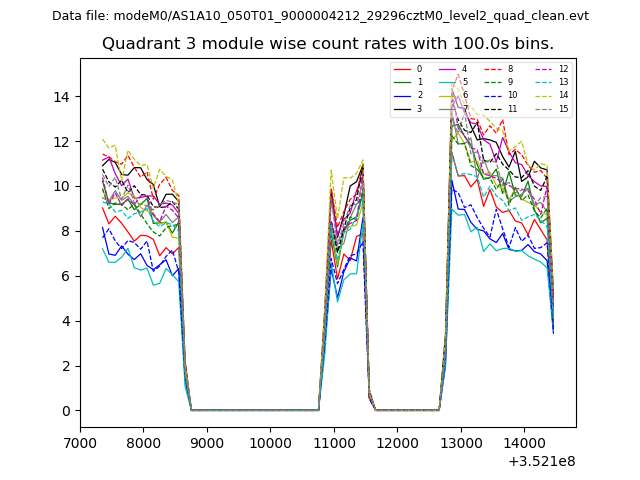
| Module-wise count rates for Quadrant C Data is divided into 100 sec bins |
 |
 |
| Module-wise count rates for Quadrant D Data is divided into 100 sec bins |
 |
 |
| Parameter | Plot |
|---|---|
| CZT HV Monitor | 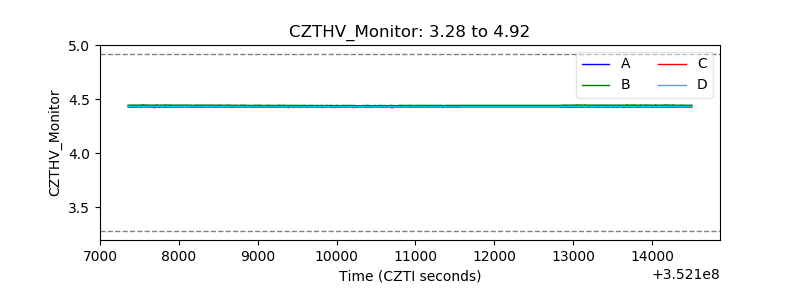 |
| D_VDD | 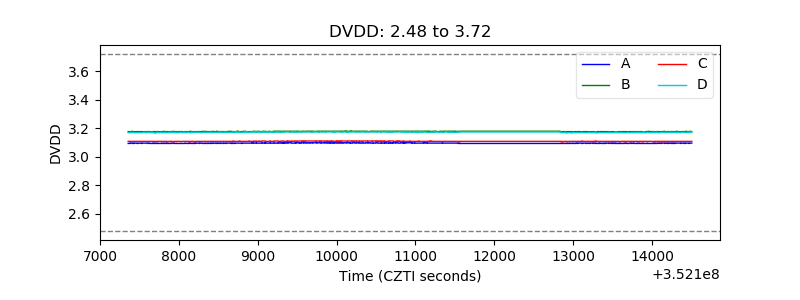 |
| Temperature 1 | 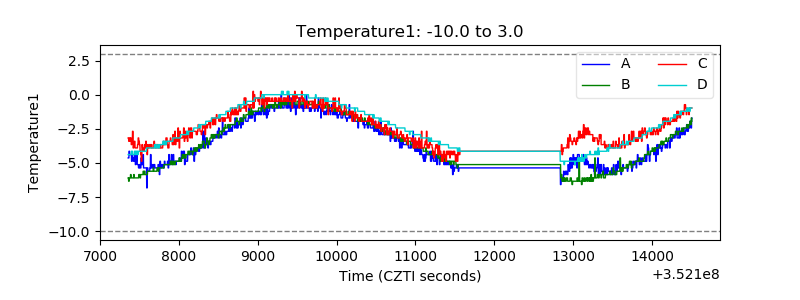 |
| Veto HV Monitor | 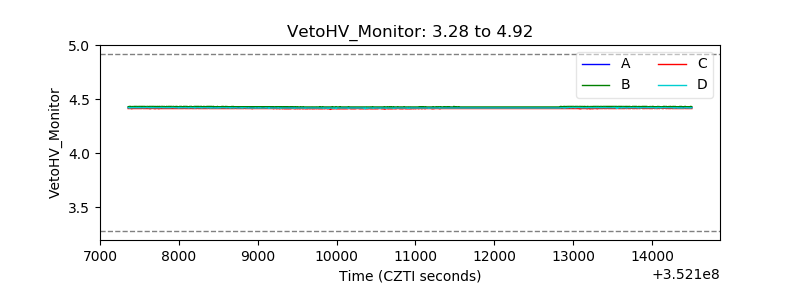 |
| Veto LLD | 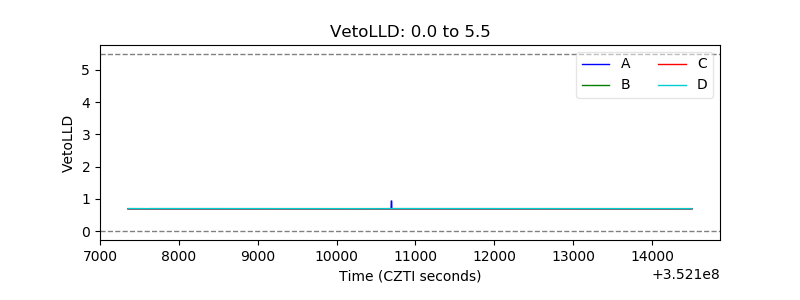 |
| Alpha Counter | 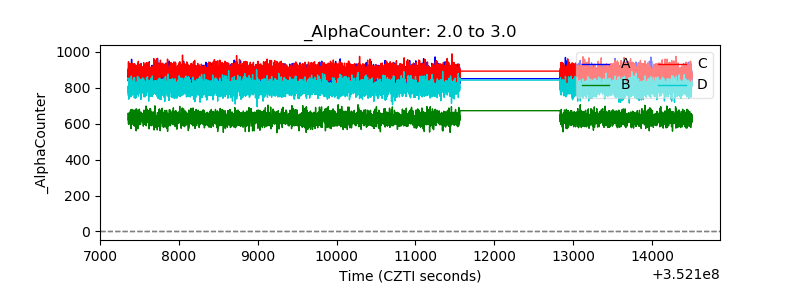 |
| _CPM_Rate | 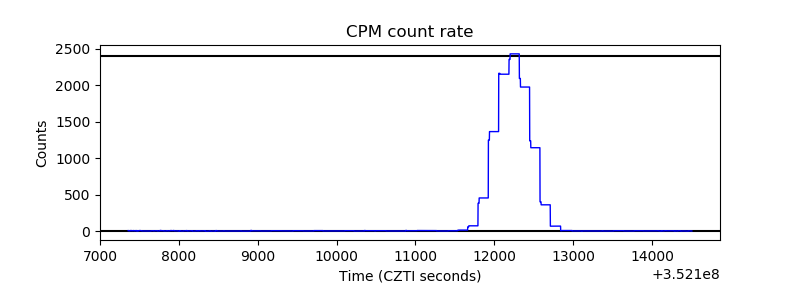 |
| CZT Counter |  |
| +2.5 Volts monitor | 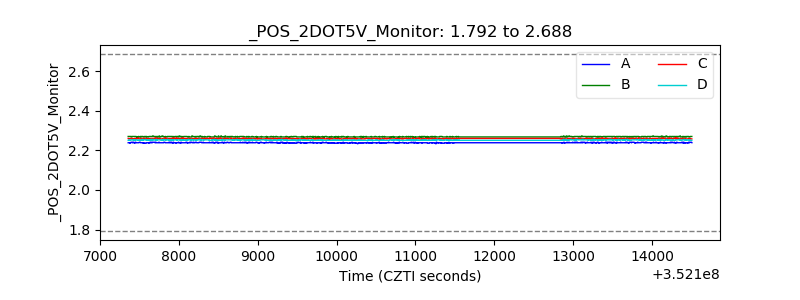 |
| +5 Volts monitor |  |
| _ROLL_ROT | 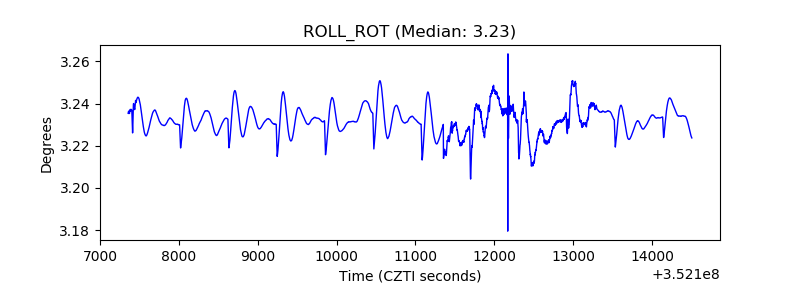 |
| _Roll_DEC | 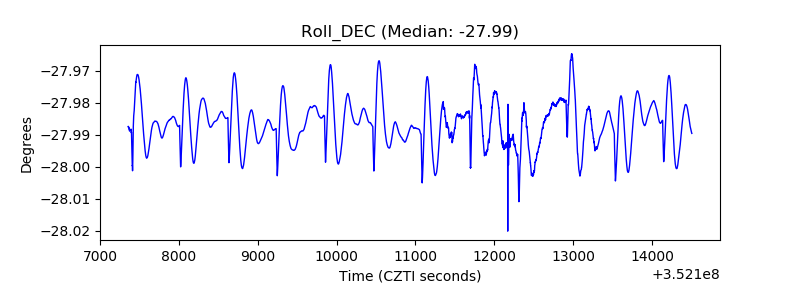 |
| _Roll_RA | 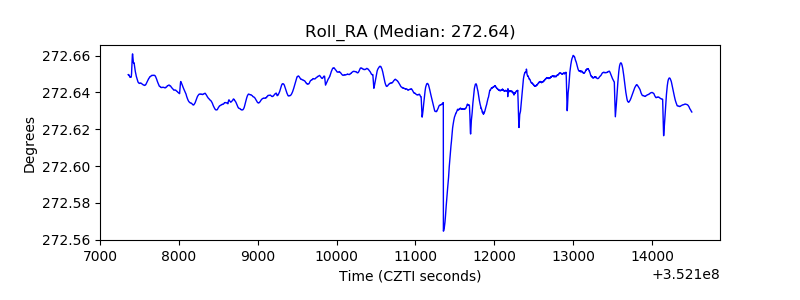 |
| Veto Counter | 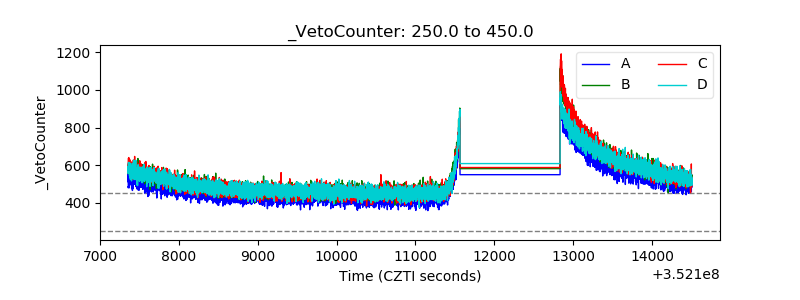 |