| Param | Original file | Final file |
|---|---|---|
| Filename | modeM0/AS1A10_050T01_9000004212_29297cztM0_level2.evt | modeM0/AS1A10_050T01_9000004212_29297cztM0_level2_quad_clean.evt |
| Size (bytes) | 745,871,040 | 75,006,720 |
| Size | 711.3 MB | 71.5 MB |
| Events in quadrant A | 2,888,151 | 511,606 |
| Events in quadrant B | 3,109,469 | 513,983 |
| Events in quadrant C | 9,774,325 | 419,190 |
| Events in quadrant D | 6,455,999 | 451,069 |
| Mode M9 | |||
|---|---|---|---|
| Quadrant | BADHDUFLAG | Total packets | Discarded packets |
| A | 0 | 14 | 0 |
| B | 0 | 14 | 0 |
| C | 0 | 14 | 0 |
| D | 0 | 14 | 0 |
| Mode M0 | |||
|---|---|---|---|
| Quadrant | BADHDUFLAG | Total packets | Discarded packets |
| A | 0 | 11526 | 1 |
| B | 0 | 12355 | 1 |
| C | 0 | 32737 | 5 |
| D | 0 | 23009 | 1 |
| Mode SS | |||
|---|---|---|---|
| Quadrant | BADHDUFLAG | Total packets | Discarded packets |
| A | 0 | 108 | 0 |
| B | 0 | 108 | 0 |
| C | 0 | 108 | 0 |
| D | 0 | 108 | 0 |
| Quadrant | Total seconds | Saturated seconds | Saturation percentage |
|---|---|---|---|
| A | 5354 | 37 | 0.691072% |
| B | 5355 | 90 | 1.680672% |
| C | 5354 | 3109 | 58.068734% |
| D | 5354 | 722 | 13.485245% |
Noise dominated data is calculated using 1-second bins in cleaned event files. If a bin has >2000 counts, and if more than 50% of those come from <1% of pixels, then it is considered to be noise-dominated and hence unusable.
| Quadrant | # 1 sec bins | Bins with >0 counts | Bins with >2000 counts | High rate bins dominated by noise | Noise dominated (total time) | Noise dominated (detector-on time) | Marked lightcurve |
|---|---|---|---|---|---|---|---|
| A | 6679 | 5355 | 0 | 0 | 0.00% | 0.00% |  |
| B | 6680 | 5356 | 11 | 11 | 0.16% | 0.21% |  |
| C | 6679 | 5355 | 2269 | 2269 | 33.97% | 42.37% |  |
| D | 6679 | 5355 | 551 | 551 | 8.25% | 10.29% |  |
Top three noisy pixels from each quadrant. If the there are fewer than three noisy pixels in the level2.evt file, extra rows are filled as -1
| Pixel properties | Quadrant properties | ||||||
|---|---|---|---|---|---|---|---|
| Quadrant | DetID | PixID | Counts | Sigma | Mean | Median | Sigma |
| A | 13 | 254 | 11186 | 70.95 | 746 | 734 | 147.3 |
| A | 5 | 98 | 8187 | 50.59 | 746 | 734 | 147.3 |
| A | 0 | 226 | 6373 | 38.28 | 746 | 734 | 147.3 |
| B | 10 | 245 | 164162 | 1198.93 | 728 | 716 | 136.3 |
| B | 0 | 229 | 33246 | 238.62 | 728 | 716 | 136.3 |
| B | 0 | 190 | 21128 | 149.73 | 728 | 716 | 136.3 |
| C | 3 | 233 | 7318319 | 53943.99 | 583 | 588 | 135.7 |
| C | 14 | 238 | 121581 | 891.92 | 583 | 588 | 135.7 |
| C | 14 | 254 | 46646 | 339.52 | 583 | 588 | 135.7 |
| D | 1 | 52 | 2050524 | 12642.56 | 690 | 673 | 162.1 |
| D | 8 | 195 | 1064996 | 6564.26 | 690 | 673 | 162.1 |
| D | 7 | 69 | 196746 | 1209.29 | 690 | 673 | 162.1 |
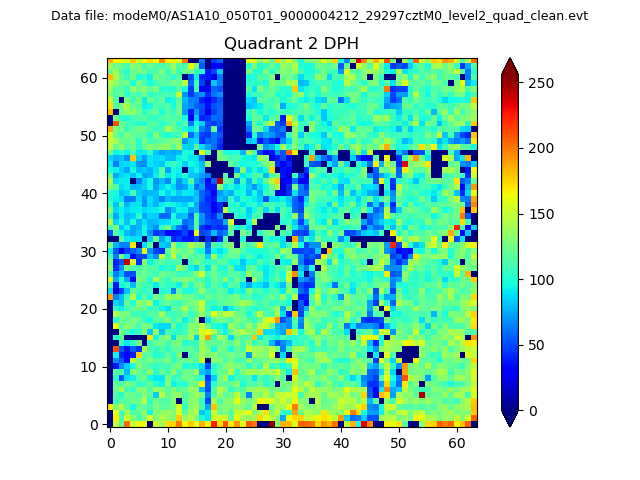
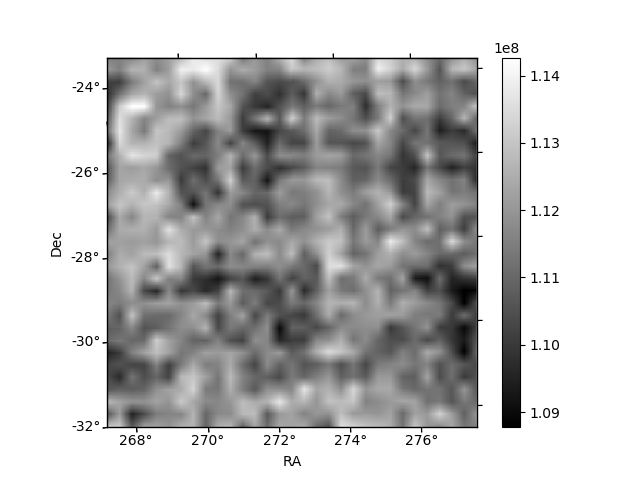
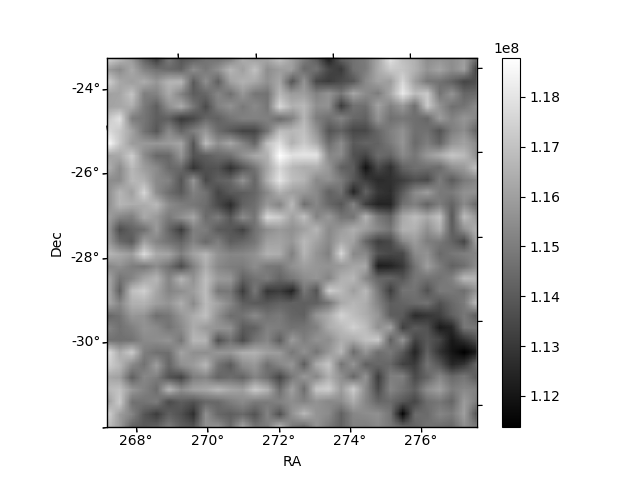
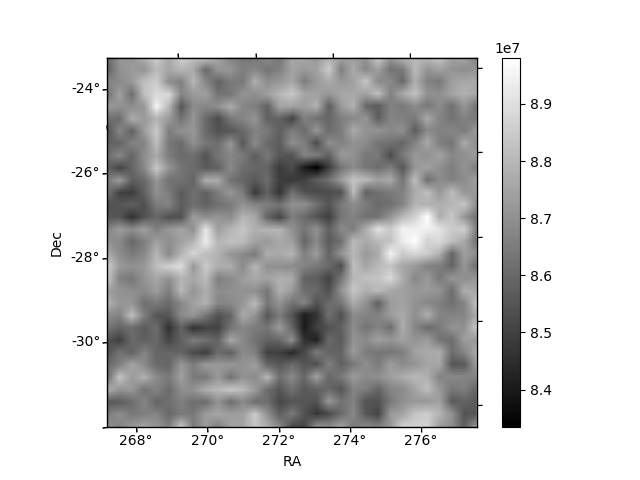
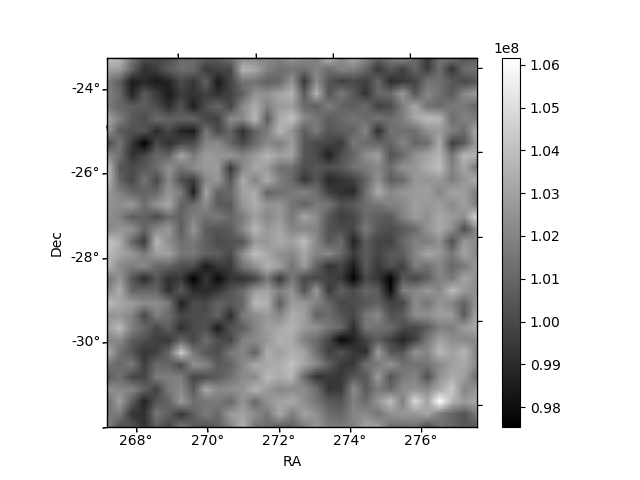
Histogram calculated using DETX and DETY for each event in the final _common_clean file
| Quadrant A | 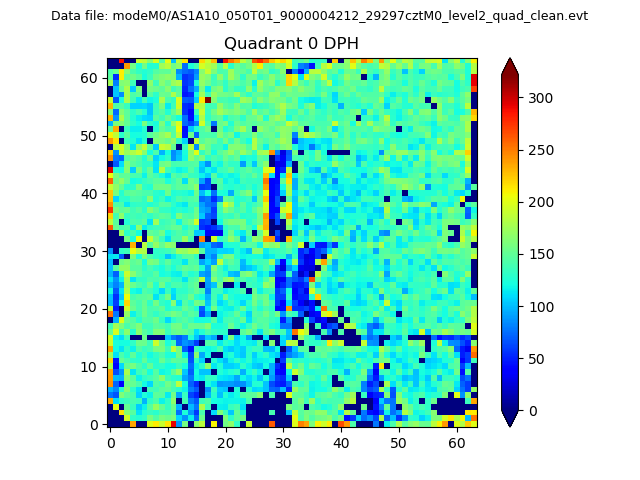 |
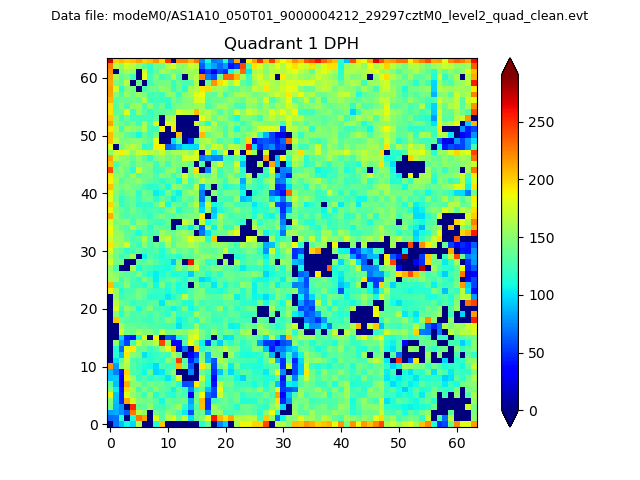 |
Quadrant B |
|---|---|---|---|
| Quadrant D | 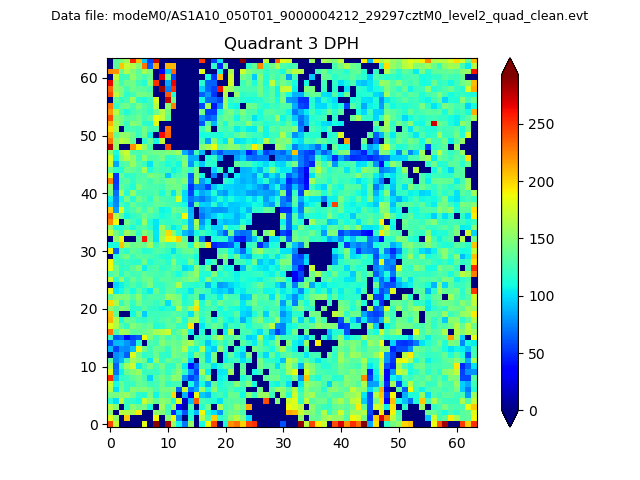 |
 |
Quadrant C |
| Plot type | Count rate plots | Images |
|---|---|---|
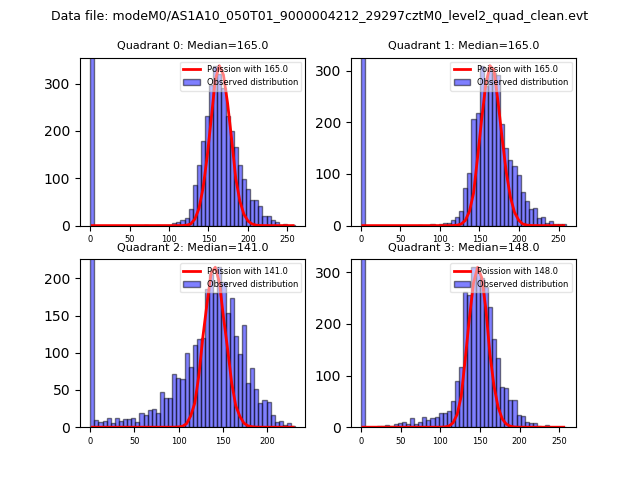
| Comparison with Poisson distribution Blue bars denote a histogram of data divided into 1 sec bins. Red curve is a Poisson curve with rate = median count rate of data. |
 |
 |
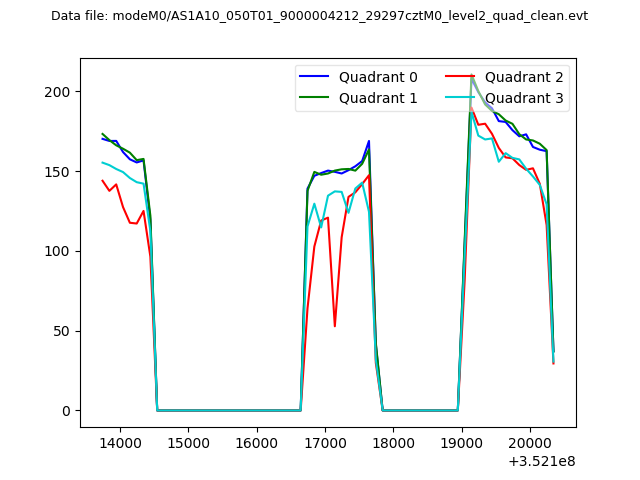
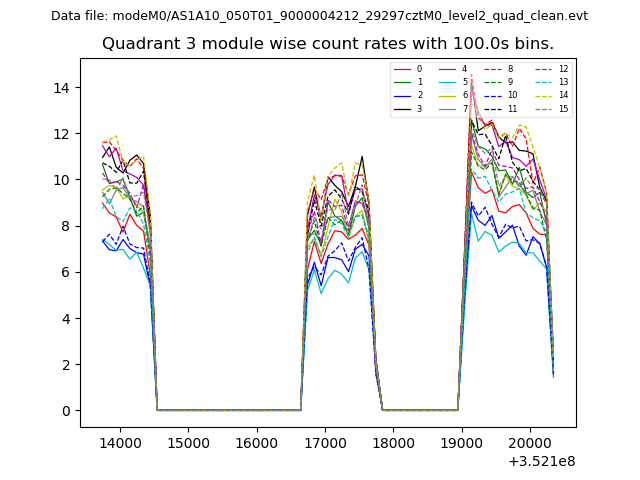
| Quadrant-wise count rates Data is divided into 100 sec bins |
 |
|
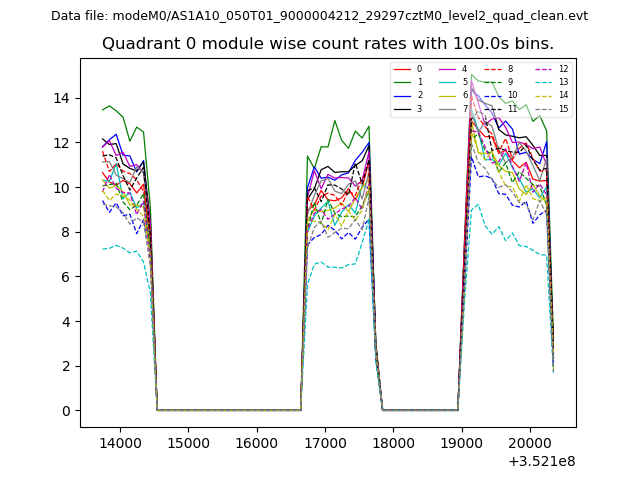
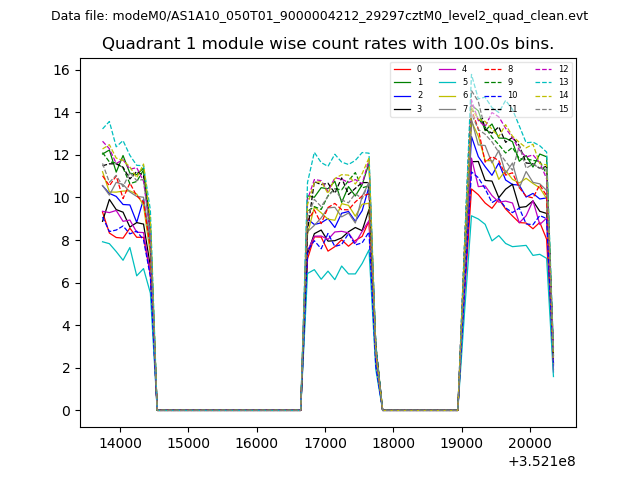
| Module-wise count rates for Quadrant A Data is divided into 100 sec bins |
 |
 |
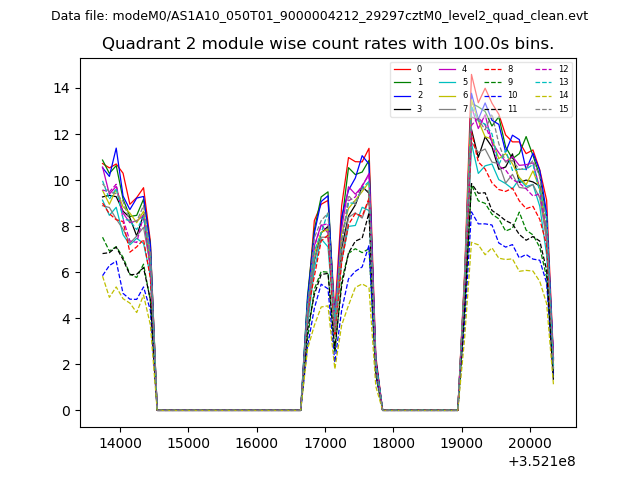
| Module-wise count rates for Quadrant B Data is divided into 100 sec bins |
 |
 |
| Module-wise count rates for Quadrant C Data is divided into 100 sec bins |
 |
 |
| Module-wise count rates for Quadrant D Data is divided into 100 sec bins |
 |
 |
| Parameter | Plot |
|---|---|
| CZT HV Monitor | 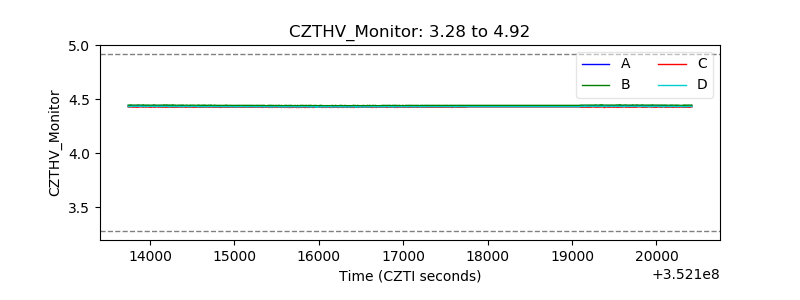 |
| D_VDD | 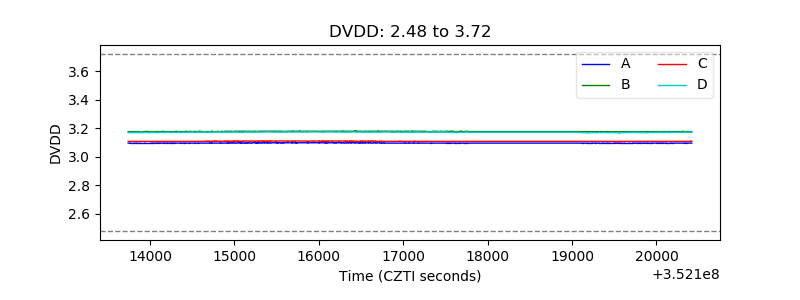 |
| Temperature 1 | 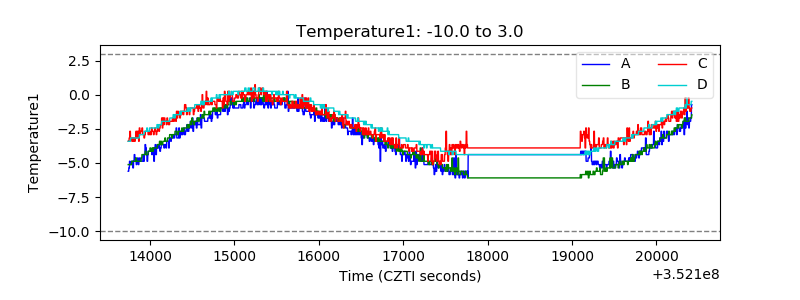 |
| Veto HV Monitor | 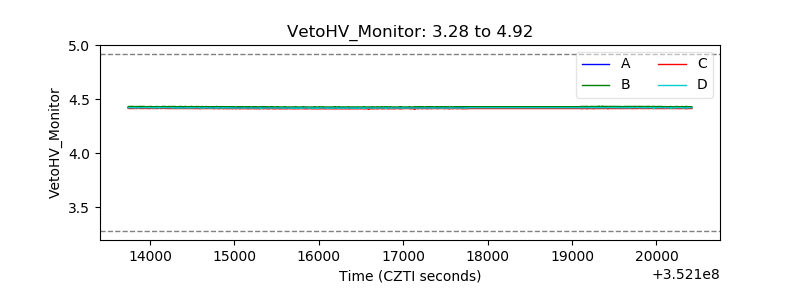 |
| Veto LLD | 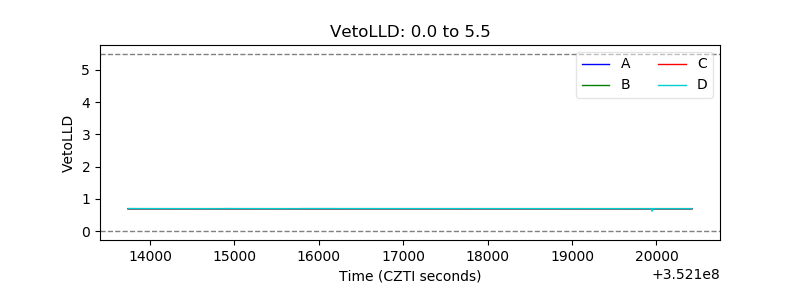 |
| Alpha Counter | 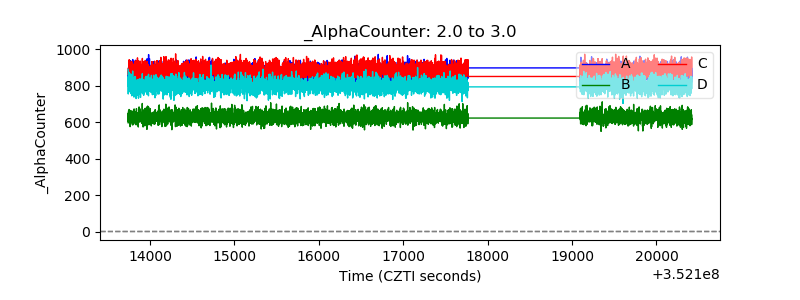 |
| _CPM_Rate | 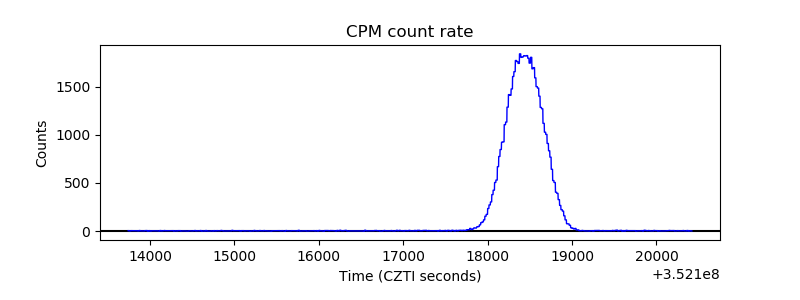 |
| CZT Counter | 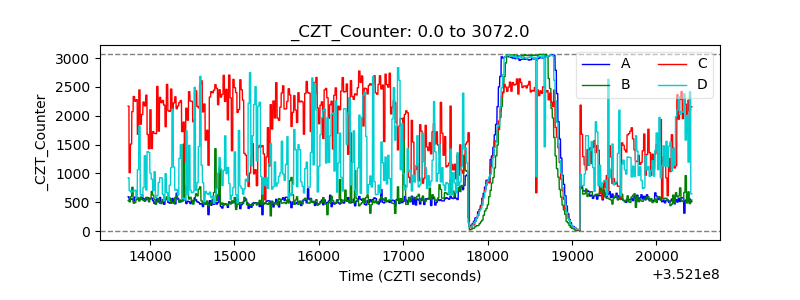 |
| +2.5 Volts monitor |  |
| +5 Volts monitor |  |
| _ROLL_ROT | 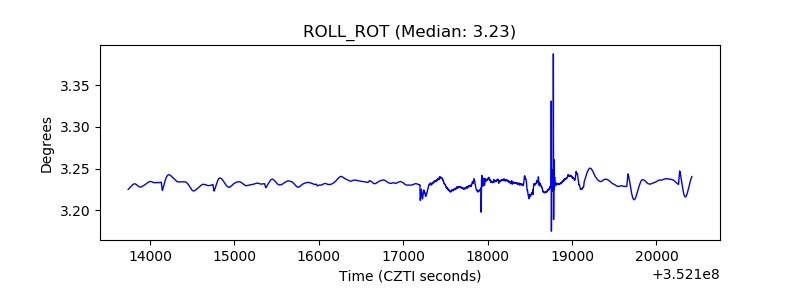 |
| _Roll_DEC | 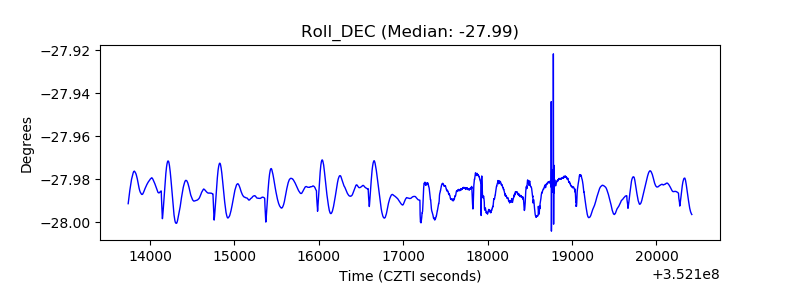 |
| _Roll_RA | 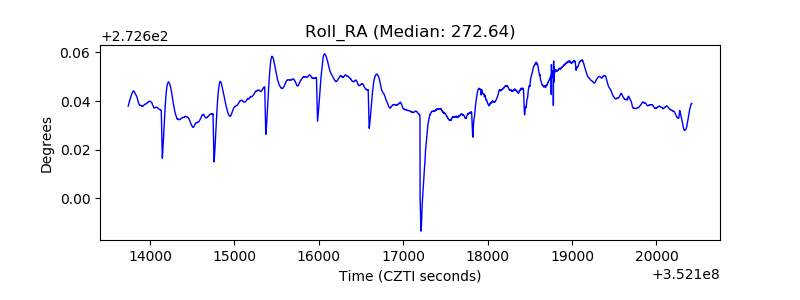 |
| Veto Counter | 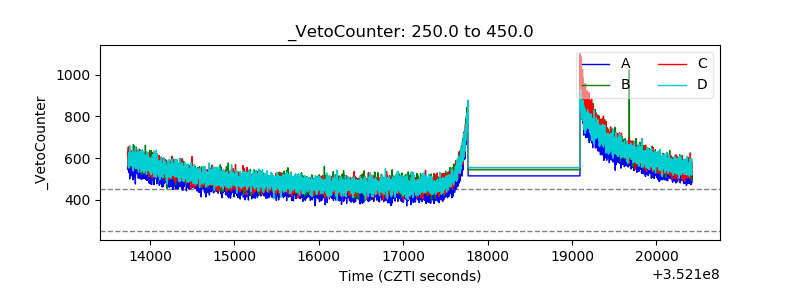 |