| Param | Original file | Final file |
|---|---|---|
| Filename | modeM0/AS1A10_050T01_9000004212_29298cztM0_level2.evt | modeM0/AS1A10_050T01_9000004212_29298cztM0_level2_quad_clean.evt |
| Size (bytes) | 768,957,120 | 75,093,120 |
| Size | 733.3 MB | 71.6 MB |
| Events in quadrant A | 3,273,070 | 495,190 |
| Events in quadrant B | 3,401,424 | 496,554 |
| Events in quadrant C | 7,701,688 | 418,449 |
| Events in quadrant D | 8,500,231 | 437,115 |
| Mode M9 | |||
|---|---|---|---|
| Quadrant | BADHDUFLAG | Total packets | Discarded packets |
| A | 0 | 13 | 0 |
| B | 0 | 13 | 0 |
| C | 0 | 13 | 0 |
| D | 0 | 13 | 0 |
| Mode M0 | |||
|---|---|---|---|
| Quadrant | BADHDUFLAG | Total packets | Discarded packets |
| A | 0 | 13005 | 1 |
| B | 0 | 13517 | 1 |
| C | 0 | 27281 | 1 |
| D | 0 | 29604 | 3 |
| Mode SS | |||
|---|---|---|---|
| Quadrant | BADHDUFLAG | Total packets | Discarded packets |
| A | 0 | 122 | 0 |
| B | 0 | 122 | 0 |
| C | 0 | 122 | 0 |
| D | 0 | 122 | 0 |
| Quadrant | Total seconds | Saturated seconds | Saturation percentage |
|---|---|---|---|
| A | 6108 | 83 | 1.358874% |
| B | 6108 | 91 | 1.489849% |
| C | 6109 | 2120 | 34.702897% |
| D | 6108 | 1451 | 23.755730% |
Noise dominated data is calculated using 1-second bins in cleaned event files. If a bin has >2000 counts, and if more than 50% of those come from <1% of pixels, then it is considered to be noise-dominated and hence unusable.
| Quadrant | # 1 sec bins | Bins with >0 counts | Bins with >2000 counts | High rate bins dominated by noise | Noise dominated (total time) | Noise dominated (detector-on time) | Marked lightcurve |
|---|---|---|---|---|---|---|---|
| A | 7363 | 6109 | 0 | 0 | 0.00% | 0.00% | 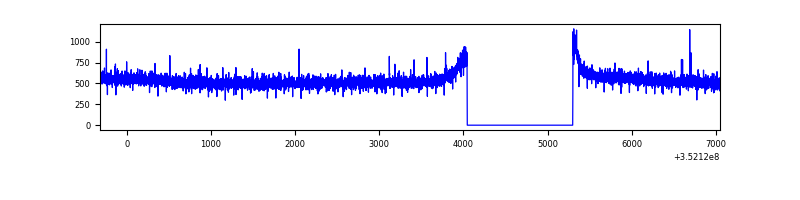 |
| B | 7363 | 6109 | 3 | 3 | 0.04% | 0.05% | 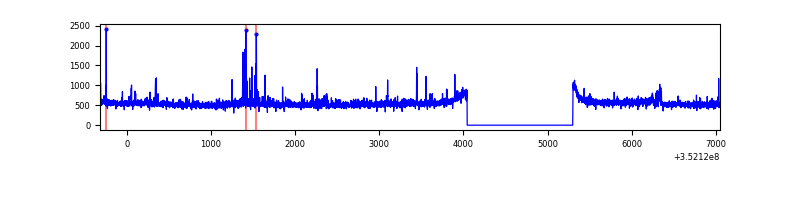 |
| C | 7364 | 6110 | 584 | 584 | 7.93% | 9.56% | 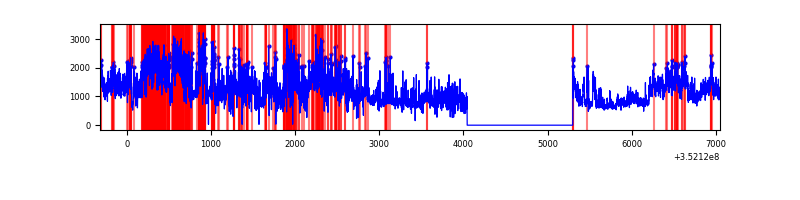 |
| D | 7363 | 6109 | 1229 | 1229 | 16.69% | 20.12% | 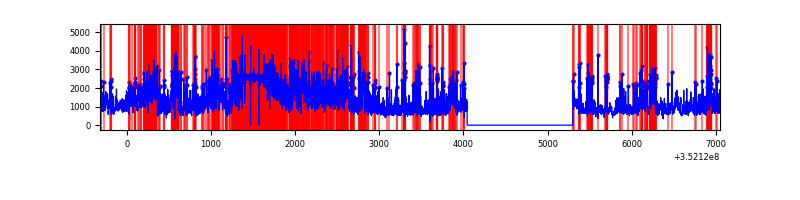 |
Top three noisy pixels from each quadrant. If the there are fewer than three noisy pixels in the level2.evt file, extra rows are filled as -1
| Pixel properties | Quadrant properties | ||||||
|---|---|---|---|---|---|---|---|
| Quadrant | DetID | PixID | Counts | Sigma | Mean | Median | Sigma |
| A | 13 | 254 | 13343 | 74.6 | 847 | 832 | 167.7 |
| A | 0 | 226 | 7354 | 38.89 | 847 | 832 | 167.7 |
| A | 3 | 137 | 7131 | 37.56 | 847 | 832 | 167.7 |
| B | 10 | 245 | 44228 | 280.1 | 827 | 809 | 155.0 |
| B | 5 | 172 | 39923 | 252.33 | 827 | 809 | 155.0 |
| B | 0 | 229 | 24934 | 155.63 | 827 | 809 | 155.0 |
| C | 3 | 233 | 4356590 | 27552.72 | 691 | 697 | 158.1 |
| C | 14 | 238 | 314402 | 1984.31 | 691 | 697 | 158.1 |
| C | 14 | 254 | 308344 | 1945.99 | 691 | 697 | 158.1 |
| D | 1 | 52 | 1966818 | 11330.4 | 737 | 721 | 173.5 |
| D | 8 | 195 | 1652445 | 9518.7 | 737 | 721 | 173.5 |
| D | 12 | 233 | 1459335 | 8405.83 | 737 | 721 | 173.5 |
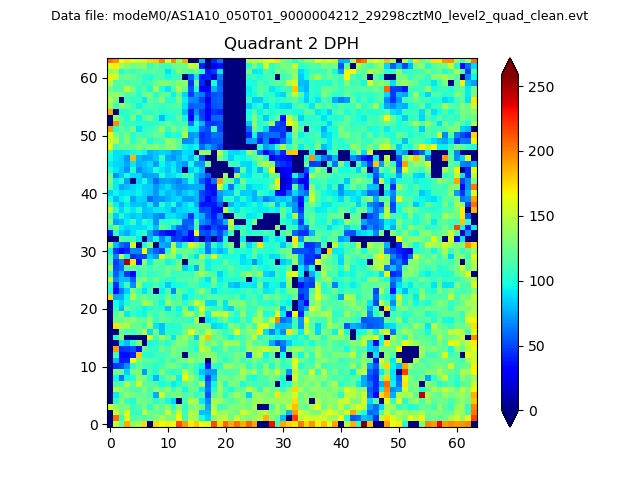
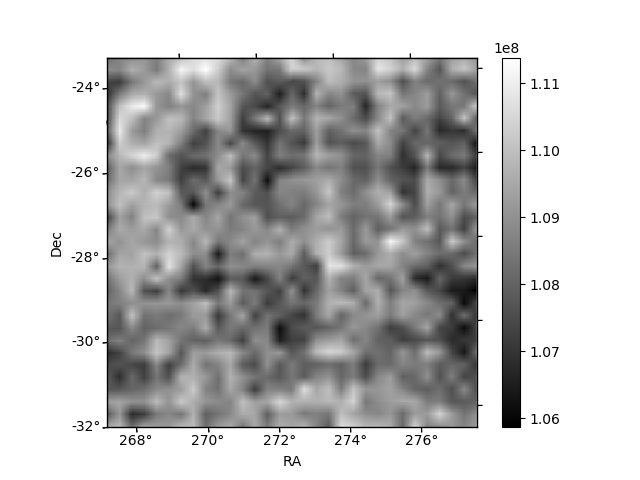
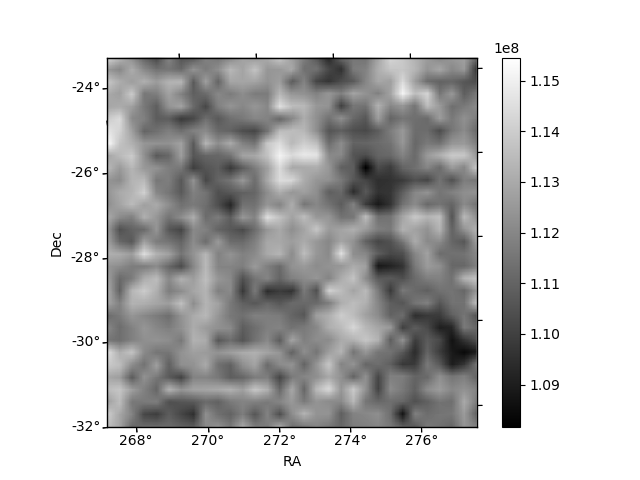
Histogram calculated using DETX and DETY for each event in the final _common_clean file
| Quadrant A | 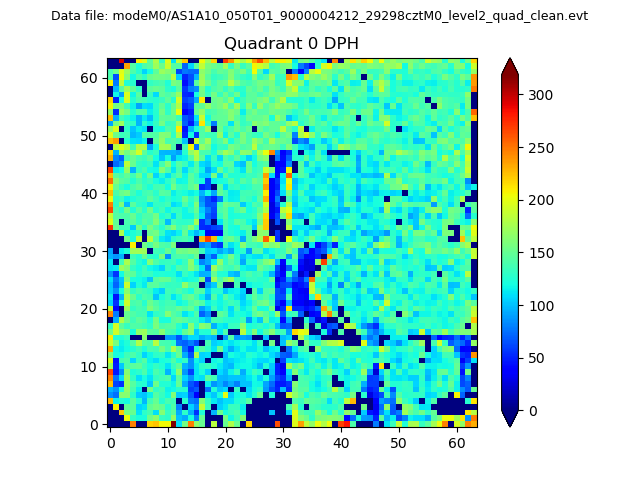 |
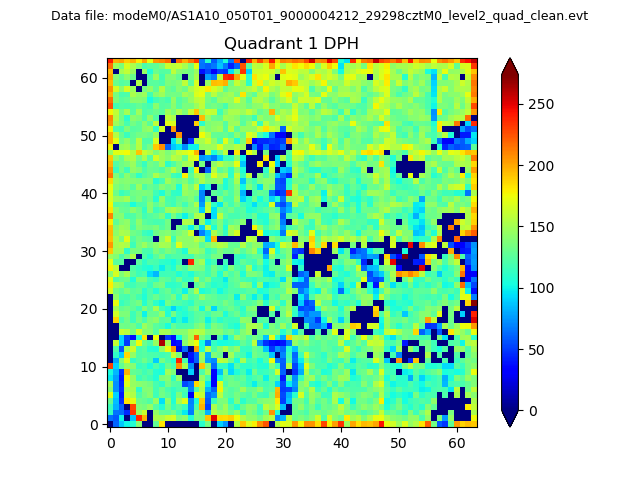 |
Quadrant B |
|---|---|---|---|
| Quadrant D | 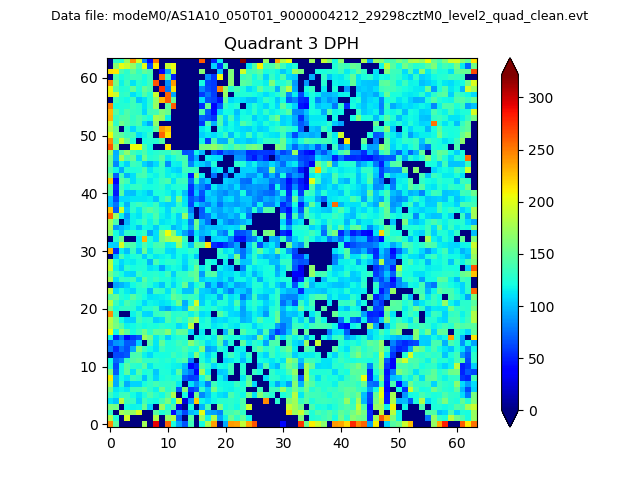 |
 |
Quadrant C |
| Plot type | Count rate plots | Images |
|---|---|---|
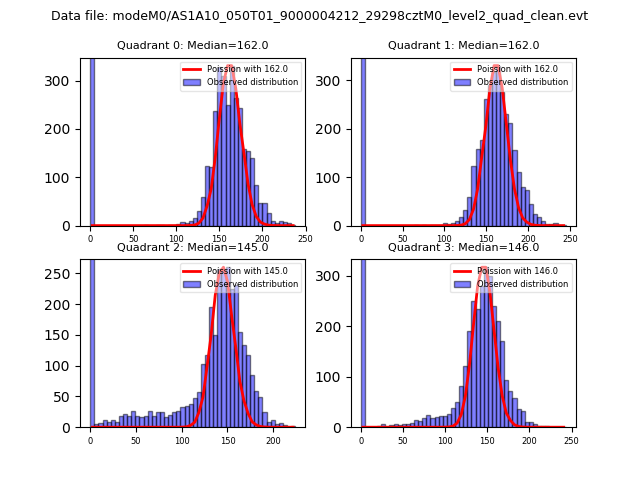
| Comparison with Poisson distribution Blue bars denote a histogram of data divided into 1 sec bins. Red curve is a Poisson curve with rate = median count rate of data. |
 |
 |
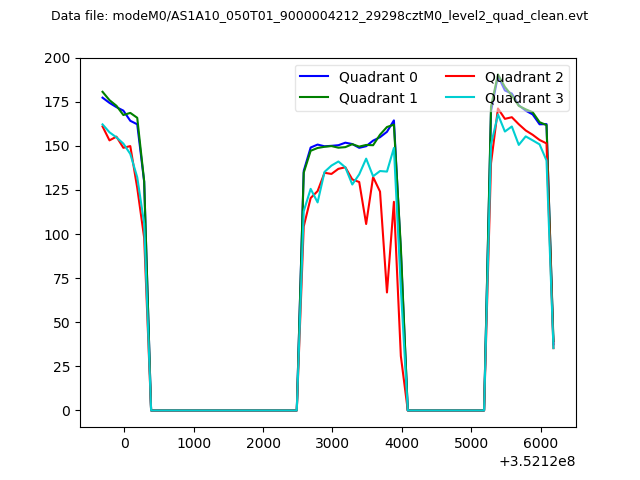
| Quadrant-wise count rates Data is divided into 100 sec bins |
 |
|
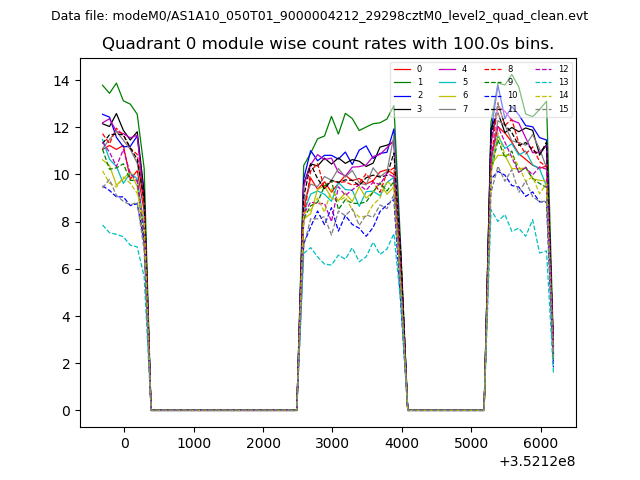
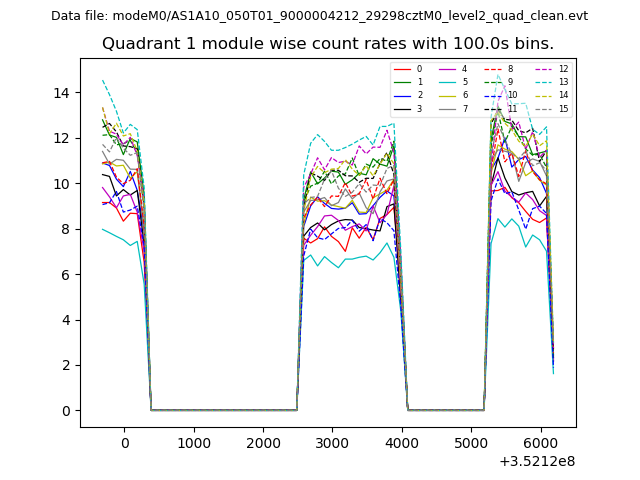
| Module-wise count rates for Quadrant A Data is divided into 100 sec bins |
 |
 |
| Module-wise count rates for Quadrant B Data is divided into 100 sec bins |
 |
 |
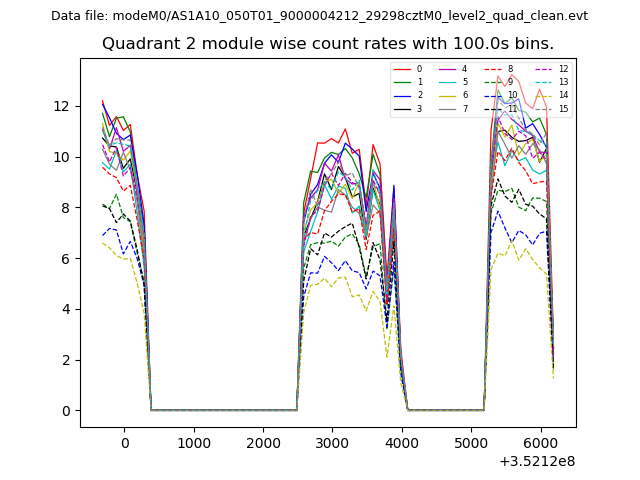
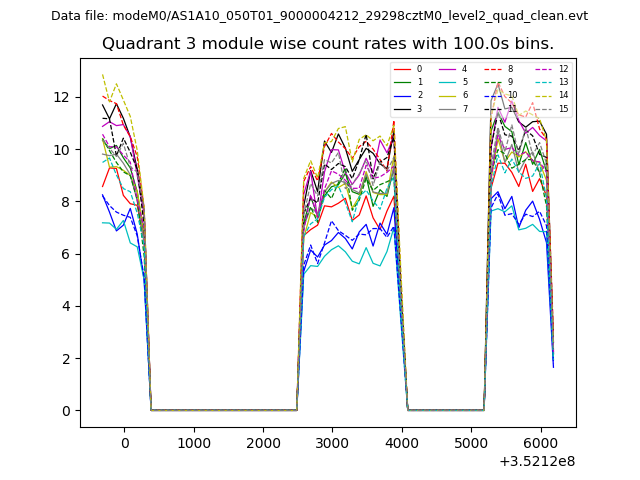
| Module-wise count rates for Quadrant C Data is divided into 100 sec bins |
 |
 |
| Module-wise count rates for Quadrant D Data is divided into 100 sec bins |
 |
 |
| Parameter | Plot |
|---|---|
| CZT HV Monitor | 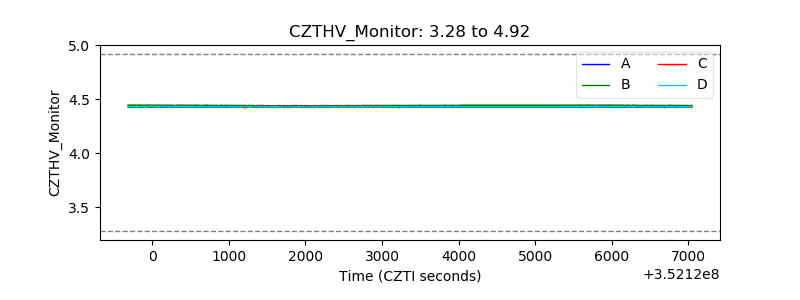 |
| D_VDD | 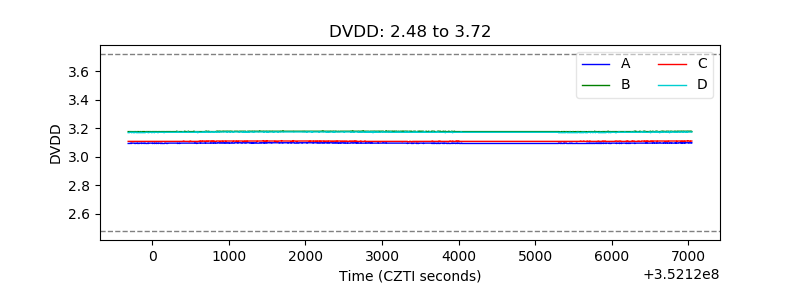 |
| Temperature 1 | 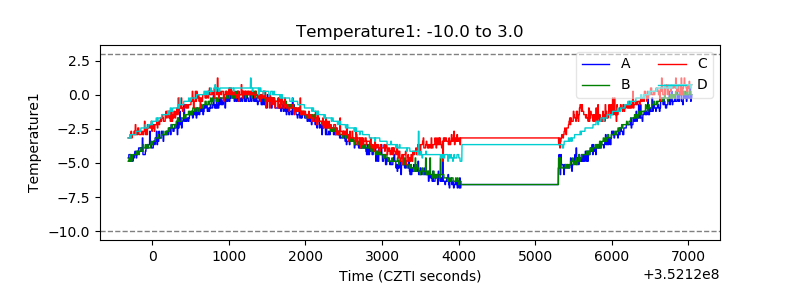 |
| Veto HV Monitor | 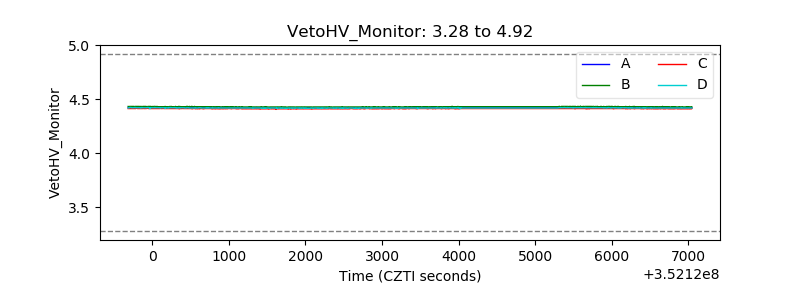 |
| Veto LLD | 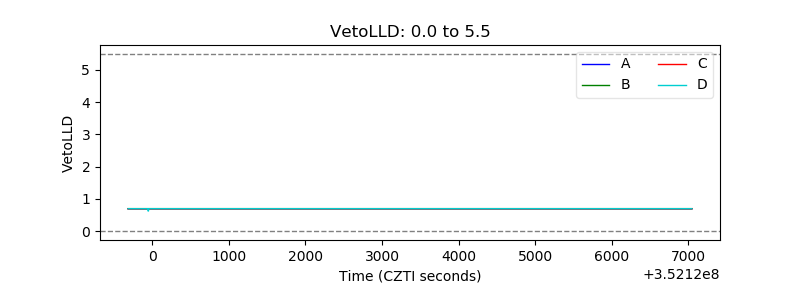 |
| Alpha Counter | 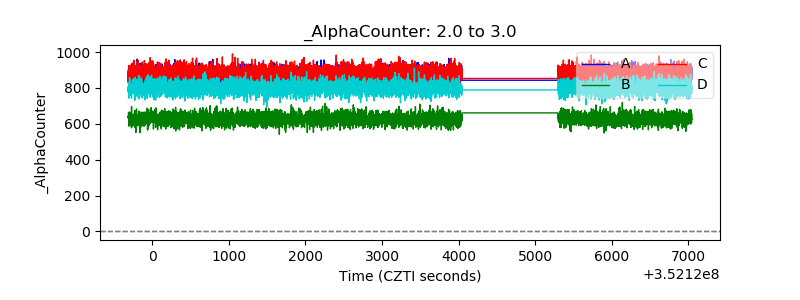 |
| _CPM_Rate | 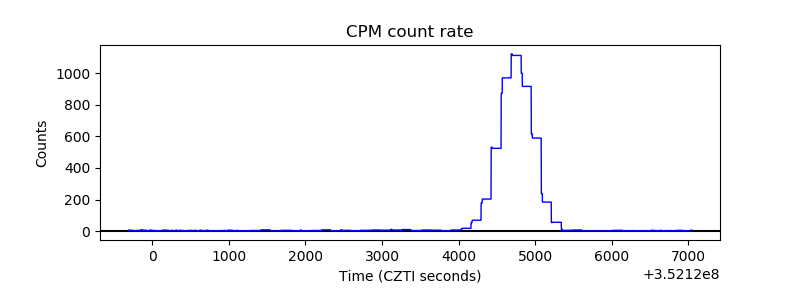 |
| CZT Counter | 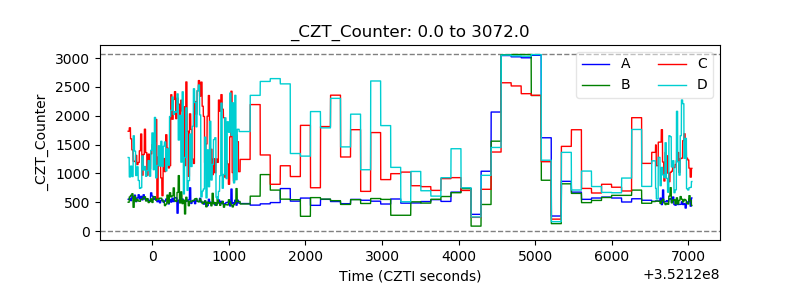 |
| +2.5 Volts monitor |  |
| +5 Volts monitor | 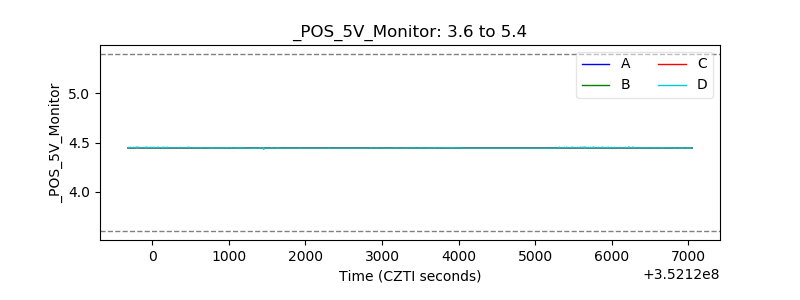 |
| _ROLL_ROT | 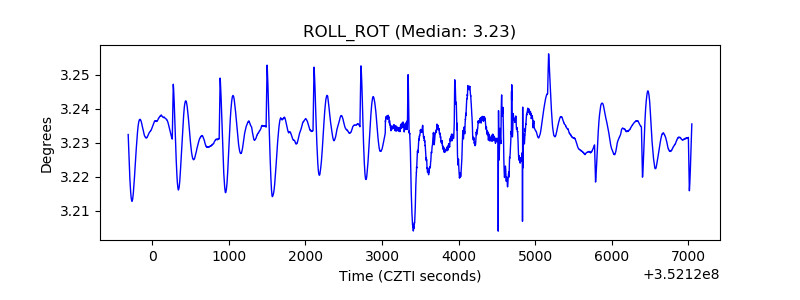 |
| _Roll_DEC | 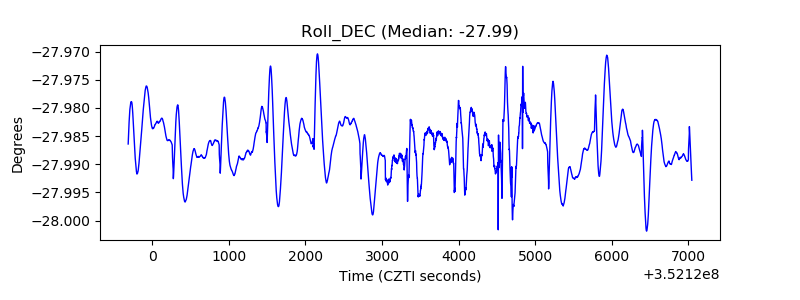 |
| _Roll_RA | 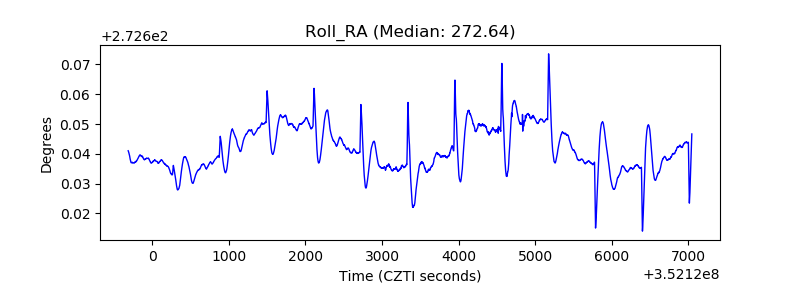 |
| Veto Counter | 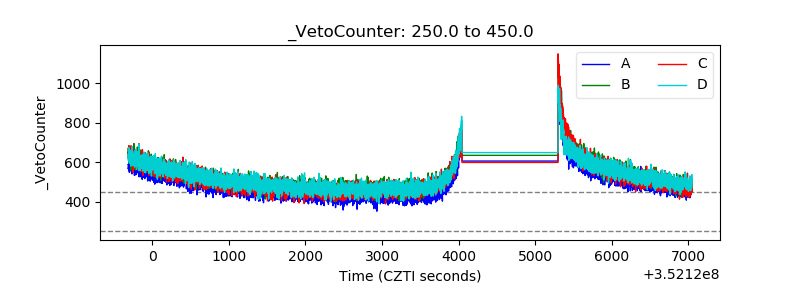 |