| Param | Original file | Final file |
|---|---|---|
| Filename | modeM0/AS1A10_050T01_9000004212_29299cztM0_level2.evt | modeM0/AS1A10_050T01_9000004212_29299cztM0_level2_quad_clean.evt |
| Size (bytes) | 837,720,000 | 69,402,240 |
| Size | 798.9 MB | 66.2 MB |
| Events in quadrant A | 3,304,565 | 455,054 |
| Events in quadrant B | 3,433,356 | 457,347 |
| Events in quadrant C | 11,983,695 | 328,913 |
| Events in quadrant D | 6,219,675 | 415,381 |
| Mode M9 | |||
|---|---|---|---|
| Quadrant | BADHDUFLAG | Total packets | Discarded packets |
| A | 0 | 11 | 0 |
| B | 0 | 11 | 0 |
| C | 0 | 11 | 0 |
| D | 0 | 11 | 0 |
| Mode M0 | |||
|---|---|---|---|
| Quadrant | BADHDUFLAG | Total packets | Discarded packets |
| A | 0 | 13303 | 1 |
| B | 0 | 13767 | 1 |
| C | 0 | 40004 | 1 |
| D | 0 | 23105 | 1 |
| Mode SS | |||
|---|---|---|---|
| Quadrant | BADHDUFLAG | Total packets | Discarded packets |
| A | 0 | 130 | 0 |
| B | 0 | 130 | 0 |
| C | 0 | 130 | 0 |
| D | 0 | 130 | 0 |
| Quadrant | Total seconds | Saturated seconds | Saturation percentage |
|---|---|---|---|
| A | 6356 | 92 | 1.447451% |
| B | 6357 | 121 | 1.903414% |
| C | 6357 | 3865 | 60.799119% |
| D | 6357 | 436 | 6.858581% |
Noise dominated data is calculated using 1-second bins in cleaned event files. If a bin has >2000 counts, and if more than 50% of those come from <1% of pixels, then it is considered to be noise-dominated and hence unusable.
| Quadrant | # 1 sec bins | Bins with >0 counts | Bins with >2000 counts | High rate bins dominated by noise | Noise dominated (total time) | Noise dominated (detector-on time) | Marked lightcurve |
|---|---|---|---|---|---|---|---|
| A | 7466 | 6358 | 0 | 0 | 0.00% | 0.00% | 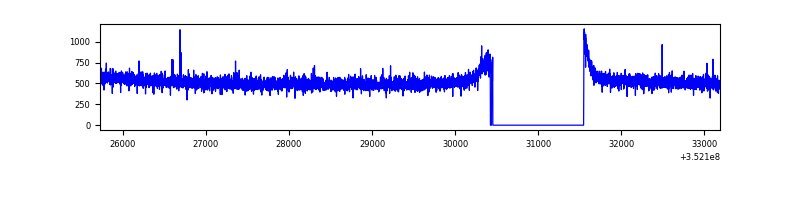 |
| B | 7467 | 6359 | 2 | 2 | 0.03% | 0.03% | 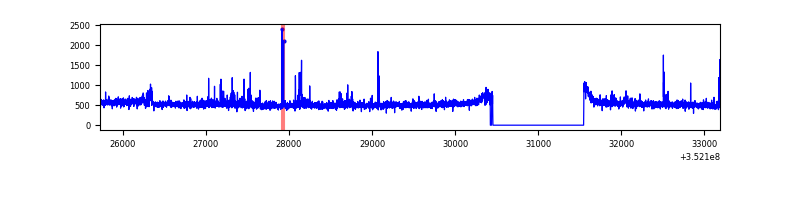 |
| C | 7467 | 6359 | 2889 | 2889 | 38.69% | 45.43% | 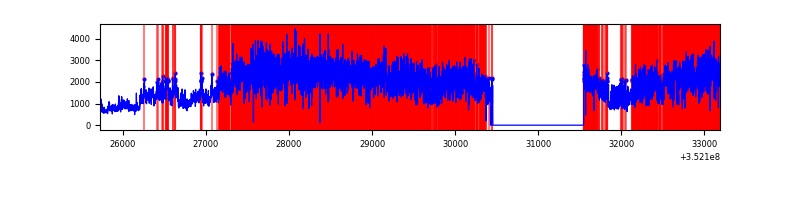 |
| D | 7467 | 6359 | 279 | 279 | 3.74% | 4.39% | 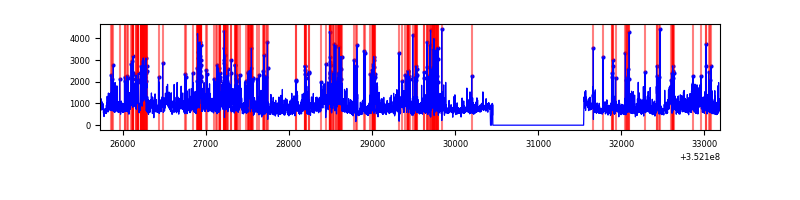 |
Top three noisy pixels from each quadrant. If the there are fewer than three noisy pixels in the level2.evt file, extra rows are filled as -1
| Pixel properties | Quadrant properties | ||||||
|---|---|---|---|---|---|---|---|
| Quadrant | DetID | PixID | Counts | Sigma | Mean | Median | Sigma |
| A | 13 | 254 | 13681 | 75.13 | 853 | 838 | 170.9 |
| A | 0 | 13 | 8362 | 44.02 | 853 | 838 | 170.9 |
| A | 3 | 137 | 7437 | 38.6 | 853 | 838 | 170.9 |
| B | 5 | 172 | 40634 | 251.87 | 839 | 821 | 158.1 |
| B | 3 | 209 | 33663 | 207.77 | 839 | 821 | 158.1 |
| B | 10 | 245 | 32800 | 202.31 | 839 | 821 | 158.1 |
| C | 3 | 233 | 9396342 | 64491.7 | 627 | 634 | 145.7 |
| C | 14 | 238 | 99991 | 681.98 | 627 | 634 | 145.7 |
| C | 0 | 207 | 20158 | 134.01 | 627 | 634 | 145.7 |
| D | 8 | 195 | 1355716 | 7100.16 | 808 | 787 | 190.8 |
| D | 1 | 52 | 767951 | 4020.13 | 808 | 787 | 190.8 |
| D | 7 | 69 | 235053 | 1227.61 | 808 | 787 | 190.8 |
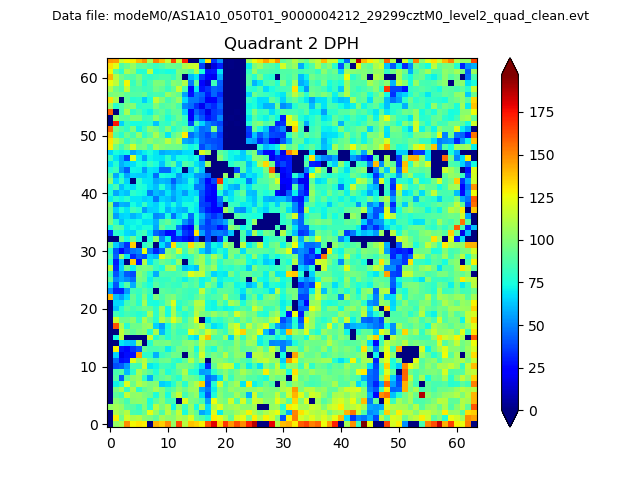
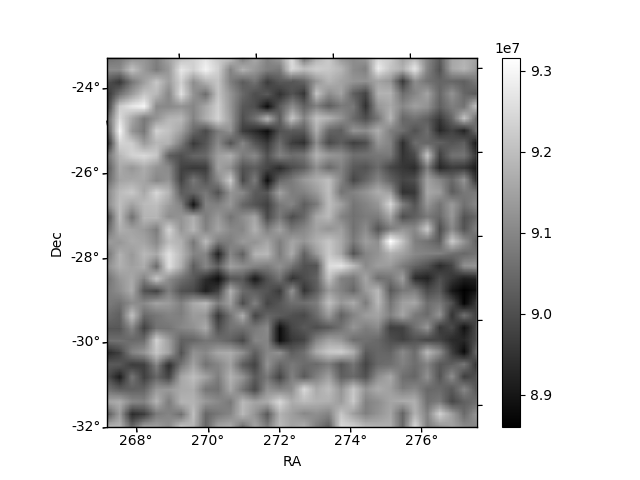
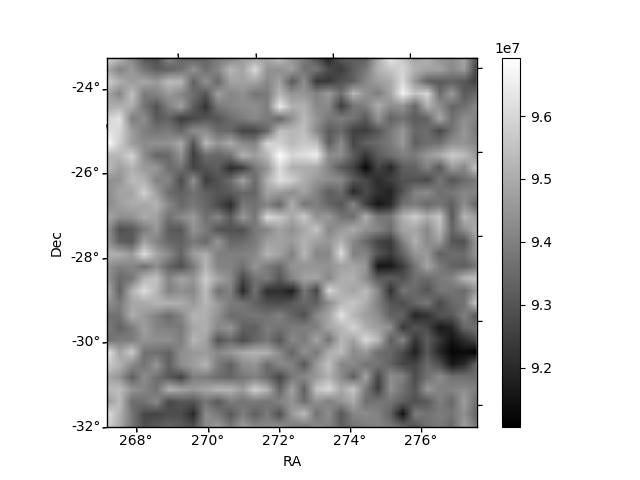
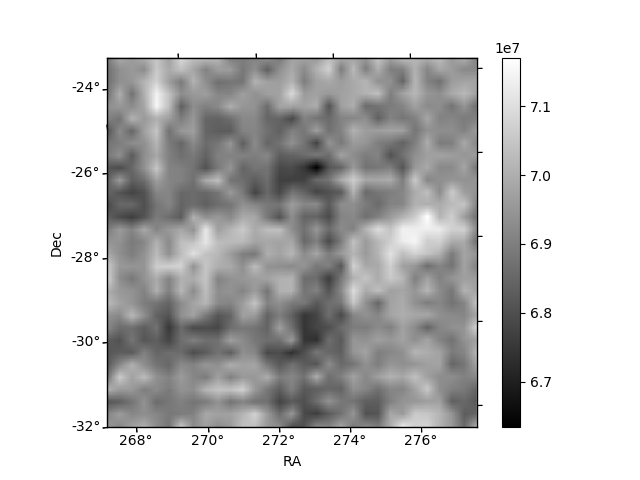
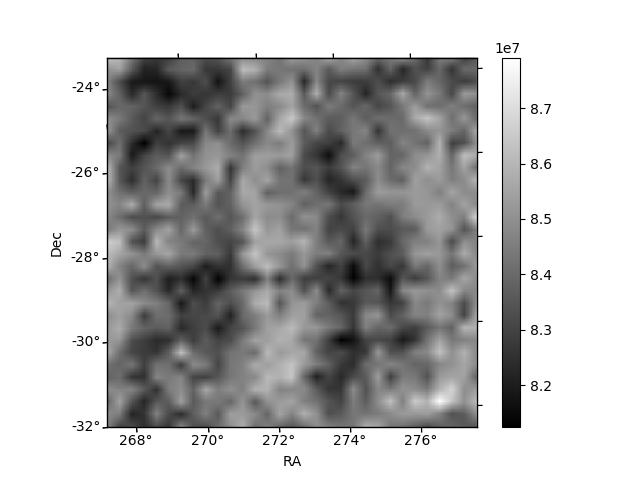
Histogram calculated using DETX and DETY for each event in the final _common_clean file
| Quadrant A | 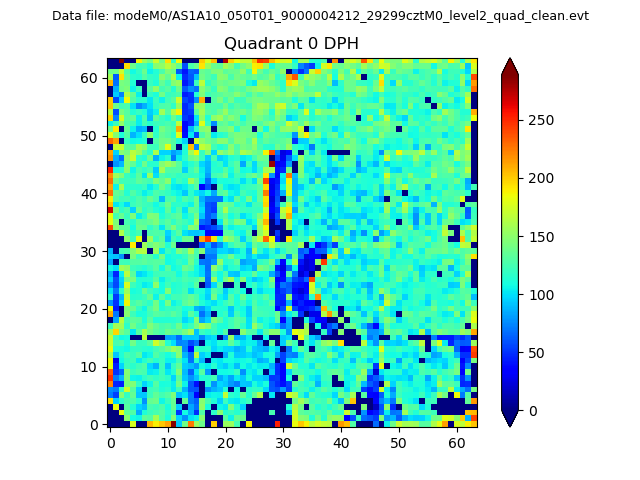 |
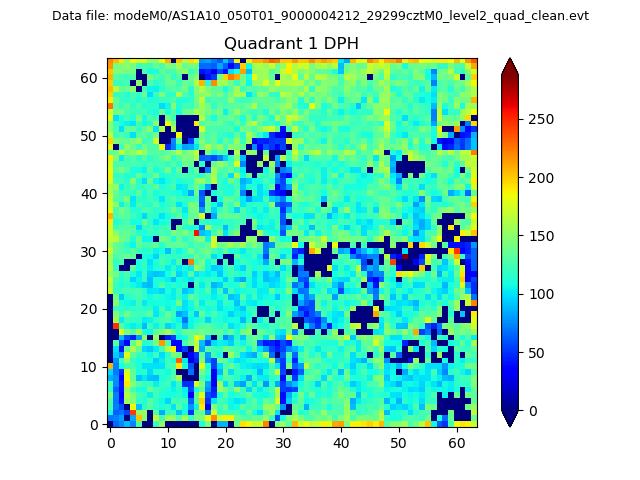 |
Quadrant B |
|---|---|---|---|
| Quadrant D | 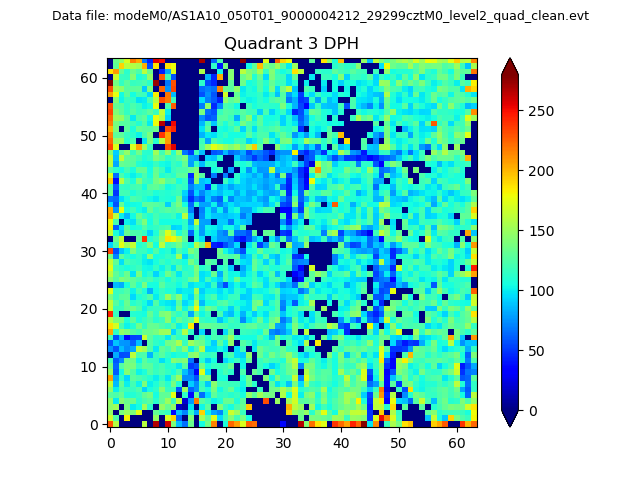 |
 |
Quadrant C |
| Plot type | Count rate plots | Images |
|---|---|---|
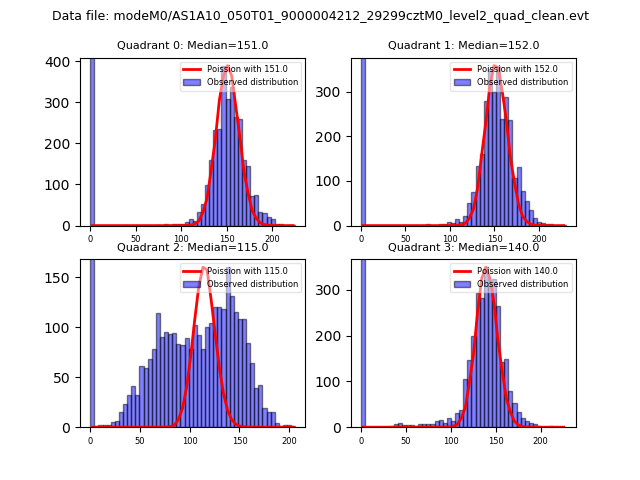
| Comparison with Poisson distribution Blue bars denote a histogram of data divided into 1 sec bins. Red curve is a Poisson curve with rate = median count rate of data. |
 |
 |
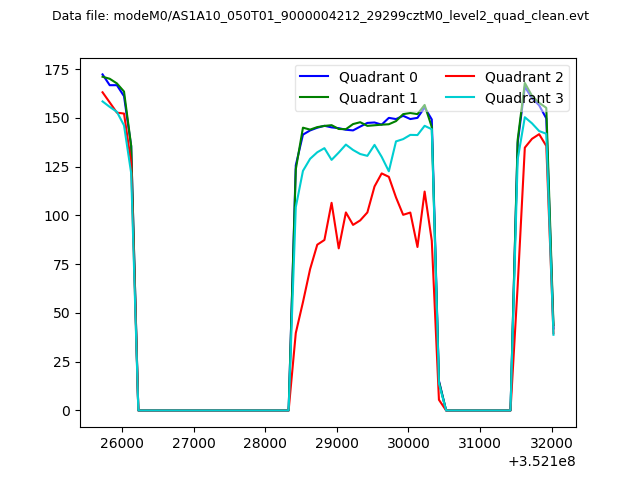
| Quadrant-wise count rates Data is divided into 100 sec bins |
 |
|
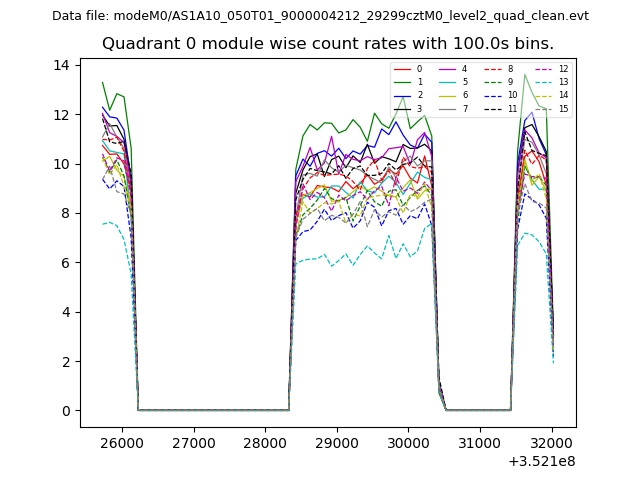
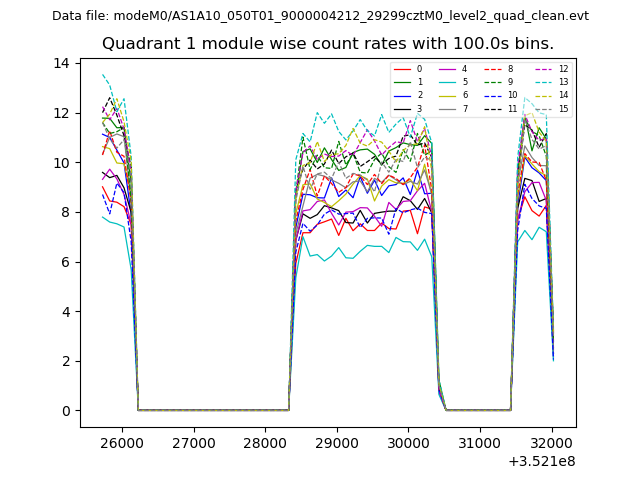
| Module-wise count rates for Quadrant A Data is divided into 100 sec bins |
 |
 |
| Module-wise count rates for Quadrant B Data is divided into 100 sec bins |
 |
 |
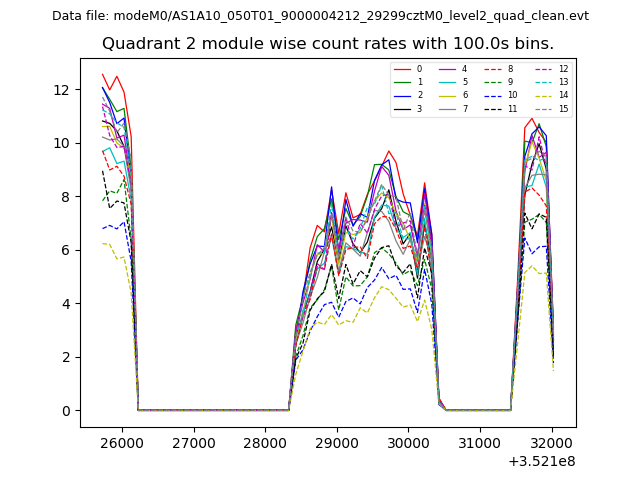
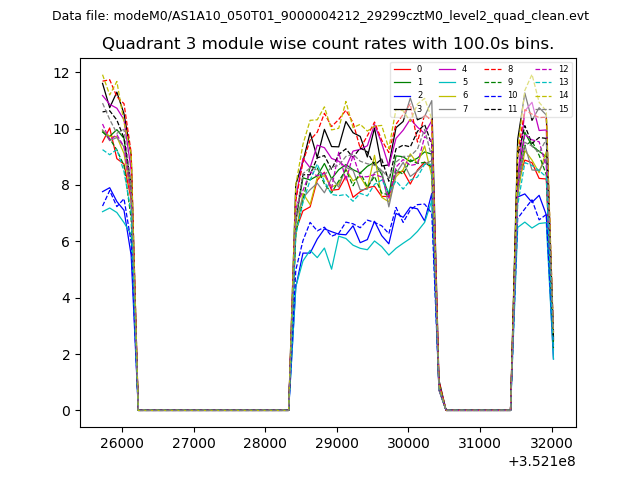
| Module-wise count rates for Quadrant C Data is divided into 100 sec bins |
 |
 |
| Module-wise count rates for Quadrant D Data is divided into 100 sec bins |
 |
 |
| Parameter | Plot |
|---|---|
| CZT HV Monitor | 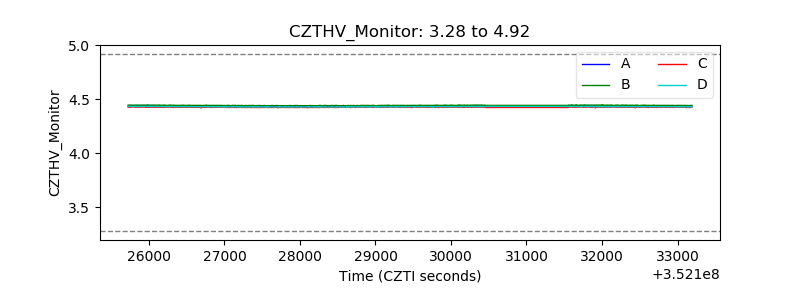 |
| D_VDD | 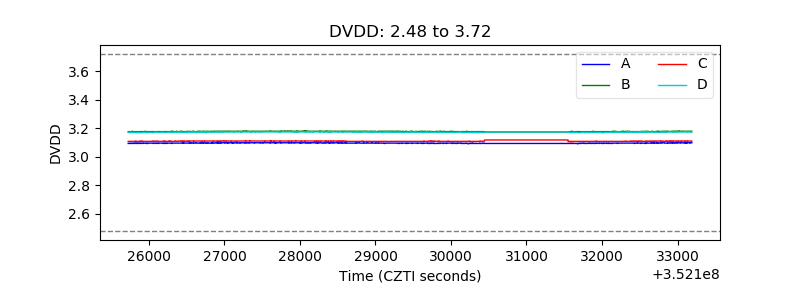 |
| Temperature 1 | 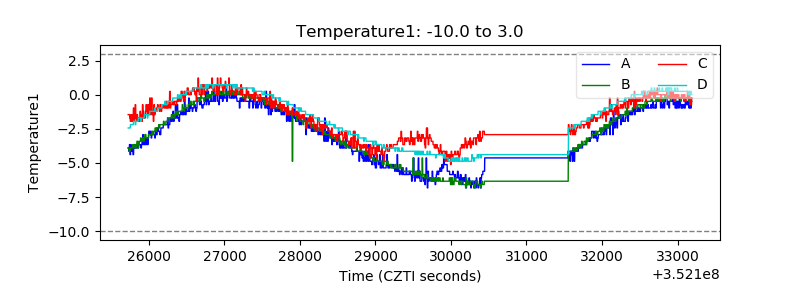 |
| Veto HV Monitor | 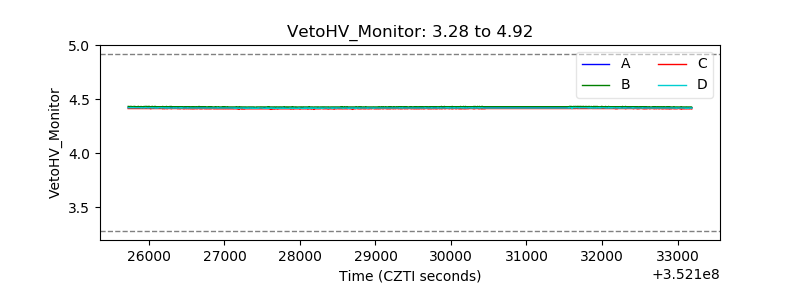 |
| Veto LLD | 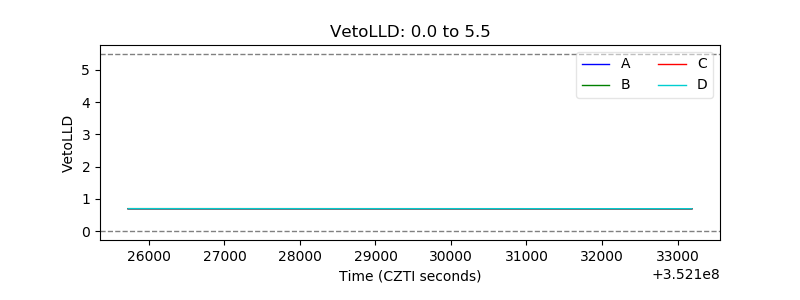 |
| Alpha Counter | 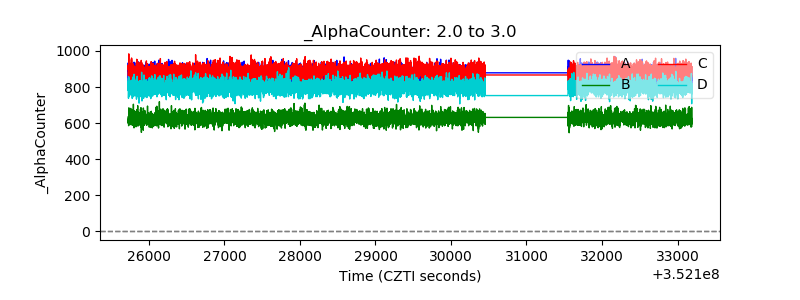 |
| _CPM_Rate |  |
| CZT Counter | 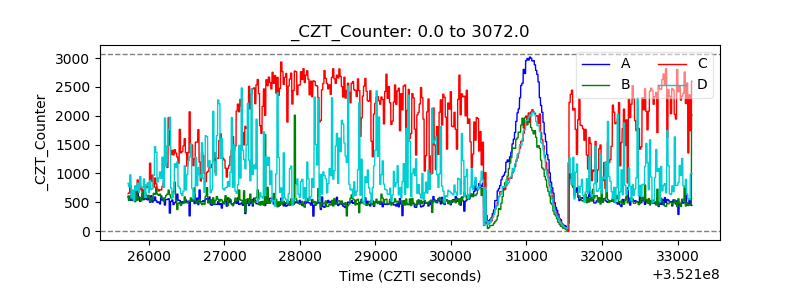 |
| +2.5 Volts monitor |  |
| +5 Volts monitor |  |
| _ROLL_ROT | 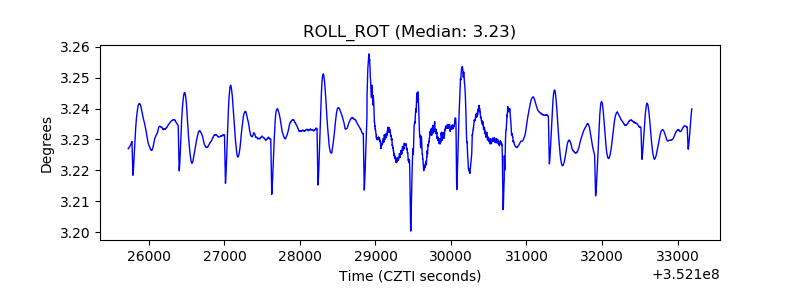 |
| _Roll_DEC | 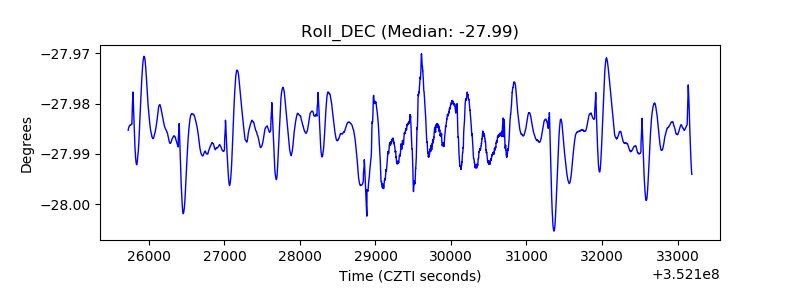 |
| _Roll_RA | 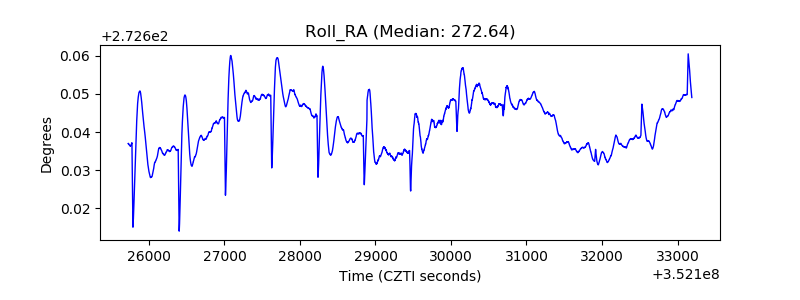 |
| Veto Counter | 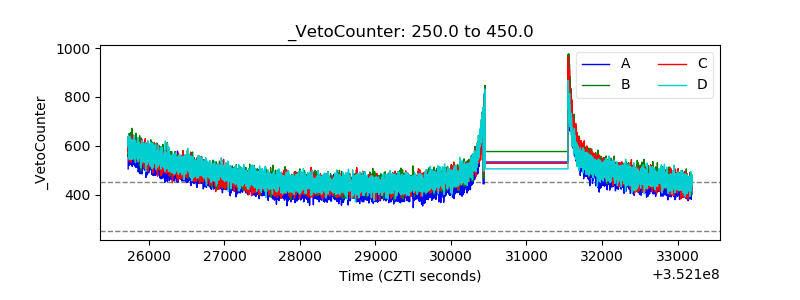 |