| Param | Original file | Final file |
|---|---|---|
| Filename | modeM0/AS1A10_050T01_9000004212_29300cztM0_level2.evt | modeM0/AS1A10_050T01_9000004212_29300cztM0_level2_quad_clean.evt |
| Size (bytes) | 881,838,720 | 72,440,640 |
| Size | 841.0 MB | 69.1 MB |
| Events in quadrant A | 3,473,213 | 452,274 |
| Events in quadrant B | 3,811,592 | 451,190 |
| Events in quadrant C | 12,794,319 | 381,760 |
| Events in quadrant D | 6,160,051 | 424,751 |
| Mode M9 | |||
|---|---|---|---|
| Quadrant | BADHDUFLAG | Total packets | Discarded packets |
| A | 0 | 8 | 0 |
| B | 0 | 8 | 0 |
| C | 0 | 8 | 0 |
| D | 0 | 8 | 0 |
| Mode M0 | |||
|---|---|---|---|
| Quadrant | BADHDUFLAG | Total packets | Discarded packets |
| A | 0 | 14377 | 1 |
| B | 0 | 15416 | 1 |
| C | 0 | 42806 | 1 |
| D | 0 | 23174 | 1 |
| Mode SS | |||
|---|---|---|---|
| Quadrant | BADHDUFLAG | Total packets | Discarded packets |
| A | 0 | 140 | 0 |
| B | 0 | 140 | 0 |
| C | 0 | 140 | 0 |
| D | 0 | 140 | 0 |
| Quadrant | Total seconds | Saturated seconds | Saturation percentage |
|---|---|---|---|
| A | 6933 | 107 | 1.543343% |
| B | 6933 | 170 | 2.452041% |
| C | 6932 | 3902 | 56.289671% |
| D | 6932 | 339 | 4.890364% |
Noise dominated data is calculated using 1-second bins in cleaned event files. If a bin has >2000 counts, and if more than 50% of those come from <1% of pixels, then it is considered to be noise-dominated and hence unusable.
| Quadrant | # 1 sec bins | Bins with >0 counts | Bins with >2000 counts | High rate bins dominated by noise | Noise dominated (total time) | Noise dominated (detector-on time) | Marked lightcurve |
|---|---|---|---|---|---|---|---|
| A | 7743 | 6934 | 0 | 0 | 0.00% | 0.00% | 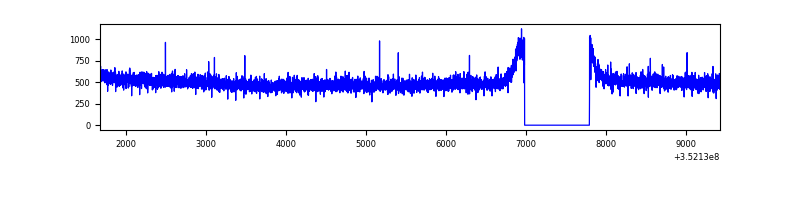 |
| B | 7743 | 6934 | 27 | 27 | 0.35% | 0.39% | 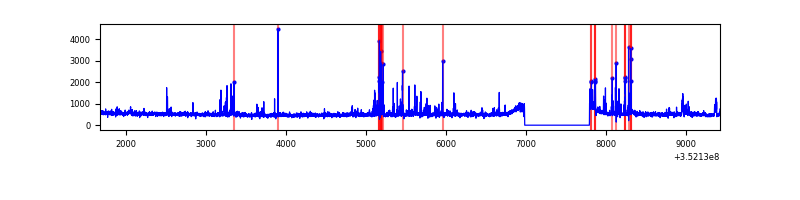 |
| C | 7742 | 6933 | 2957 | 2957 | 38.19% | 42.65% | 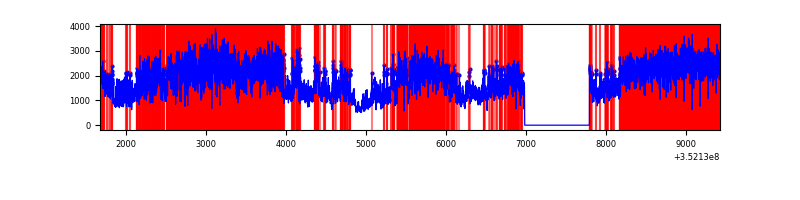 |
| D | 7742 | 6933 | 175 | 175 | 2.26% | 2.52% | 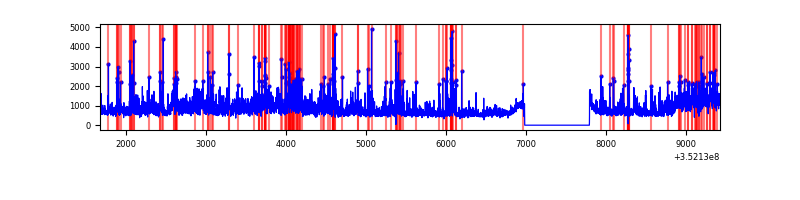 |
Top three noisy pixels from each quadrant. If the there are fewer than three noisy pixels in the level2.evt file, extra rows are filled as -1
| Pixel properties | Quadrant properties | ||||||
|---|---|---|---|---|---|---|---|
| Quadrant | DetID | PixID | Counts | Sigma | Mean | Median | Sigma |
| A | 13 | 254 | 15590 | 81.3 | 897 | 878 | 181.0 |
| A | 3 | 137 | 8236 | 40.66 | 897 | 878 | 181.0 |
| A | 0 | 226 | 7838 | 38.46 | 897 | 878 | 181.0 |
| B | 5 | 255 | 231685 | 1368.94 | 884 | 863 | 168.6 |
| B | 5 | 172 | 33950 | 196.23 | 884 | 863 | 168.6 |
| B | 10 | 245 | 30533 | 175.96 | 884 | 863 | 168.6 |
| C | 3 | 233 | 9964874 | 61373.5 | 692 | 697 | 162.4 |
| C | 14 | 238 | 106304 | 650.48 | 692 | 697 | 162.4 |
| C | 2 | 114 | 14162 | 82.94 | 692 | 697 | 162.4 |
| D | 8 | 195 | 1194537 | 5889.24 | 859 | 836 | 202.7 |
| D | 1 | 52 | 464971 | 2289.85 | 859 | 836 | 202.7 |
| D | 13 | 153 | 299363 | 1472.81 | 859 | 836 | 202.7 |
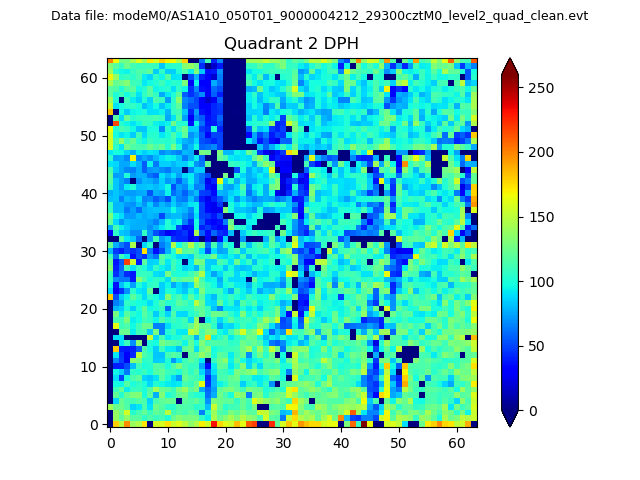
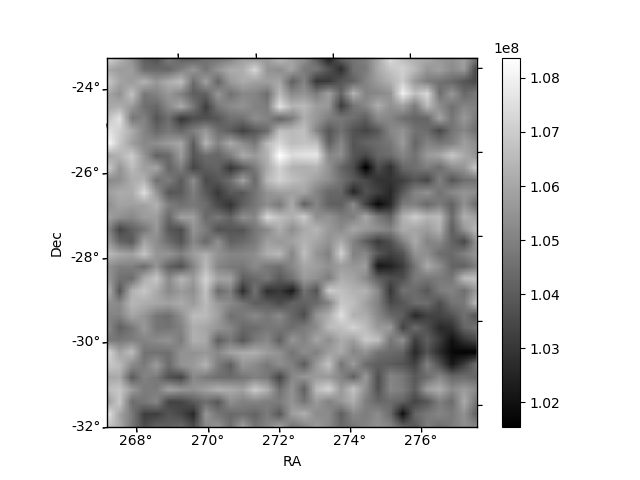
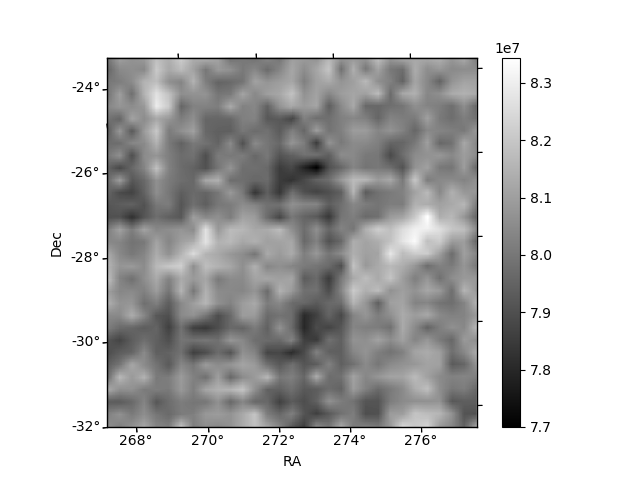
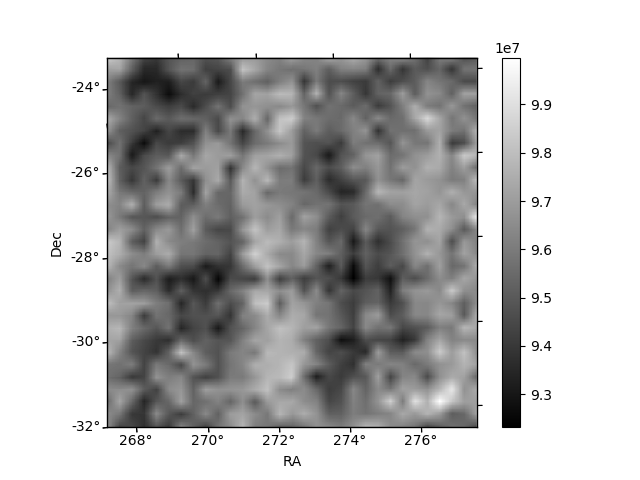
Histogram calculated using DETX and DETY for each event in the final _common_clean file
| Quadrant A | 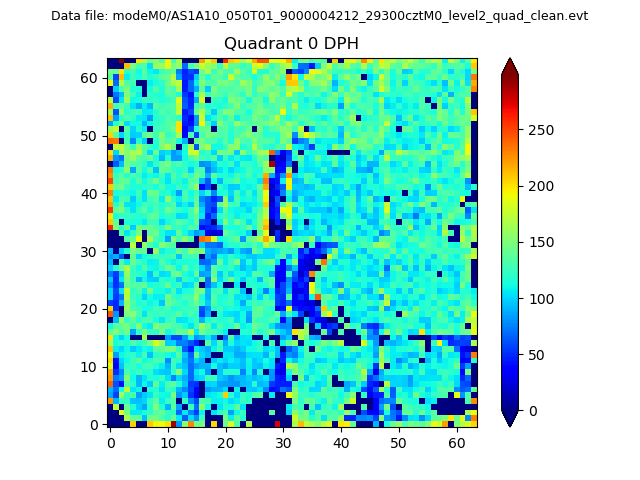 |
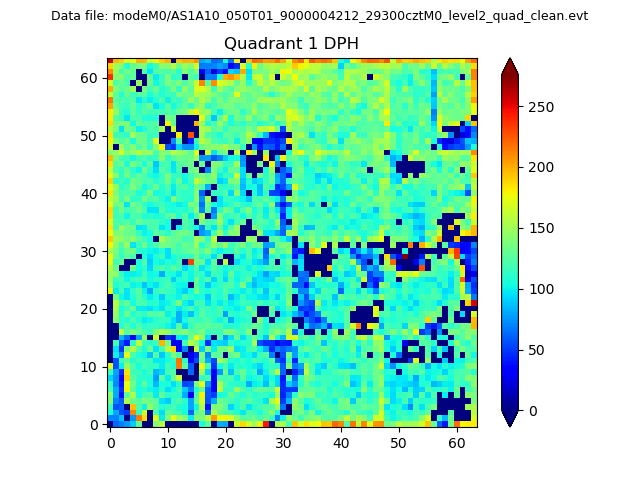 |
Quadrant B |
|---|---|---|---|
| Quadrant D | 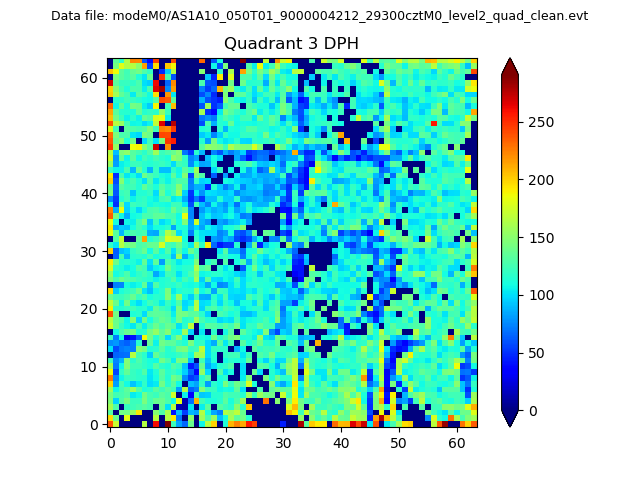 |
 |
Quadrant C |
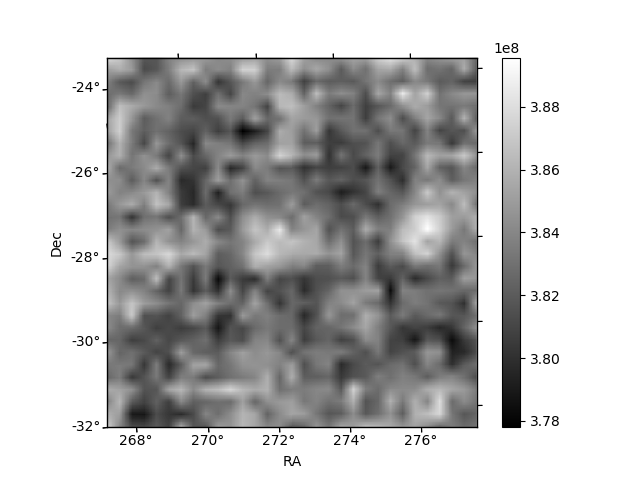
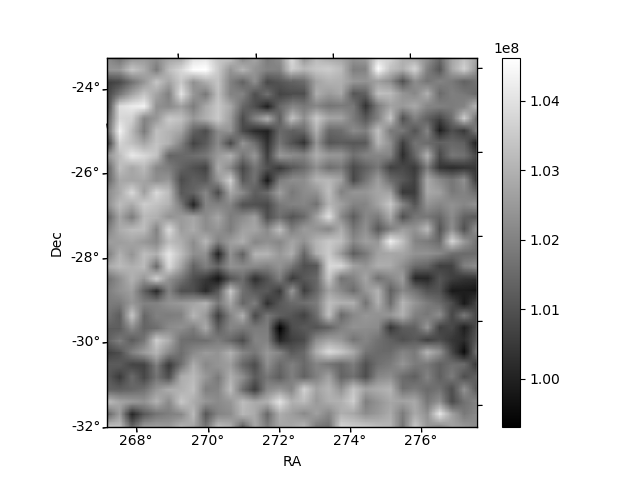
| Plot type | Count rate plots | Images |
|---|---|---|
| Comparison with Poisson distribution Blue bars denote a histogram of data divided into 1 sec bins. Red curve is a Poisson curve with rate = median count rate of data. |
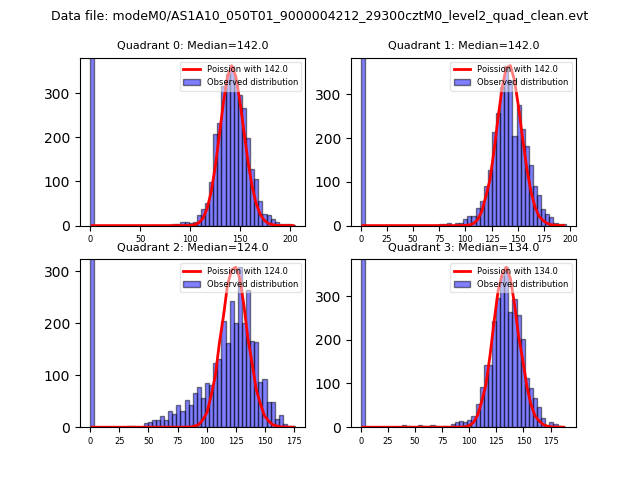 |
 |
| Quadrant-wise count rates Data is divided into 100 sec bins |
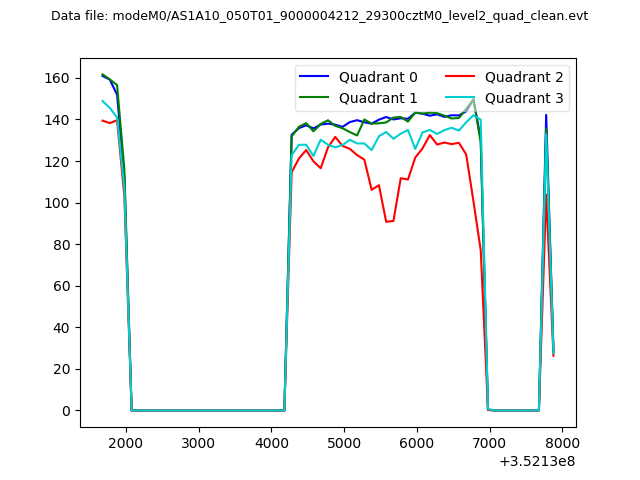 |
|
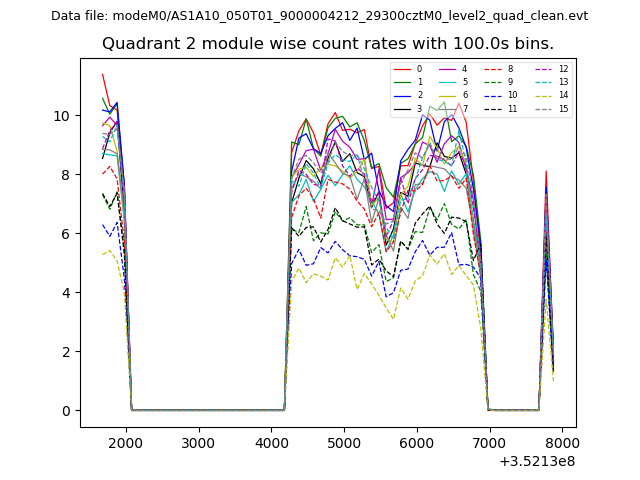
| Module-wise count rates for Quadrant A Data is divided into 100 sec bins |
 |
 |
| Module-wise count rates for Quadrant B Data is divided into 100 sec bins |
 |
 |
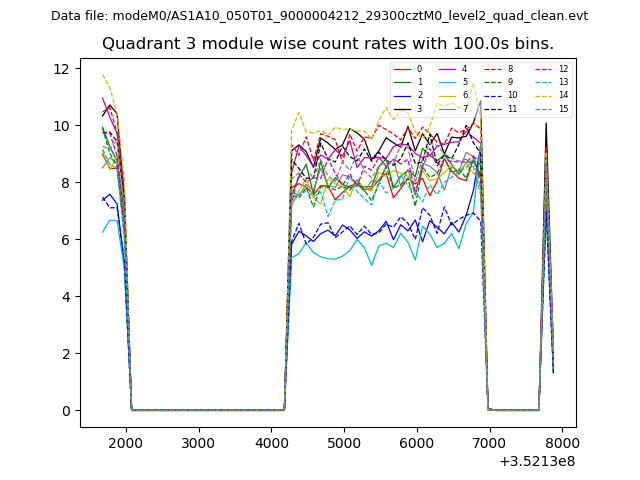
| Module-wise count rates for Quadrant C Data is divided into 100 sec bins |
 |
 |
| Module-wise count rates for Quadrant D Data is divided into 100 sec bins |
 |
 |
| Parameter | Plot |
|---|---|
| CZT HV Monitor |  |
| D_VDD | 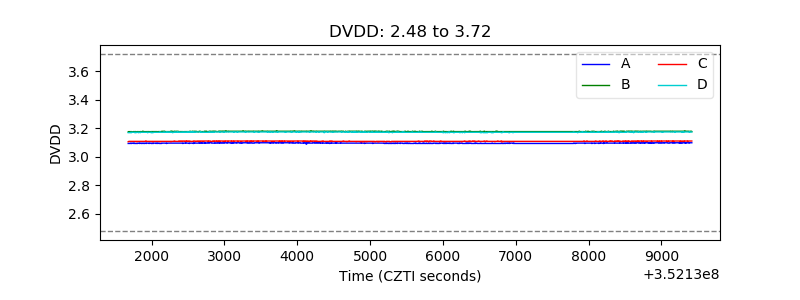 |
| Temperature 1 | 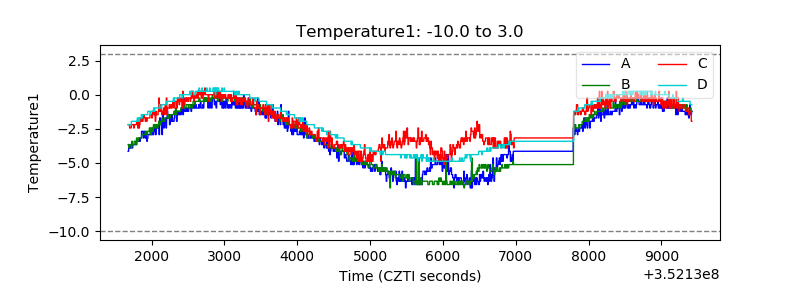 |
| Veto HV Monitor |  |
| Veto LLD | 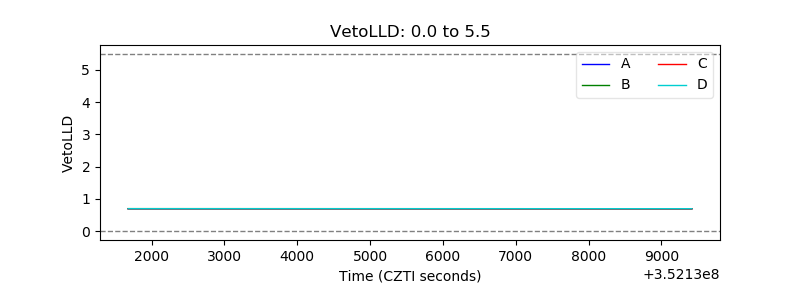 |
| Alpha Counter | 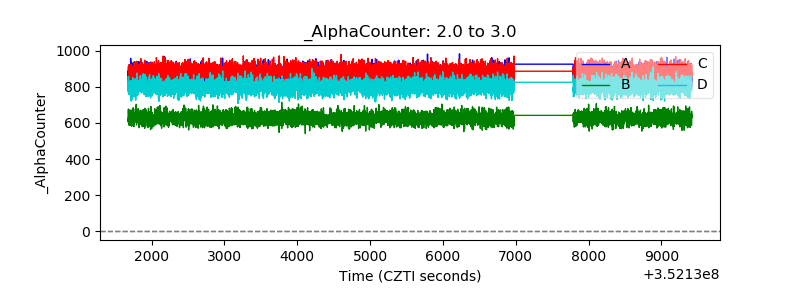 |
| _CPM_Rate | 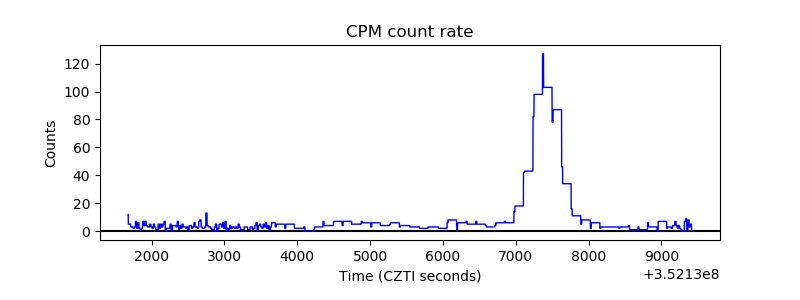 |
| CZT Counter | 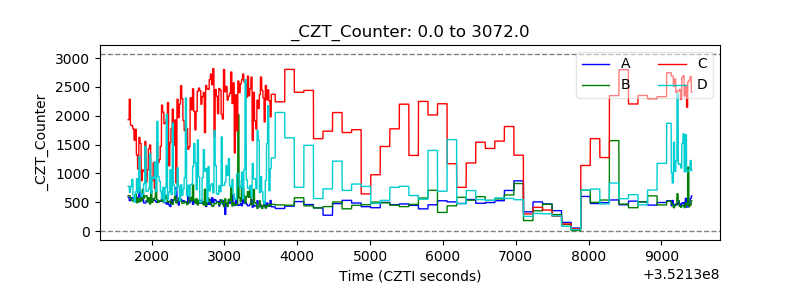 |
| +2.5 Volts monitor | 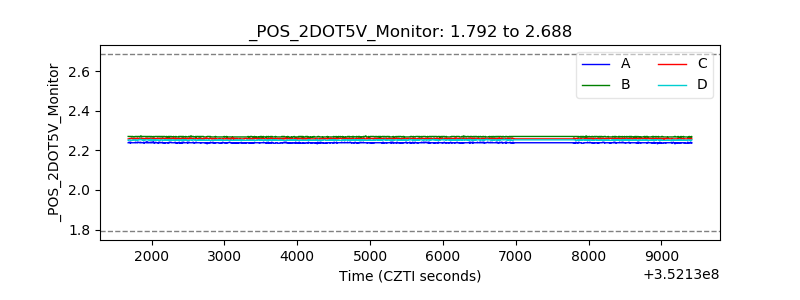 |
| +5 Volts monitor |  |
| _ROLL_ROT |  |
| _Roll_DEC | 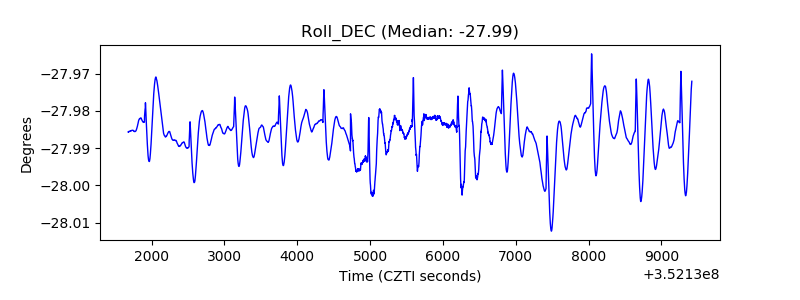 |
| _Roll_RA | 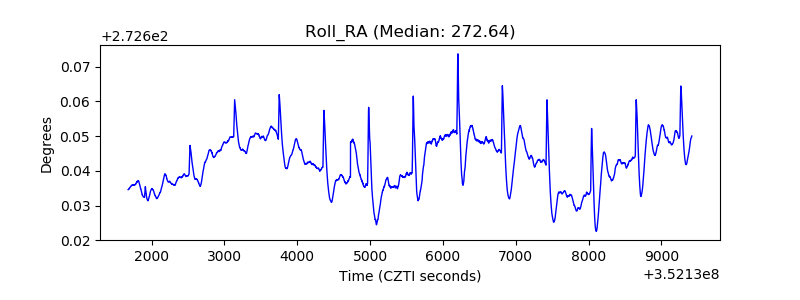 |
| Veto Counter |  |