| Param | Original file | Final file |
|---|---|---|
| Filename | modeM0/AS1A10_050T01_9000004212_29301cztM0_level2.evt | modeM0/AS1A10_050T01_9000004212_29301cztM0_level2_quad_clean.evt |
| Size (bytes) | 957,096,000 | 77,166,720 |
| Size | 912.8 MB | 73.6 MB |
| Events in quadrant A | 3,655,029 | 483,080 |
| Events in quadrant B | 4,208,594 | 480,820 |
| Events in quadrant C | 13,752,648 | 405,275 |
| Events in quadrant D | 6,871,371 | 452,467 |
| Mode M9 | |||
|---|---|---|---|
| Quadrant | BADHDUFLAG | Total packets | Discarded packets |
| A | 0 | 5 | 0 |
| B | 0 | 6 | 0 |
| C | 0 | 6 | 0 |
| D | 0 | 6 | 0 |
| Mode M0 | |||
|---|---|---|---|
| Quadrant | BADHDUFLAG | Total packets | Discarded packets |
| A | 0 | 15423 | 2 |
| B | 0 | 17020 | 2 |
| C | 0 | 45940 | 2 |
| D | 0 | 25422 | 2 |
| Mode SS | |||
|---|---|---|---|
| Quadrant | BADHDUFLAG | Total packets | Discarded packets |
| A | 0 | 150 | 0 |
| B | 0 | 150 | 0 |
| C | 0 | 150 | 0 |
| D | 0 | 150 | 0 |
| Quadrant | Total seconds | Saturated seconds | Saturation percentage |
|---|---|---|---|
| A | 7384 | 134 | 1.814735% |
| B | 7384 | 235 | 3.182557% |
| C | 7384 | 4313 | 58.410076% |
| D | 7384 | 698 | 9.452871% |
Noise dominated data is calculated using 1-second bins in cleaned event files. If a bin has >2000 counts, and if more than 50% of those come from <1% of pixels, then it is considered to be noise-dominated and hence unusable.
| Quadrant | # 1 sec bins | Bins with >0 counts | Bins with >2000 counts | High rate bins dominated by noise | Noise dominated (total time) | Noise dominated (detector-on time) | Marked lightcurve |
|---|---|---|---|---|---|---|---|
| A | 7814 | 7385 | 0 | 0 | 0.00% | 0.00% | 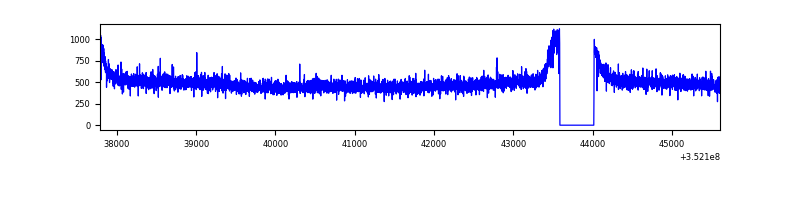 |
| B | 7814 | 7385 | 45 | 45 | 0.58% | 0.61% | 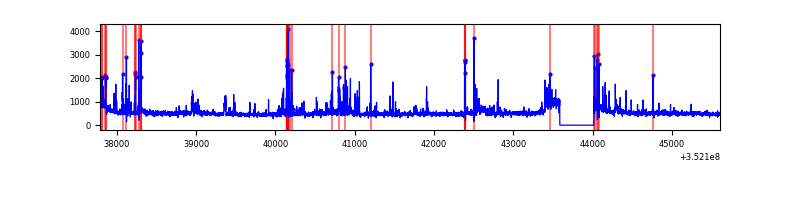 |
| C | 7814 | 7385 | 3044 | 3044 | 38.96% | 41.22% | 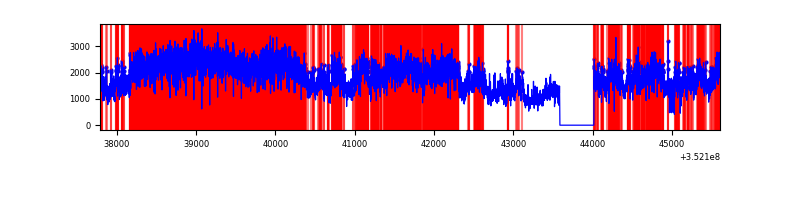 |
| D | 7814 | 7385 | 521 | 521 | 6.67% | 7.05% | 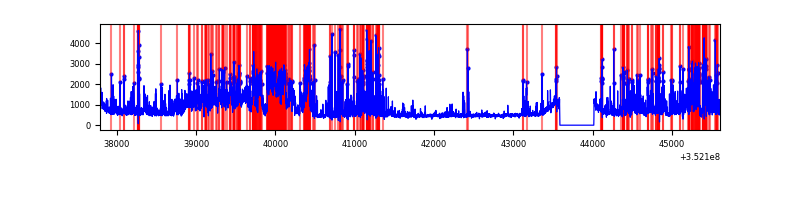 |
Top three noisy pixels from each quadrant. If the there are fewer than three noisy pixels in the level2.evt file, extra rows are filled as -1
| Pixel properties | Quadrant properties | ||||||
|---|---|---|---|---|---|---|---|
| Quadrant | DetID | PixID | Counts | Sigma | Mean | Median | Sigma |
| A | 13 | 254 | 15725 | 77.12 | 945 | 925 | 191.9 |
| A | 3 | 137 | 9173 | 42.98 | 945 | 925 | 191.9 |
| A | 0 | 226 | 8215 | 37.99 | 945 | 925 | 191.9 |
| B | 5 | 255 | 440164 | 2468.09 | 927 | 903 | 178.0 |
| B | 10 | 245 | 38783 | 212.84 | 927 | 903 | 178.0 |
| B | 5 | 172 | 27240 | 147.98 | 927 | 903 | 178.0 |
| C | 3 | 233 | 10592430 | 60376.59 | 754 | 758 | 175.4 |
| C | 14 | 238 | 126616 | 717.44 | 754 | 758 | 175.4 |
| C | 7 | 247 | 38131 | 213.04 | 754 | 758 | 175.4 |
| D | 7 | 223 | 1120542 | 5232.5 | 895 | 872 | 214.0 |
| D | 1 | 52 | 1090713 | 5093.1 | 895 | 872 | 214.0 |
| D | 12 | 233 | 454115 | 2118.12 | 895 | 872 | 214.0 |
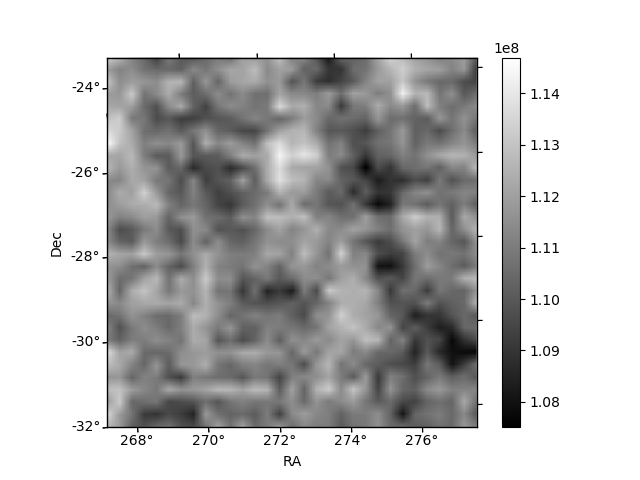
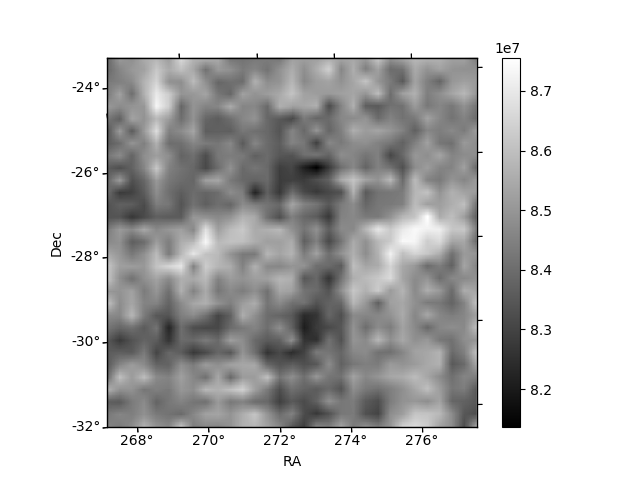
Histogram calculated using DETX and DETY for each event in the final _common_clean file
| Quadrant A | 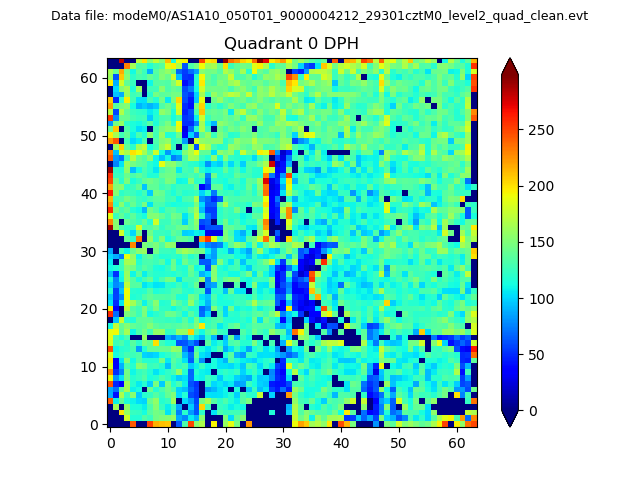 |
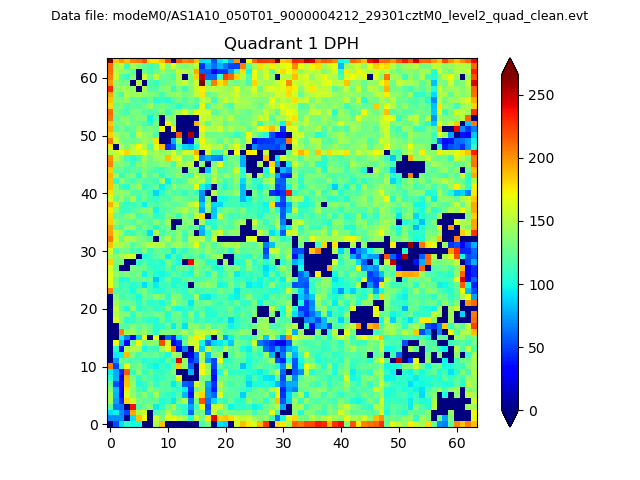 |
Quadrant B |
|---|---|---|---|
| Quadrant D | 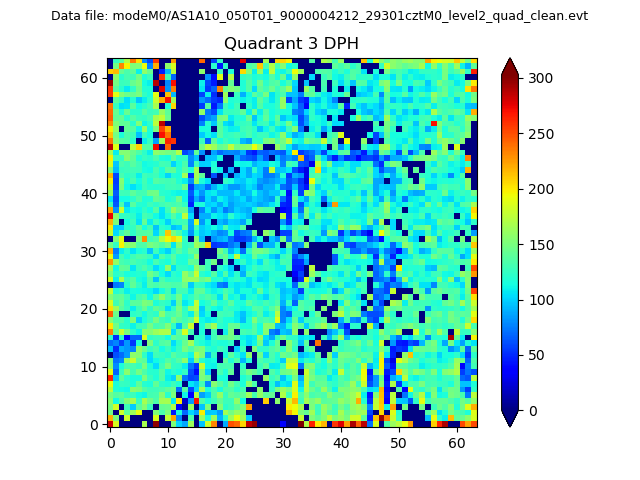 |
 |
Quadrant C |
| Plot type | Count rate plots | Images |
|---|---|---|
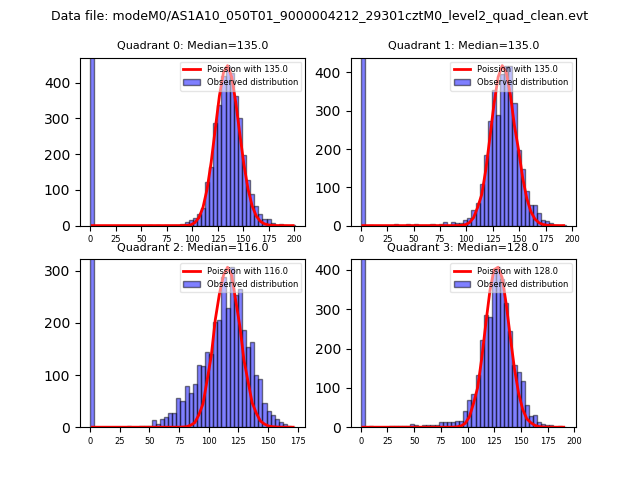
| Comparison with Poisson distribution Blue bars denote a histogram of data divided into 1 sec bins. Red curve is a Poisson curve with rate = median count rate of data. |
 |
 |
| Quadrant-wise count rates Data is divided into 100 sec bins |
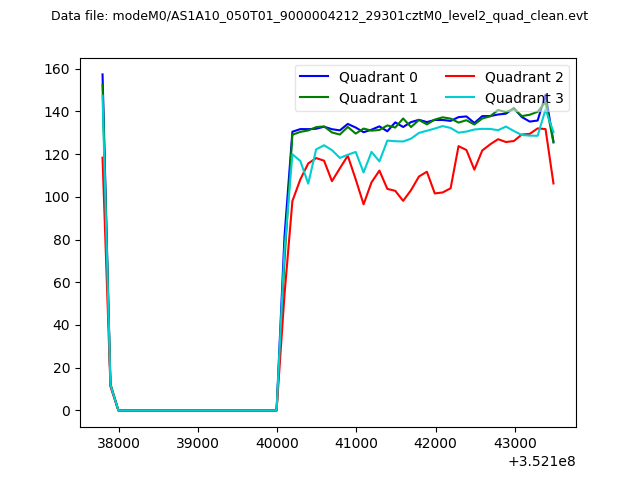 |
|
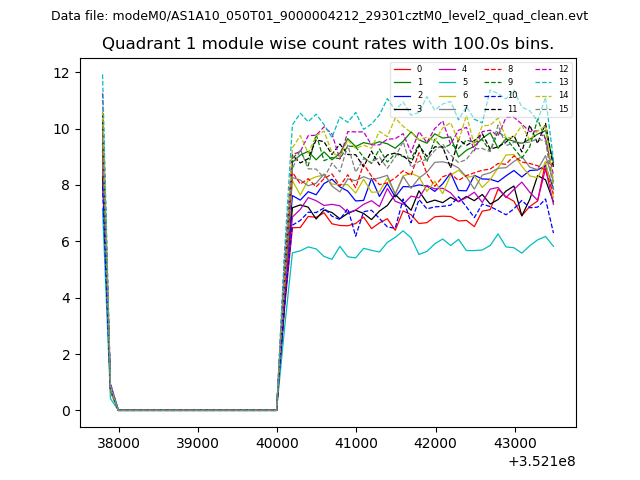
| Module-wise count rates for Quadrant A Data is divided into 100 sec bins |
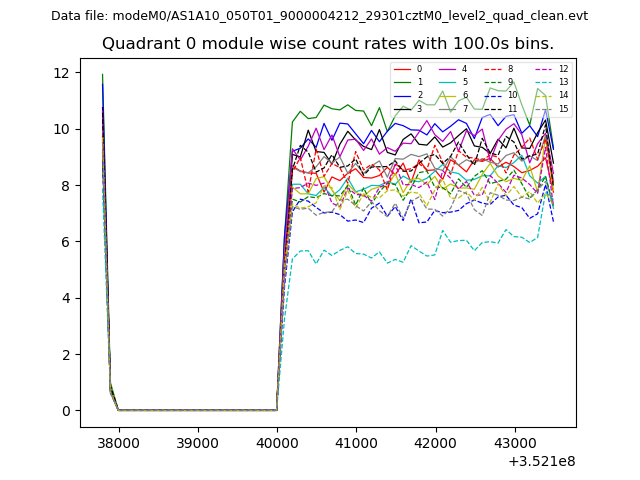 |
 |
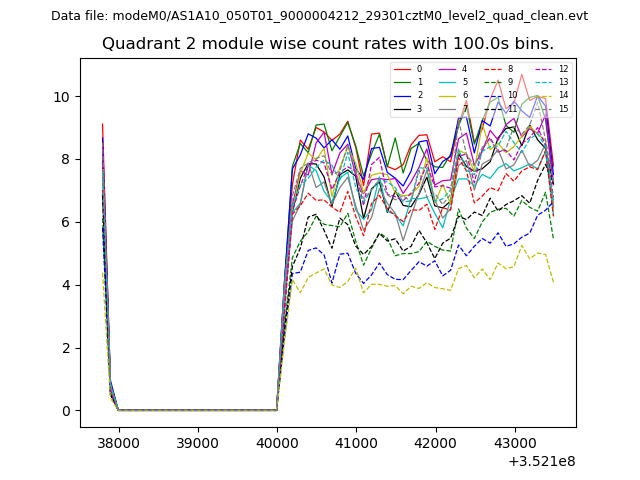
| Module-wise count rates for Quadrant B Data is divided into 100 sec bins |
 |
 |
| Module-wise count rates for Quadrant C Data is divided into 100 sec bins |
 |
 |
| Module-wise count rates for Quadrant D Data is divided into 100 sec bins |
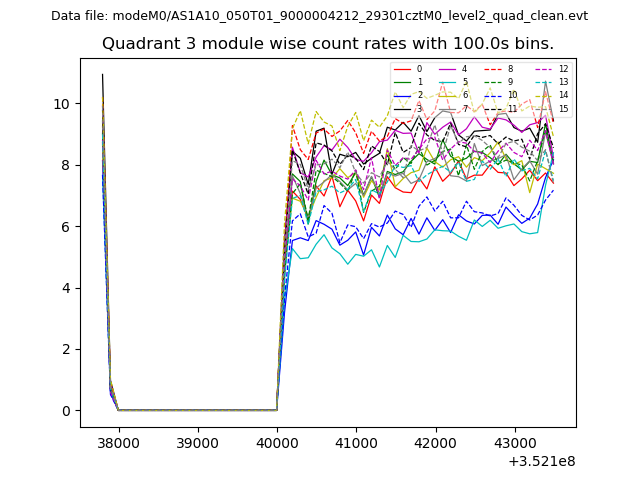 |
 |
| Parameter | Plot |
|---|---|
| CZT HV Monitor | 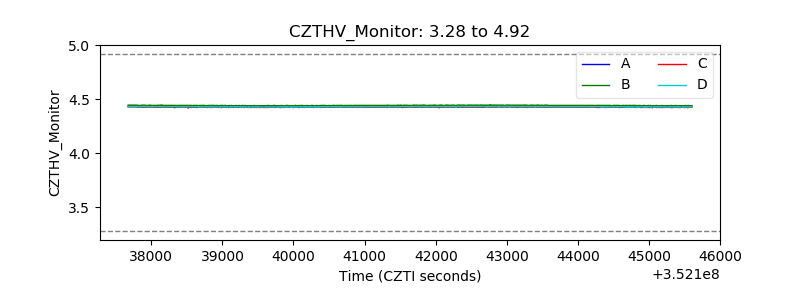 |
| D_VDD | 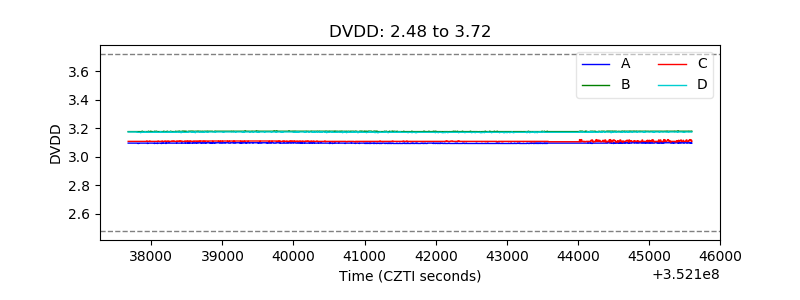 |
| Temperature 1 | 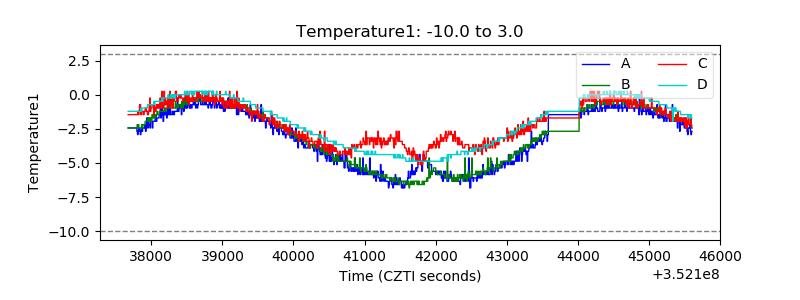 |
| Veto HV Monitor | 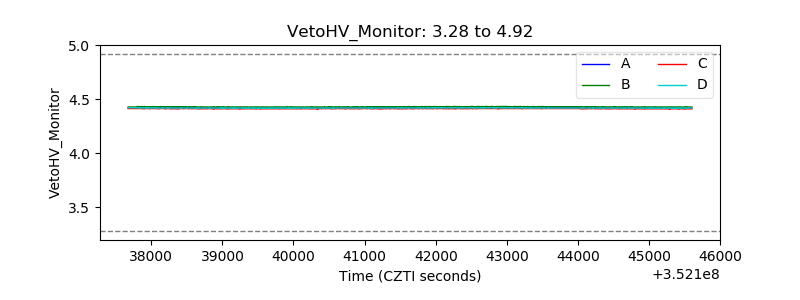 |
| Veto LLD | 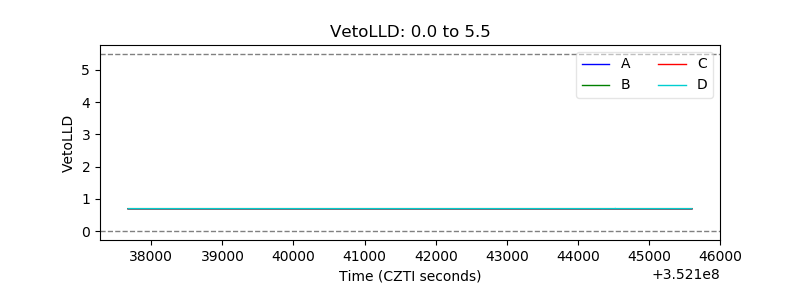 |
| Alpha Counter | 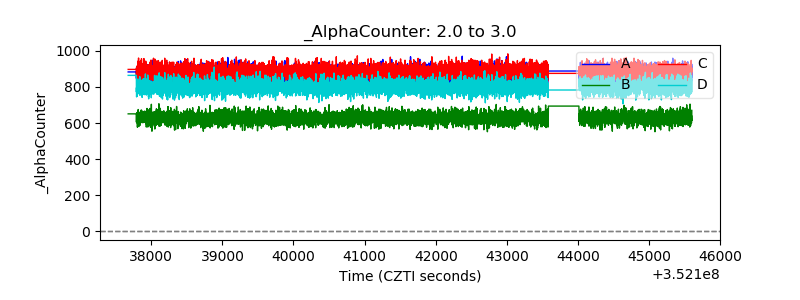 |
| _CPM_Rate | 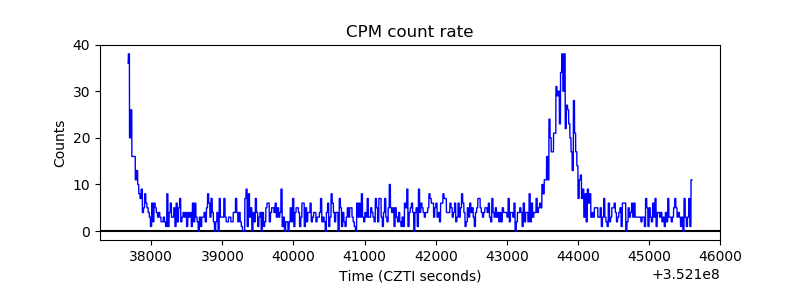 |
| CZT Counter |  |
| +2.5 Volts monitor |  |
| +5 Volts monitor |  |
| _ROLL_ROT | 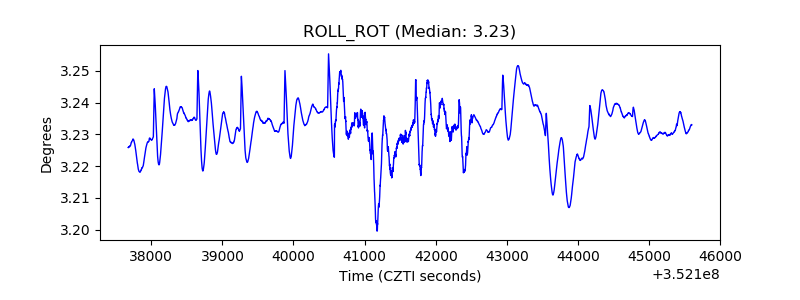 |
| _Roll_DEC | 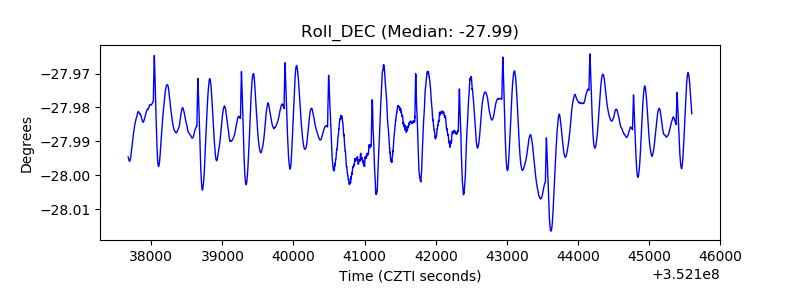 |
| _Roll_RA | 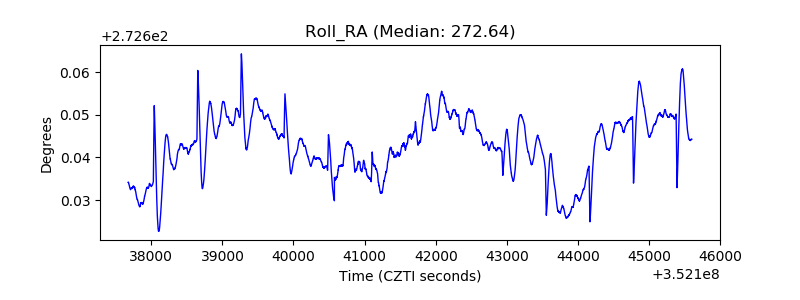 |
| Veto Counter |  |