| Param | Original file | Final file |
|---|---|---|
| Filename | modeM0/AS1A10_050T01_9000004212_29302cztM0_level2.evt | modeM0/AS1A10_050T01_9000004212_29302cztM0_level2_quad_clean.evt |
| Size (bytes) | 736,968,960 | 77,955,840 |
| Size | 702.8 MB | 74.3 MB |
| Events in quadrant A | 3,383,099 | 482,592 |
| Events in quadrant B | 3,782,925 | 483,371 |
| Events in quadrant C | 9,145,427 | 449,155 |
| Events in quadrant D | 5,534,942 | 457,894 |
| Mode M9 | |||
|---|---|---|---|
| Quadrant | BADHDUFLAG | Total packets | Discarded packets |
| A | 0 | 2 | 0 |
| B | 0 | 2 | 0 |
| C | 0 | 2 | 0 |
| D | 0 | 2 | 0 |
| Mode M0 | |||
|---|---|---|---|
| Quadrant | BADHDUFLAG | Total packets | Discarded packets |
| A | 0 | 14497 | 1 |
| B | 0 | 15536 | 1 |
| C | 0 | 32109 | 1 |
| D | 0 | 21258 | 1 |
| Mode SS | |||
|---|---|---|---|
| Quadrant | BADHDUFLAG | Total packets | Discarded packets |
| A | 0 | 144 | 0 |
| B | 0 | 144 | 0 |
| C | 0 | 144 | 0 |
| D | 0 | 144 | 0 |
| Quadrant | Total seconds | Saturated seconds | Saturation percentage |
|---|---|---|---|
| A | 6990 | 112 | 1.602289% |
| B | 6991 | 195 | 2.789301% |
| C | 6991 | 1728 | 24.717494% |
| D | 6991 | 421 | 6.022028% |
Noise dominated data is calculated using 1-second bins in cleaned event files. If a bin has >2000 counts, and if more than 50% of those come from <1% of pixels, then it is considered to be noise-dominated and hence unusable.
| Quadrant | # 1 sec bins | Bins with >0 counts | Bins with >2000 counts | High rate bins dominated by noise | Noise dominated (total time) | Noise dominated (detector-on time) | Marked lightcurve |
|---|---|---|---|---|---|---|---|
| A | 7225 | 6991 | 0 | 0 | 0.00% | 0.00% | 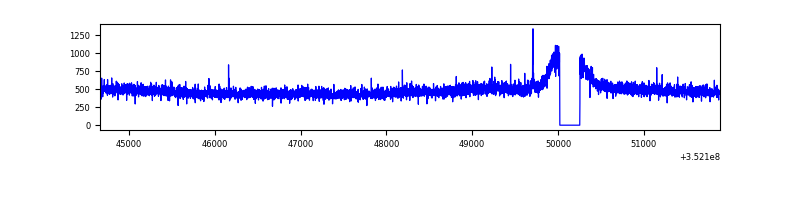 |
| B | 7226 | 6992 | 33 | 33 | 0.46% | 0.47% | 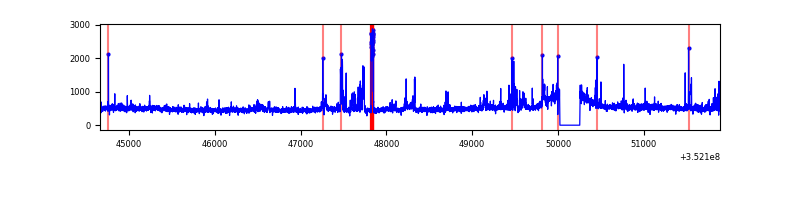 |
| C | 7226 | 6992 | 733 | 733 | 10.14% | 10.48% | 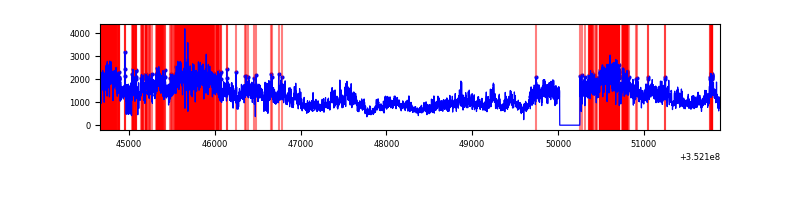 |
| D | 7226 | 6992 | 271 | 271 | 3.75% | 3.88% | 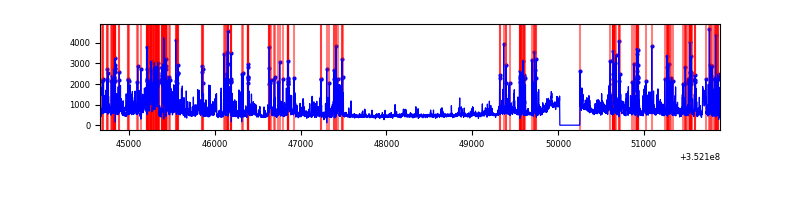 |
Top three noisy pixels from each quadrant. If the there are fewer than three noisy pixels in the level2.evt file, extra rows are filled as -1
| Pixel properties | Quadrant properties | ||||||
|---|---|---|---|---|---|---|---|
| Quadrant | DetID | PixID | Counts | Sigma | Mean | Median | Sigma |
| A | 13 | 254 | 15128 | 80.33 | 874 | 854 | 177.7 |
| A | 15 | 174 | 9684 | 49.69 | 874 | 854 | 177.7 |
| A | 3 | 137 | 8255 | 41.65 | 874 | 854 | 177.7 |
| B | 10 | 245 | 271184 | 1628.8 | 862 | 840 | 166.0 |
| B | 5 | 255 | 34677 | 203.87 | 862 | 840 | 166.0 |
| B | 0 | 190 | 26187 | 152.71 | 862 | 840 | 166.0 |
| C | 3 | 233 | 5787296 | 31530.01 | 778 | 783 | 183.5 |
| C | 14 | 238 | 149797 | 811.96 | 778 | 783 | 183.5 |
| C | 7 | 247 | 92745 | 501.09 | 778 | 783 | 183.5 |
| D | 1 | 52 | 777323 | 3877.11 | 833 | 812 | 200.3 |
| D | 12 | 233 | 526524 | 2624.87 | 833 | 812 | 200.3 |
| D | 8 | 195 | 437331 | 2179.53 | 833 | 812 | 200.3 |
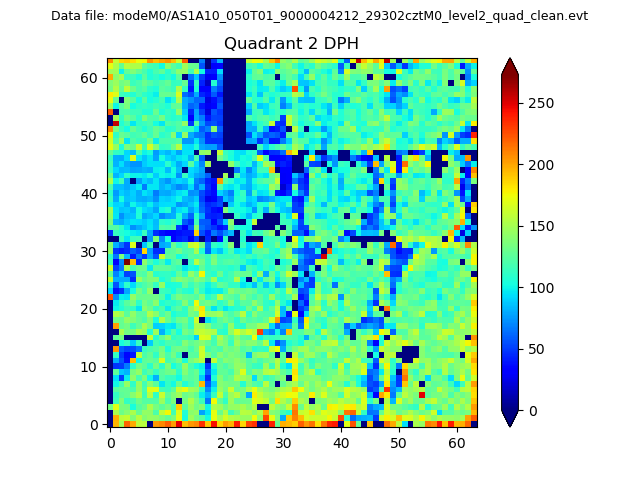
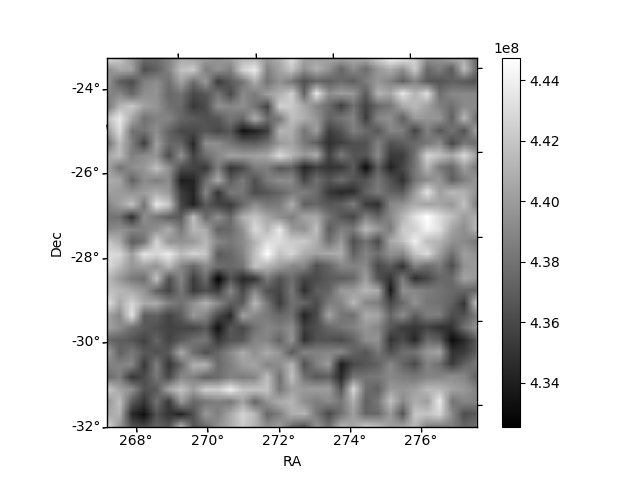
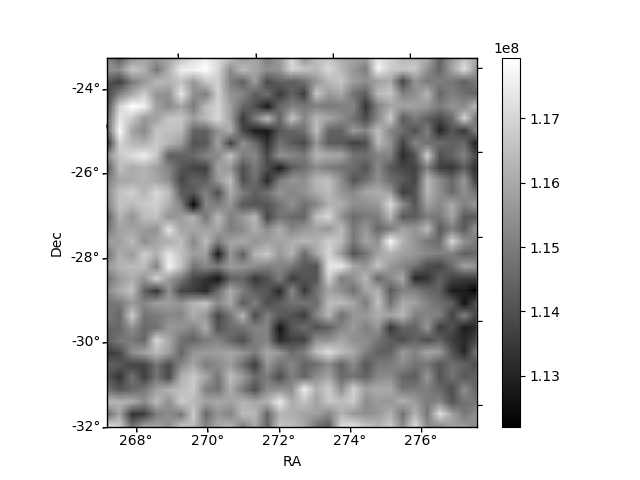
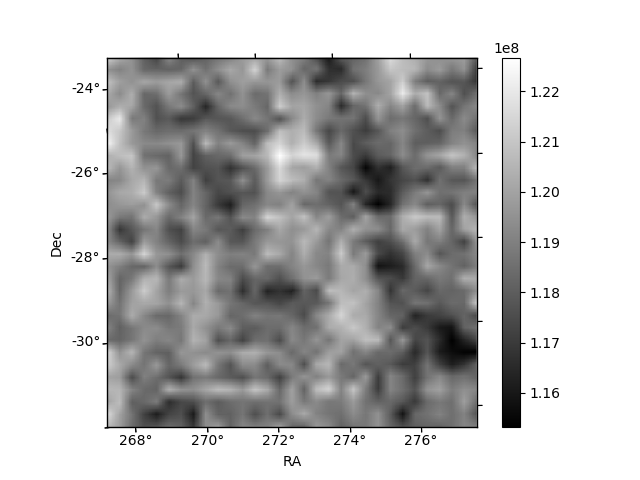
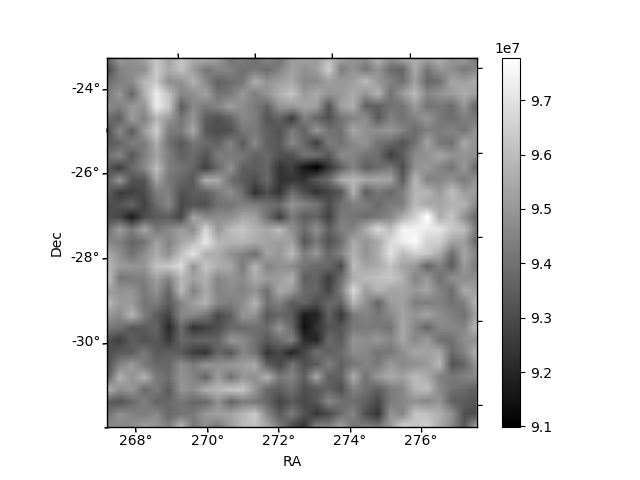
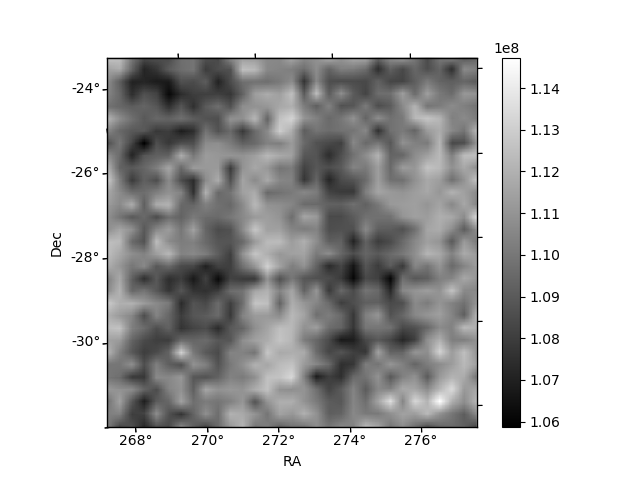
Histogram calculated using DETX and DETY for each event in the final _common_clean file
| Quadrant A | 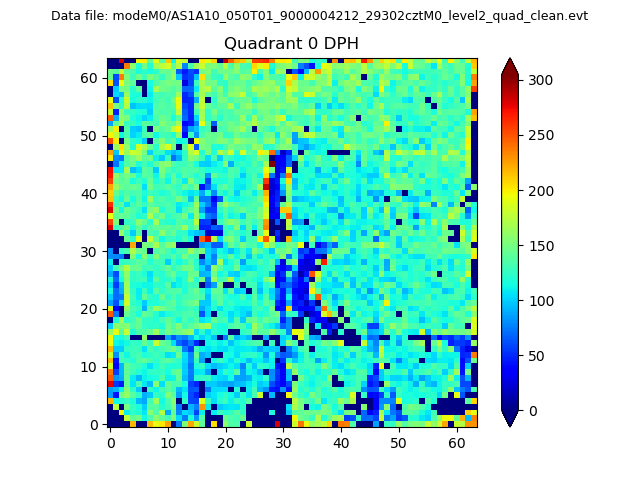 |
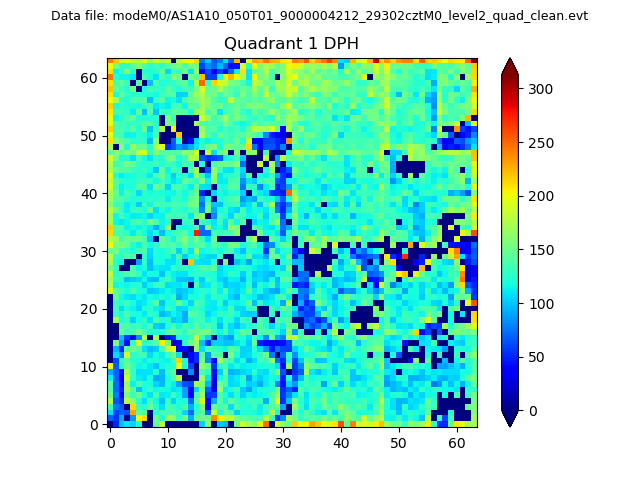 |
Quadrant B |
|---|---|---|---|
| Quadrant D | 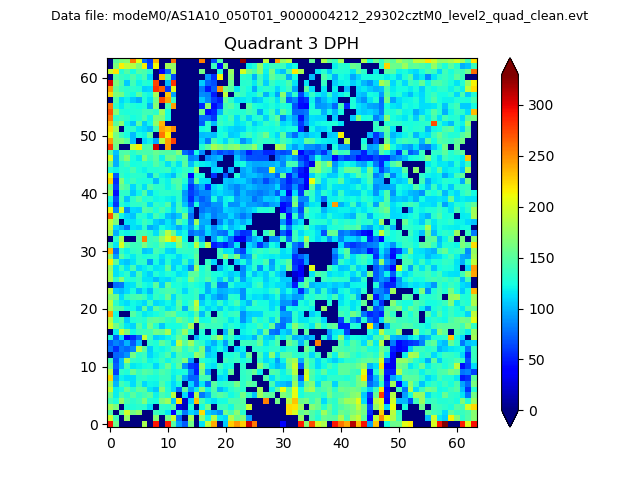 |
 |
Quadrant C |
| Plot type | Count rate plots | Images |
|---|---|---|
| Comparison with Poisson distribution Blue bars denote a histogram of data divided into 1 sec bins. Red curve is a Poisson curve with rate = median count rate of data. |
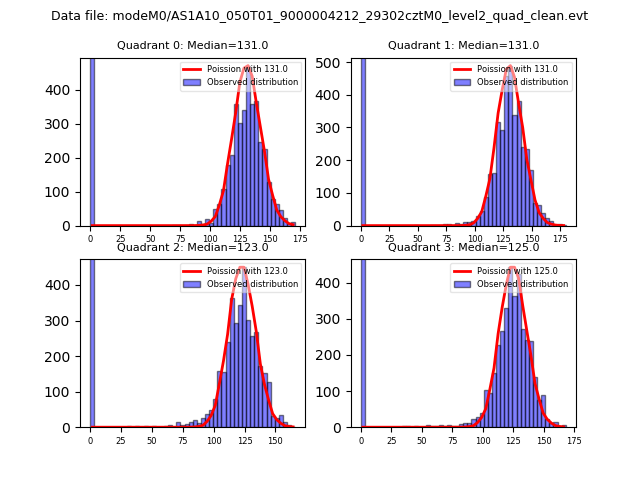 |
 |
| Quadrant-wise count rates Data is divided into 100 sec bins |
 |
|
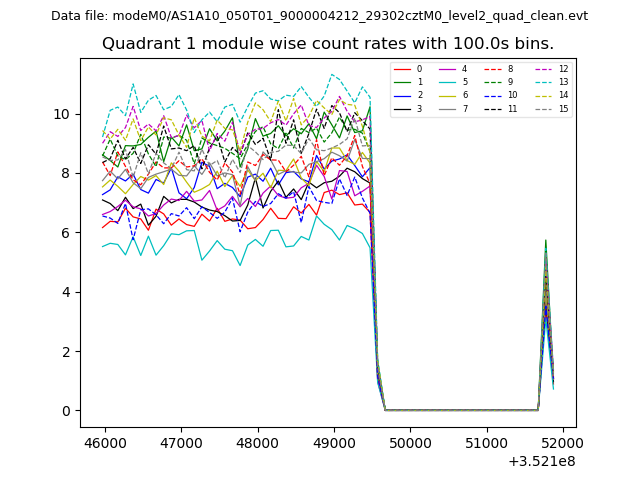
| Module-wise count rates for Quadrant A Data is divided into 100 sec bins |
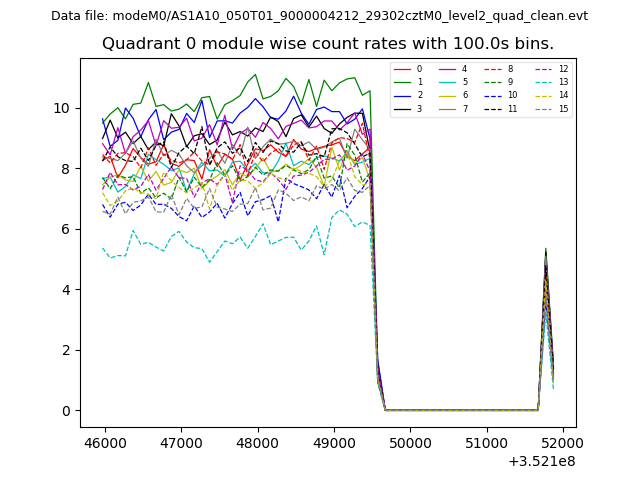 |
 |
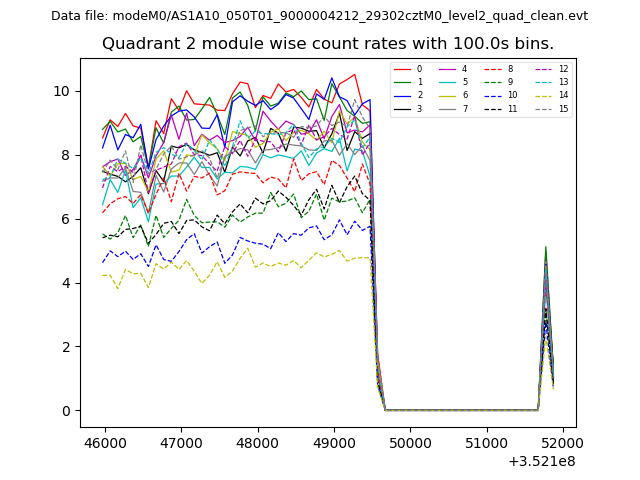
| Module-wise count rates for Quadrant B Data is divided into 100 sec bins |
 |
 |
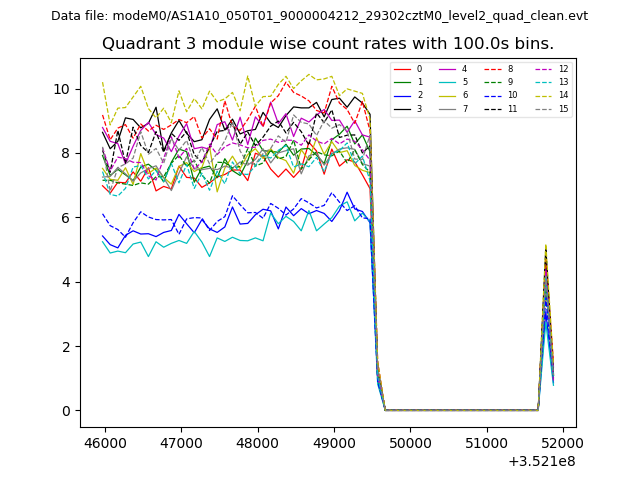
| Module-wise count rates for Quadrant C Data is divided into 100 sec bins |
 |
 |
| Module-wise count rates for Quadrant D Data is divided into 100 sec bins |
 |
 |
| Parameter | Plot |
|---|---|
| CZT HV Monitor | 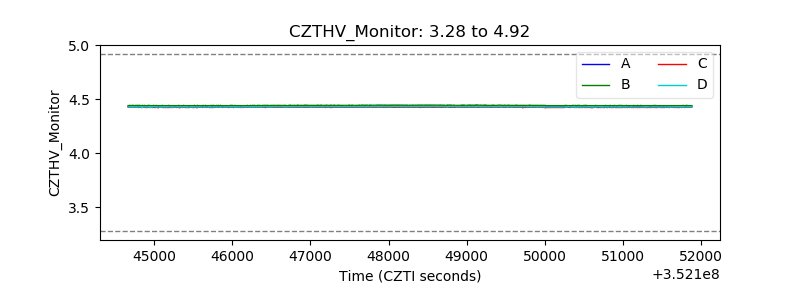 |
| D_VDD | 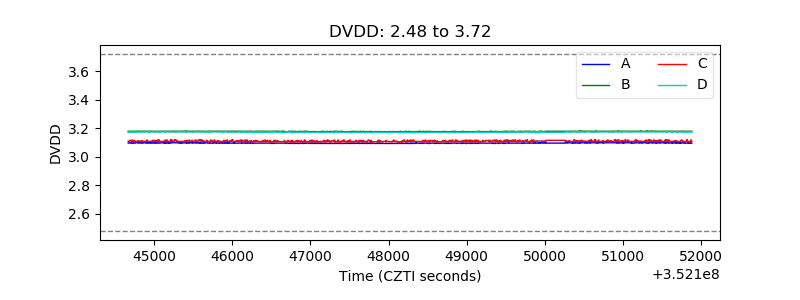 |
| Temperature 1 | 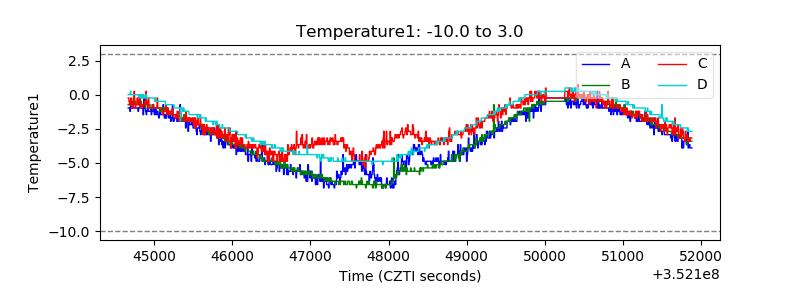 |
| Veto HV Monitor | 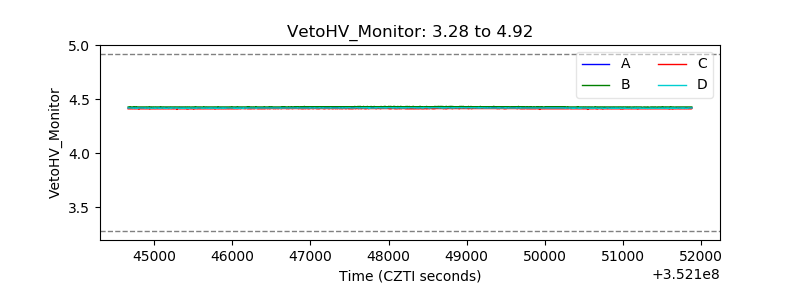 |
| Veto LLD | 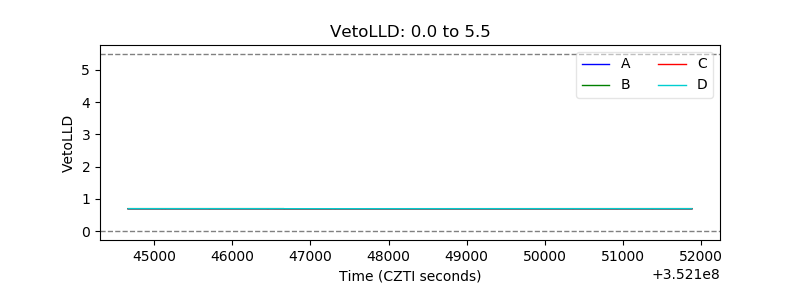 |
| Alpha Counter |  |
| _CPM_Rate | 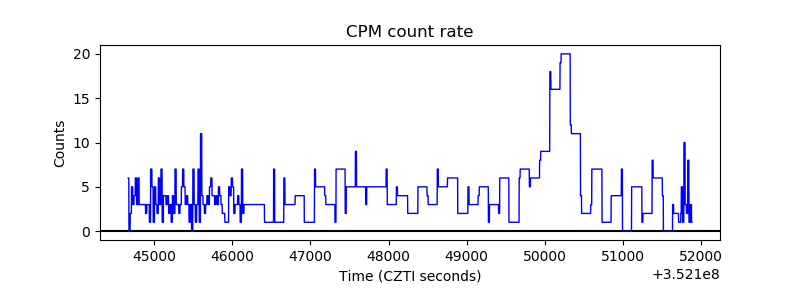 |
| CZT Counter | 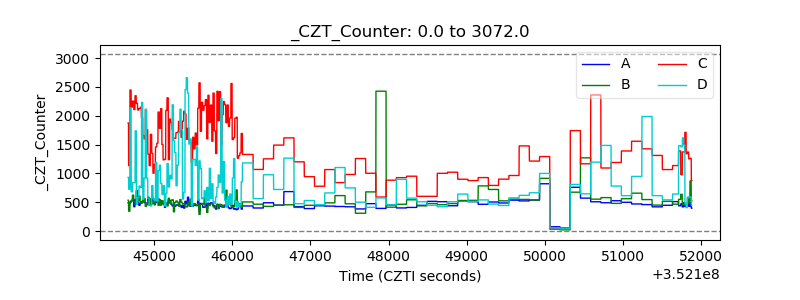 |
| +2.5 Volts monitor | 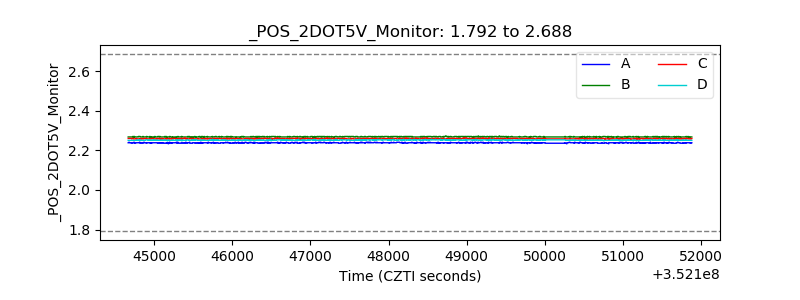 |
| +5 Volts monitor |  |
| _ROLL_ROT | 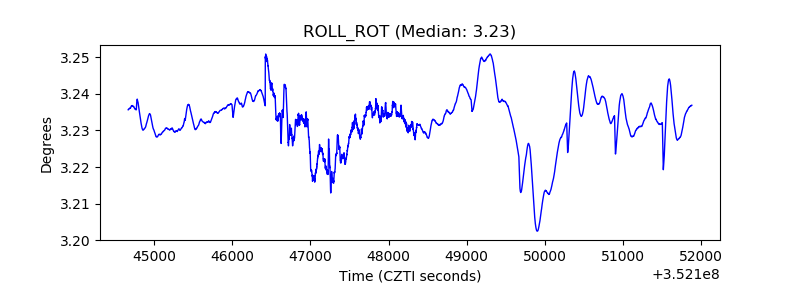 |
| _Roll_DEC |  |
| _Roll_RA | 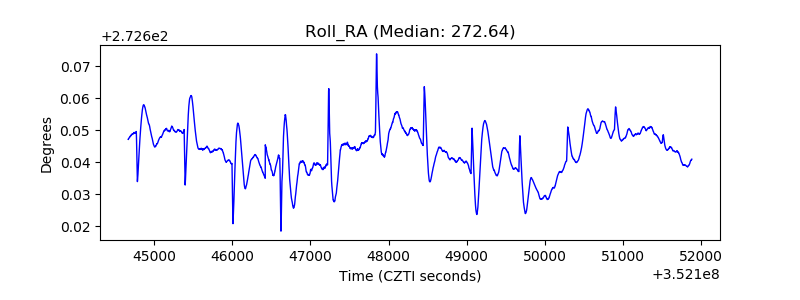 |
| Veto Counter | 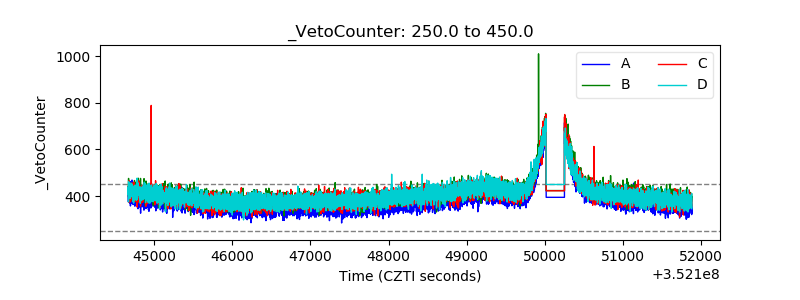 |