| Param | Original file | Final file |
|---|---|---|
| Filename | modeM0/AS1A10_050T01_9000004212_29303cztM0_level2.evt | modeM0/AS1A10_050T01_9000004212_29303cztM0_level2_quad_clean.evt |
| Size (bytes) | 833,719,680 | 84,628,800 |
| Size | 795.1 MB | 80.7 MB |
| Events in quadrant A | 3,425,284 | 537,484 |
| Events in quadrant B | 4,910,344 | 531,212 |
| Events in quadrant C | 9,203,515 | 495,236 |
| Events in quadrant D | 7,224,425 | 497,076 |
| Mode M9 | |||
|---|---|---|---|
| Quadrant | BADHDUFLAG | Total packets | Discarded packets |
| A | 0 | 4 | 0 |
| B | 0 | 4 | 0 |
| C | 0 | 4 | 0 |
| D | 0 | 4 | 0 |
| Mode M0 | |||
|---|---|---|---|
| Quadrant | BADHDUFLAG | Total packets | Discarded packets |
| A | 0 | 14751 | 1 |
| B | 0 | 19234 | 1 |
| C | 0 | 32466 | 4 |
| D | 0 | 26443 | 1 |
| Mode SS | |||
|---|---|---|---|
| Quadrant | BADHDUFLAG | Total packets | Discarded packets |
| A | 0 | 146 | 0 |
| B | 0 | 146 | 0 |
| C | 0 | 146 | 0 |
| D | 0 | 146 | 0 |
| Quadrant | Total seconds | Saturated seconds | Saturation percentage |
|---|---|---|---|
| A | 7203 | 54 | 0.749688% |
| B | 7204 | 481 | 6.676846% |
| C | 7203 | 1824 | 25.322782% |
| D | 7203 | 987 | 13.702624% |
Noise dominated data is calculated using 1-second bins in cleaned event files. If a bin has >2000 counts, and if more than 50% of those come from <1% of pixels, then it is considered to be noise-dominated and hence unusable.
| Quadrant | # 1 sec bins | Bins with >0 counts | Bins with >2000 counts | High rate bins dominated by noise | Noise dominated (total time) | Noise dominated (detector-on time) | Marked lightcurve |
|---|---|---|---|---|---|---|---|
| A | 7583 | 7204 | 0 | 0 | 0.00% | 0.00% | 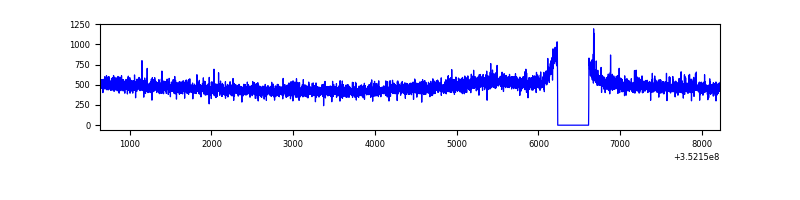 |
| B | 7584 | 7205 | 268 | 268 | 3.53% | 3.72% | 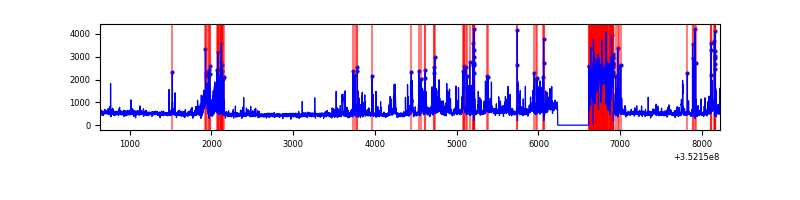 |
| C | 7583 | 7204 | 446 | 446 | 5.88% | 6.19% | 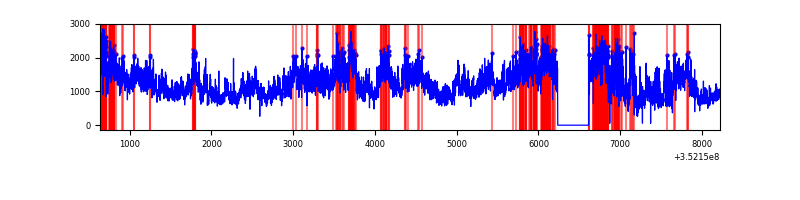 |
| D | 7583 | 7203 | 653 | 653 | 8.61% | 9.07% | 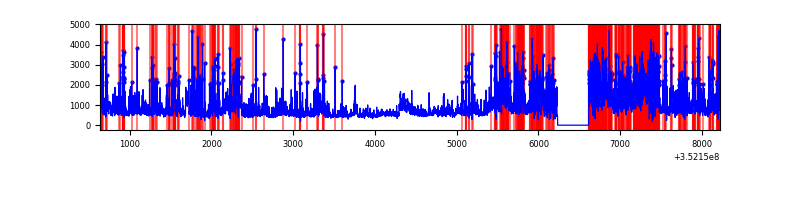 |
Top three noisy pixels from each quadrant. If the there are fewer than three noisy pixels in the level2.evt file, extra rows are filled as -1
| Pixel properties | Quadrant properties | ||||||
|---|---|---|---|---|---|---|---|
| Quadrant | DetID | PixID | Counts | Sigma | Mean | Median | Sigma |
| A | 13 | 254 | 16181 | 85.59 | 884 | 865 | 178.9 |
| A | 3 | 137 | 8438 | 42.32 | 884 | 865 | 178.9 |
| A | 0 | 226 | 7843 | 39.0 | 884 | 865 | 178.9 |
| B | 10 | 245 | 570751 | 3541.15 | 841 | 820 | 160.9 |
| B | 5 | 172 | 549497 | 3409.09 | 841 | 820 | 160.9 |
| B | 5 | 255 | 415728 | 2577.95 | 841 | 820 | 160.9 |
| C | 3 | 233 | 5799635 | 32806.77 | 751 | 757 | 176.8 |
| C | 14 | 238 | 241659 | 1362.89 | 751 | 757 | 176.8 |
| C | 14 | 254 | 195593 | 1102.27 | 751 | 757 | 176.8 |
| D | 1 | 52 | 2183132 | 11246.91 | 804 | 782 | 194.0 |
| D | 12 | 233 | 867888 | 4468.7 | 804 | 782 | 194.0 |
| D | 8 | 195 | 433224 | 2228.62 | 804 | 782 | 194.0 |
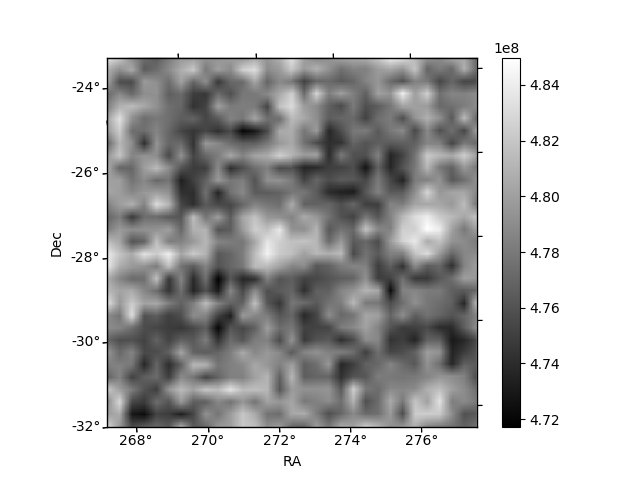
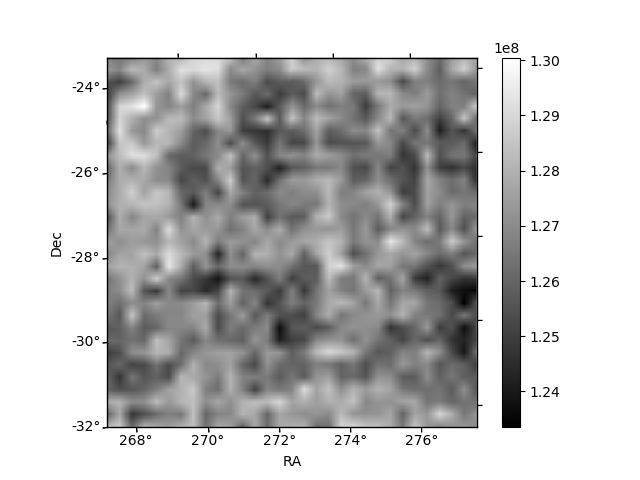
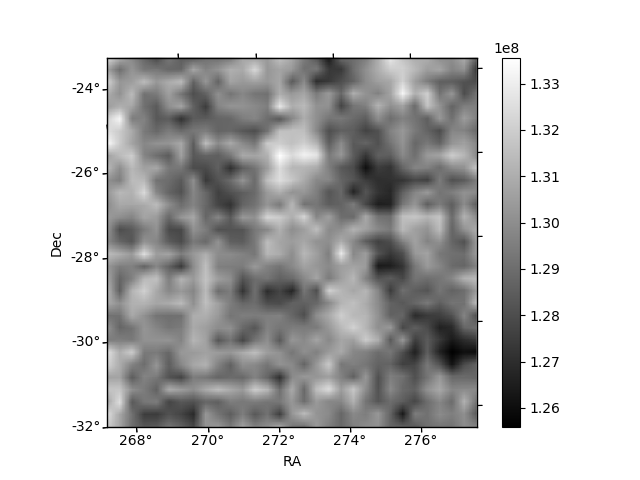
Histogram calculated using DETX and DETY for each event in the final _common_clean file
| Quadrant A | 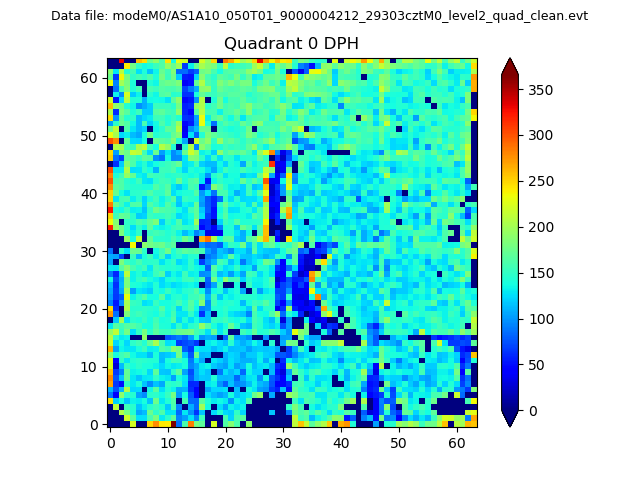 |
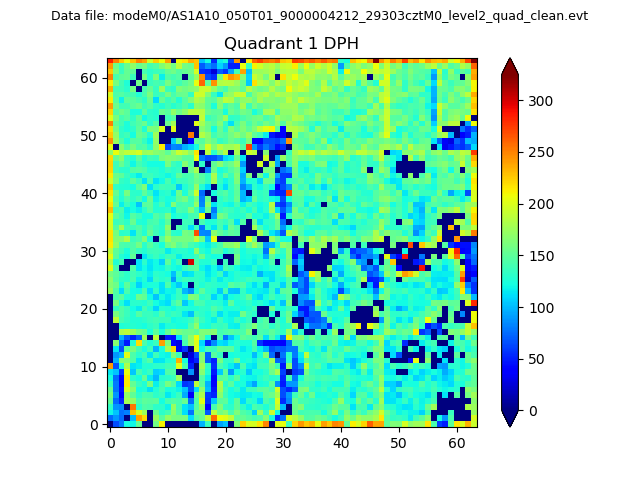 |
Quadrant B |
|---|---|---|---|
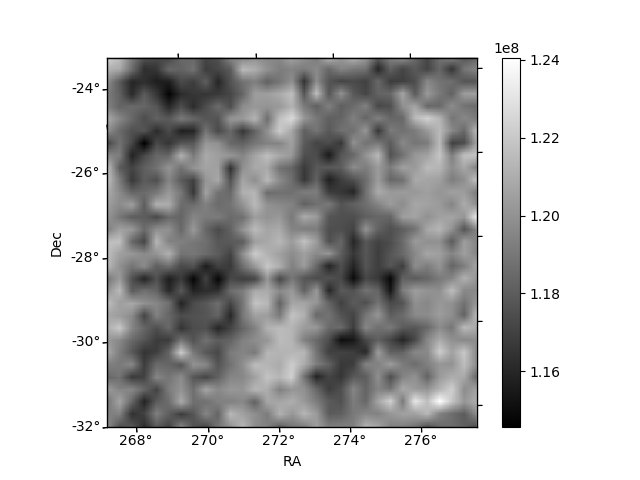
| Quadrant D | 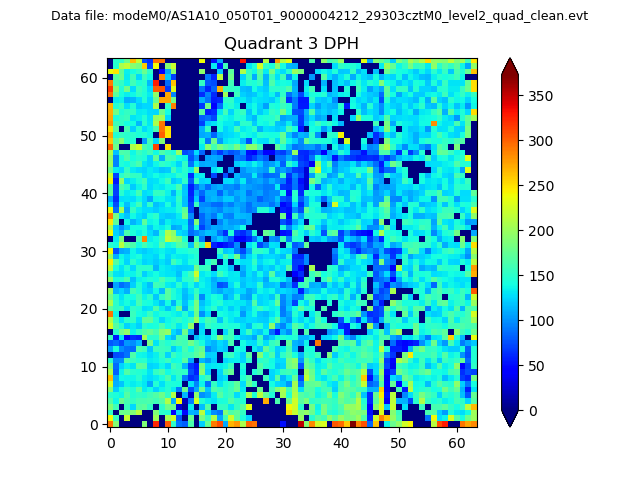 |
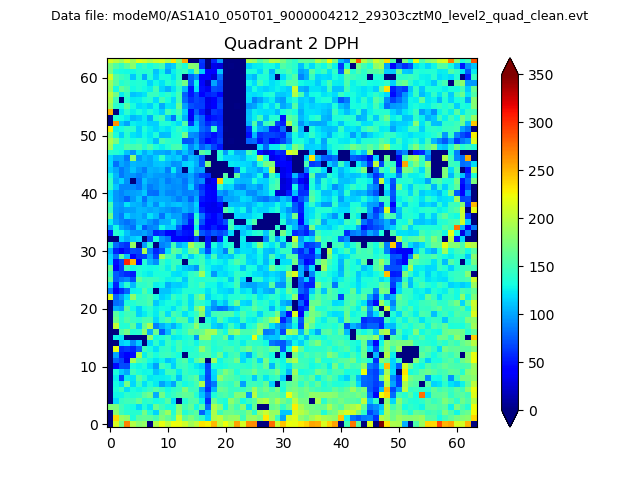 |
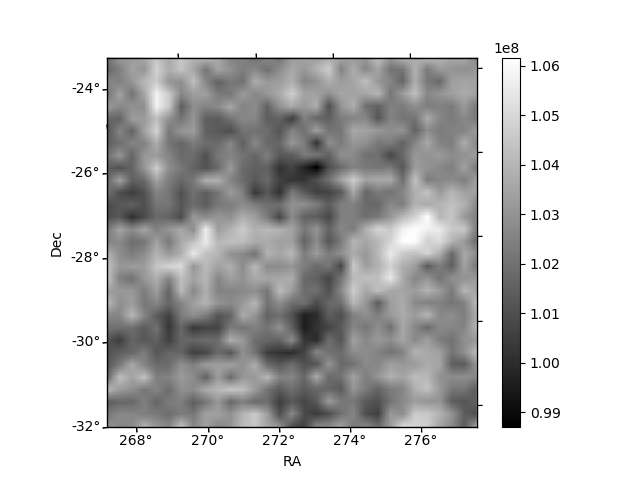
Quadrant C |
| Plot type | Count rate plots | Images |
|---|---|---|
| Comparison with Poisson distribution Blue bars denote a histogram of data divided into 1 sec bins. Red curve is a Poisson curve with rate = median count rate of data. |
 |
 |
| Quadrant-wise count rates Data is divided into 100 sec bins |
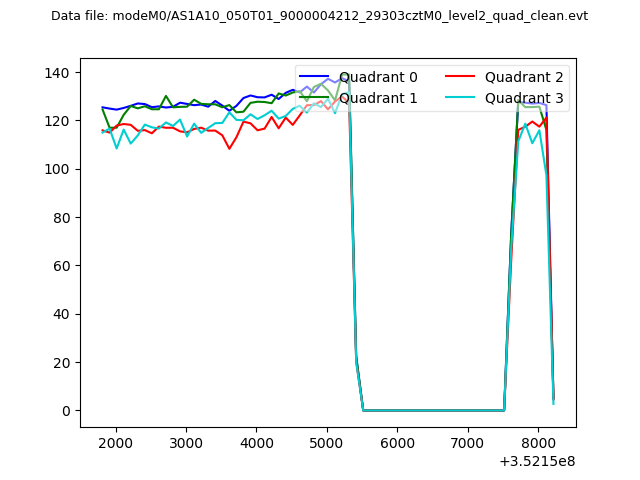 |
|
| Module-wise count rates for Quadrant A Data is divided into 100 sec bins |
 |
 |
| Module-wise count rates for Quadrant B Data is divided into 100 sec bins |
 |
 |
| Module-wise count rates for Quadrant C Data is divided into 100 sec bins |
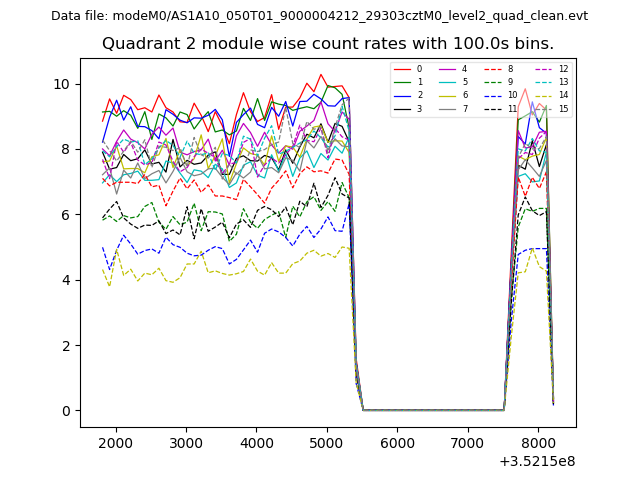 |
 |
| Module-wise count rates for Quadrant D Data is divided into 100 sec bins |
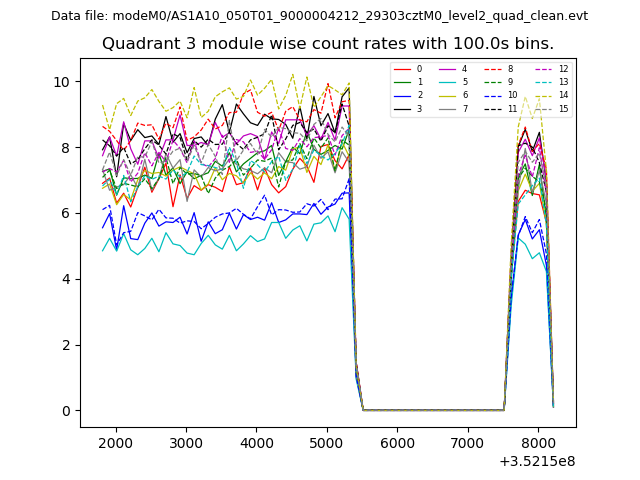 |
 |
| Parameter | Plot |
|---|---|
| CZT HV Monitor |  |
| D_VDD | 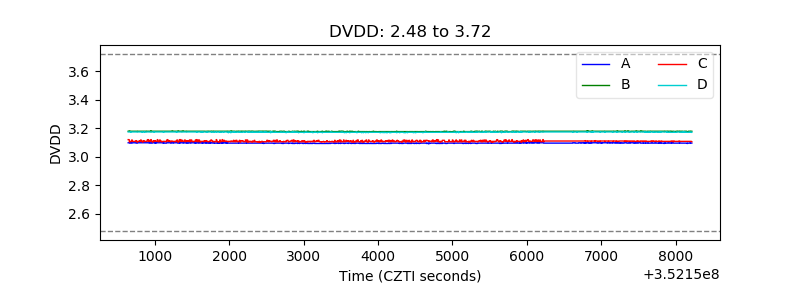 |
| Temperature 1 | 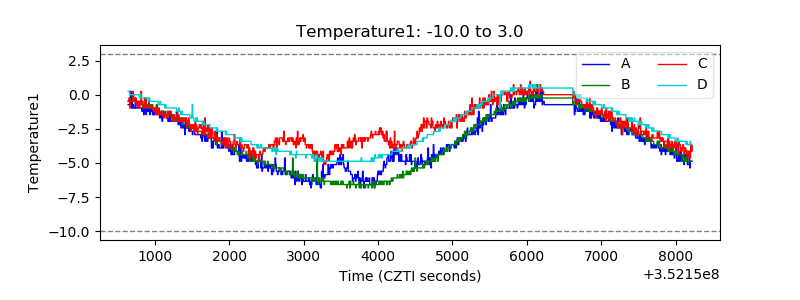 |
| Veto HV Monitor | 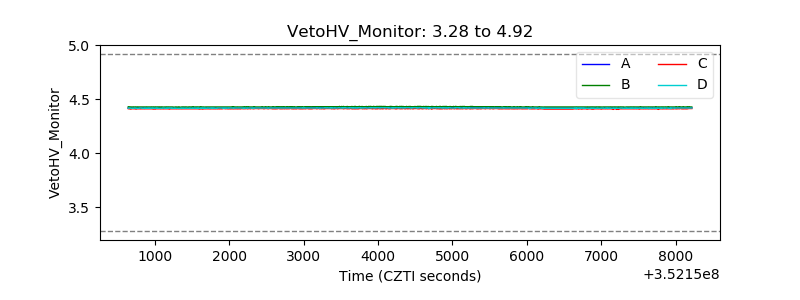 |
| Veto LLD | 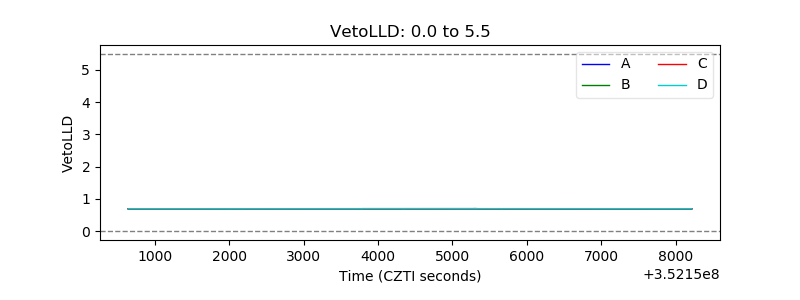 |
| Alpha Counter |  |
| _CPM_Rate | 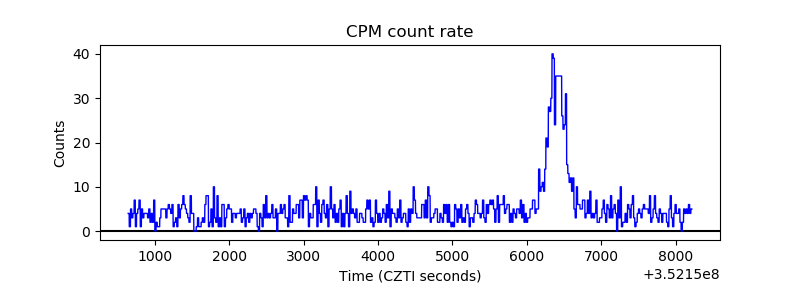 |
| CZT Counter | 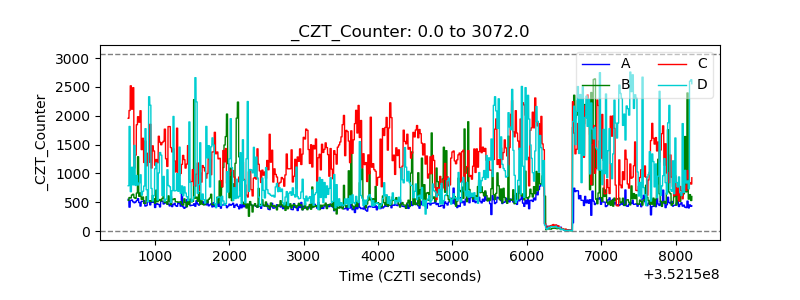 |
| +2.5 Volts monitor | 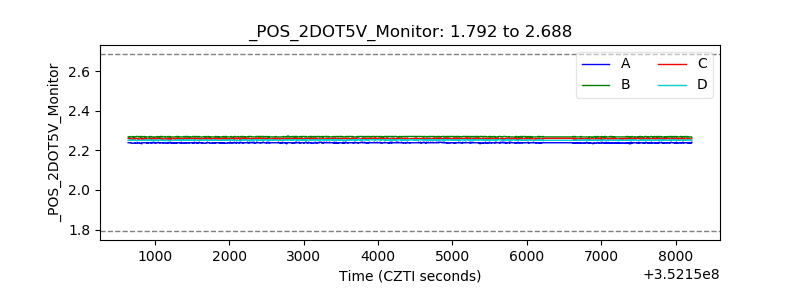 |
| +5 Volts monitor |  |
| _ROLL_ROT | 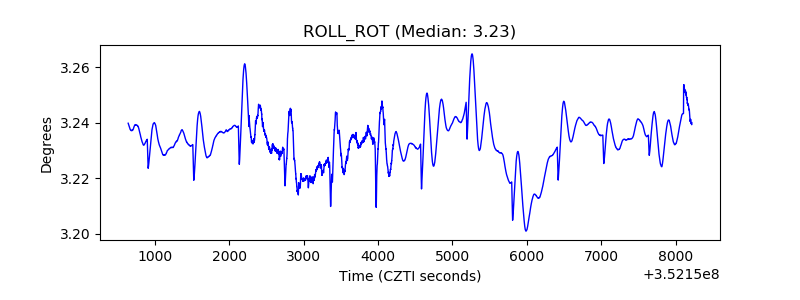 |
| _Roll_DEC |  |
| _Roll_RA | 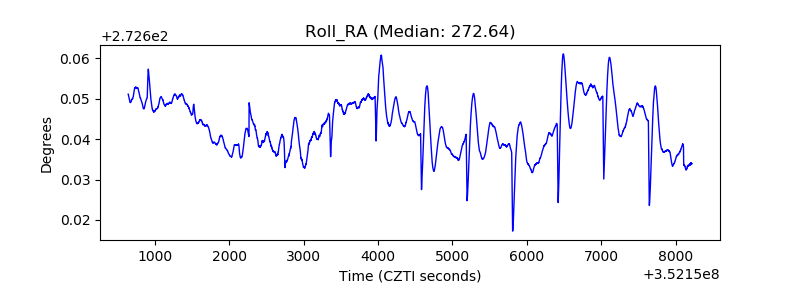 |
| Veto Counter |  |