| Param | Original file | Final file |
|---|---|---|
| Filename | modeM0/AS1A10_050T01_9000004212_29305cztM0_level2.evt | modeM0/AS1A10_050T01_9000004212_29305cztM0_level2_quad_clean.evt |
| Size (bytes) | 622,788,480 | 69,822,720 |
| Size | 593.9 MB | 66.6 MB |
| Events in quadrant A | 2,570,721 | 458,441 |
| Events in quadrant B | 4,427,786 | 440,105 |
| Events in quadrant C | 5,964,394 | 429,072 |
| Events in quadrant D | 5,533,132 | 408,259 |
| Mode M9 | |||
|---|---|---|---|
| Quadrant | BADHDUFLAG | Total packets | Discarded packets |
| A | 0 | 5 | 0 |
| B | 0 | 5 | 0 |
| C | 0 | 5 | 0 |
| D | 0 | 5 | 0 |
| Mode M0 | |||
|---|---|---|---|
| Quadrant | BADHDUFLAG | Total packets | Discarded packets |
| A | 0 | 11200 | 1 |
| B | 0 | 16696 | 1 |
| C | 0 | 21568 | 1 |
| D | 0 | 20176 | 1 |
| Mode SS | |||
|---|---|---|---|
| Quadrant | BADHDUFLAG | Total packets | Discarded packets |
| A | 0 | 112 | 0 |
| B | 0 | 112 | 0 |
| C | 0 | 112 | 0 |
| D | 0 | 112 | 0 |
| Quadrant | Total seconds | Saturated seconds | Saturation percentage |
|---|---|---|---|
| A | 5392 | 23 | 0.426558% |
| B | 5393 | 501 | 9.289820% |
| C | 5393 | 947 | 17.559800% |
| D | 5393 | 755 | 13.999629% |
Noise dominated data is calculated using 1-second bins in cleaned event files. If a bin has >2000 counts, and if more than 50% of those come from <1% of pixels, then it is considered to be noise-dominated and hence unusable.
| Quadrant | # 1 sec bins | Bins with >0 counts | Bins with >2000 counts | High rate bins dominated by noise | Noise dominated (total time) | Noise dominated (detector-on time) | Marked lightcurve |
|---|---|---|---|---|---|---|---|
| A | 5962 | 5393 | 4 | 4 | 0.07% | 0.07% | 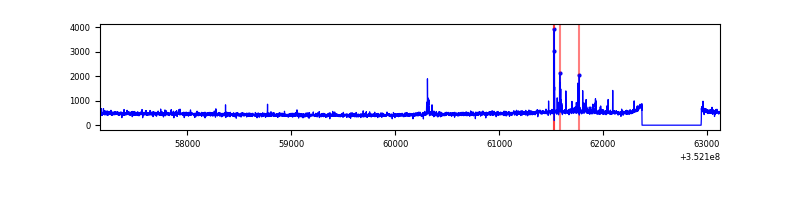 |
| B | 5963 | 5394 | 329 | 329 | 5.52% | 6.10% | 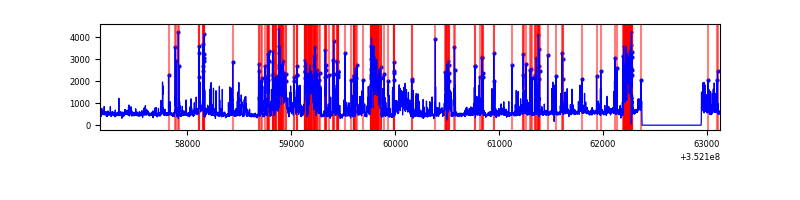 |
| C | 5963 | 5394 | 113 | 113 | 1.90% | 2.09% | 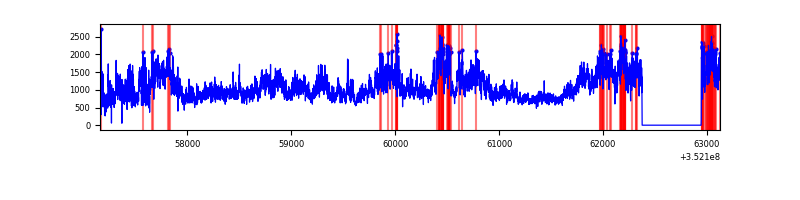 |
| D | 5963 | 5394 | 527 | 527 | 8.84% | 9.77% | 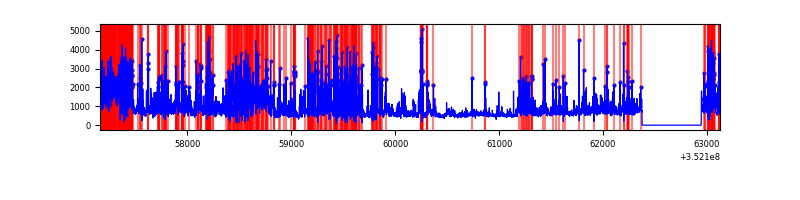 |
Top three noisy pixels from each quadrant. If the there are fewer than three noisy pixels in the level2.evt file, extra rows are filled as -1
| Pixel properties | Quadrant properties | ||||||
|---|---|---|---|---|---|---|---|
| Quadrant | DetID | PixID | Counts | Sigma | Mean | Median | Sigma |
| A | 0 | 13 | 57830 | 433.23 | 650 | 634 | 132.0 |
| A | 13 | 254 | 11071 | 79.05 | 650 | 634 | 132.0 |
| A | 3 | 137 | 6173 | 41.95 | 650 | 634 | 132.0 |
| B | 5 | 255 | 1360393 | 11314.52 | 623 | 606 | 120.2 |
| B | 10 | 245 | 578365 | 4807.42 | 623 | 606 | 120.2 |
| B | 12 | 111 | 14287 | 113.84 | 623 | 606 | 120.2 |
| C | 3 | 233 | 3386686 | 24884.96 | 574 | 577 | 136.1 |
| C | 14 | 238 | 179558 | 1315.35 | 574 | 577 | 136.1 |
| C | 14 | 254 | 135527 | 991.77 | 574 | 577 | 136.1 |
| D | 1 | 52 | 2056478 | 14127.16 | 599 | 584 | 145.5 |
| D | 12 | 233 | 433461 | 2974.53 | 599 | 584 | 145.5 |
| D | 7 | 80 | 224629 | 1539.53 | 599 | 584 | 145.5 |
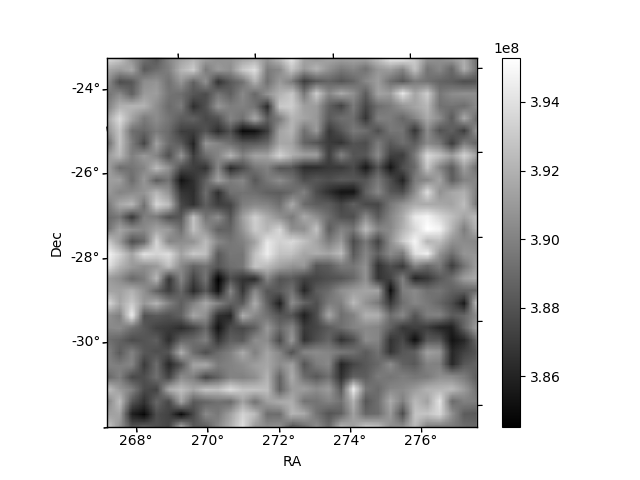
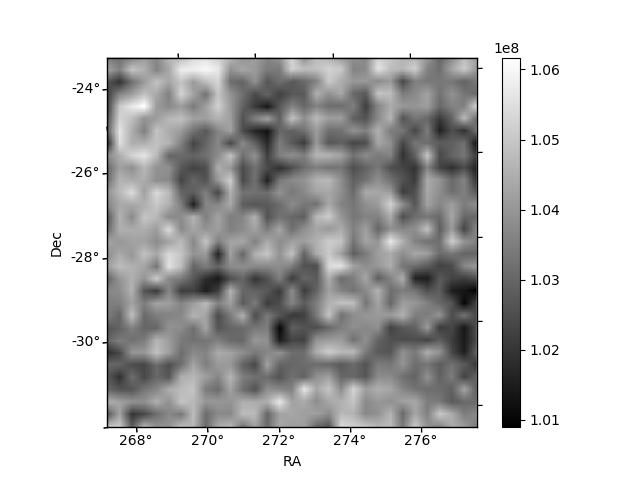
Histogram calculated using DETX and DETY for each event in the final _common_clean file
| Quadrant A | 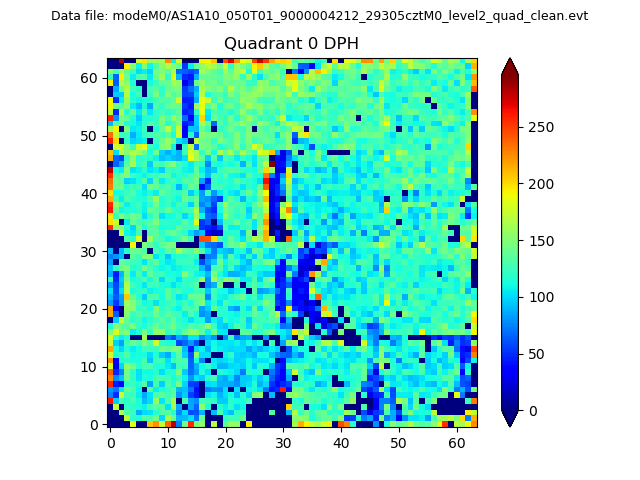 |
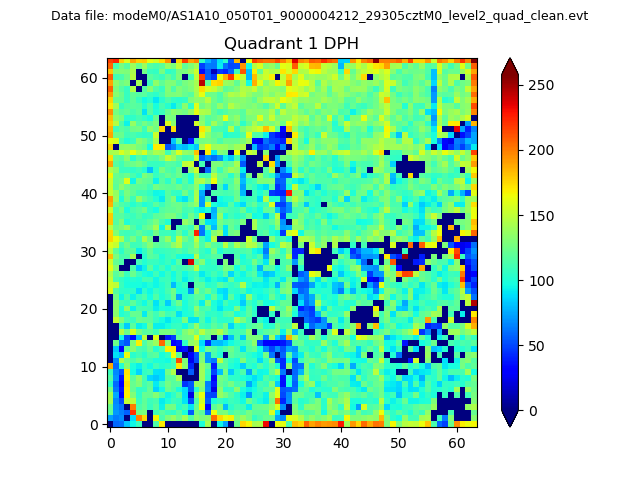 |
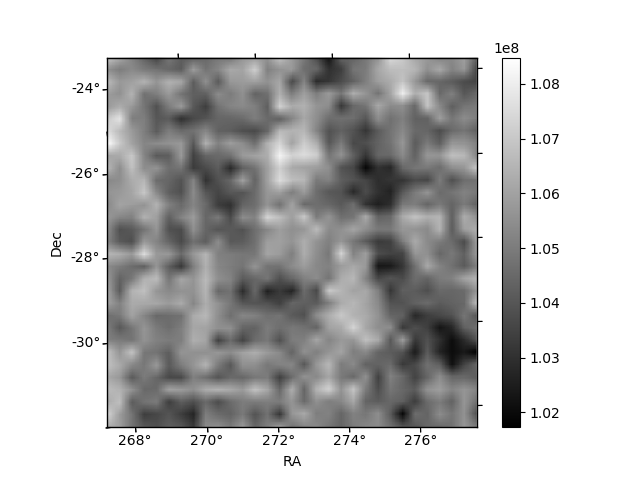
Quadrant B |
|---|---|---|---|
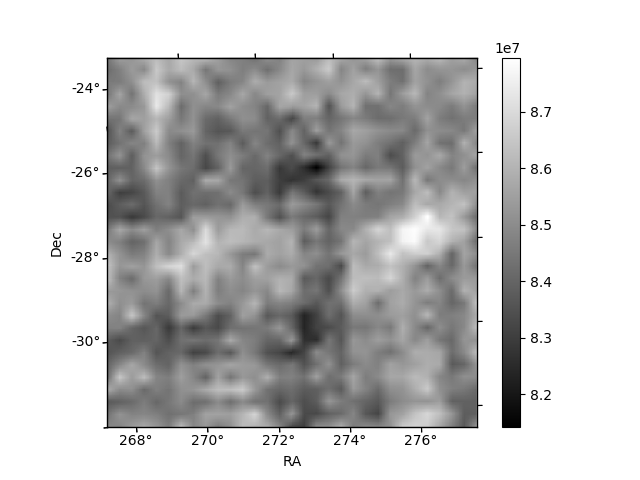
| Quadrant D | 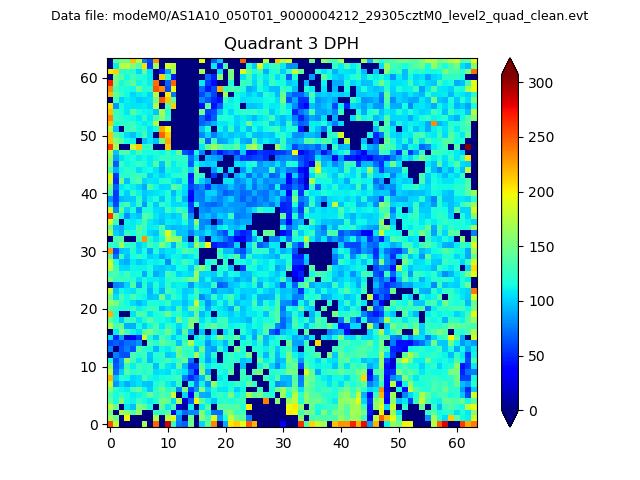 |
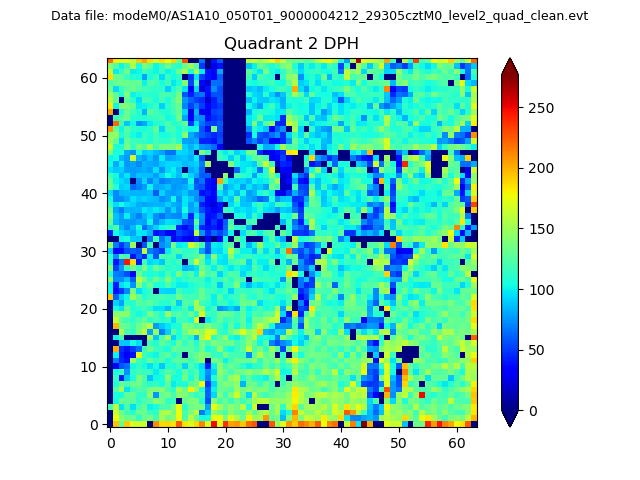 |
Quadrant C |
| Plot type | Count rate plots | Images |
|---|---|---|
| Comparison with Poisson distribution Blue bars denote a histogram of data divided into 1 sec bins. Red curve is a Poisson curve with rate = median count rate of data. |
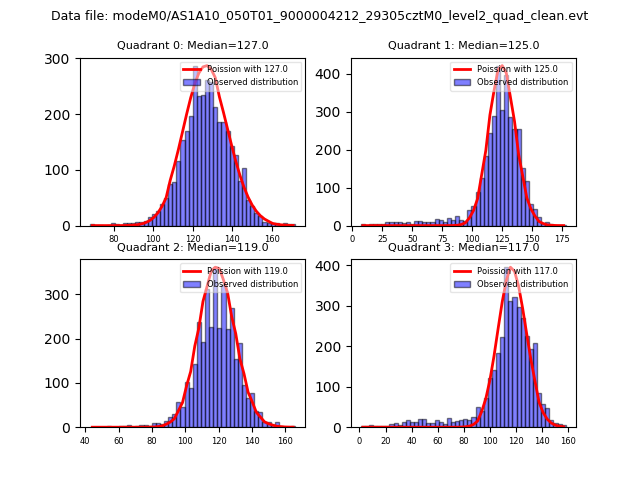 |
 |
| Quadrant-wise count rates Data is divided into 100 sec bins |
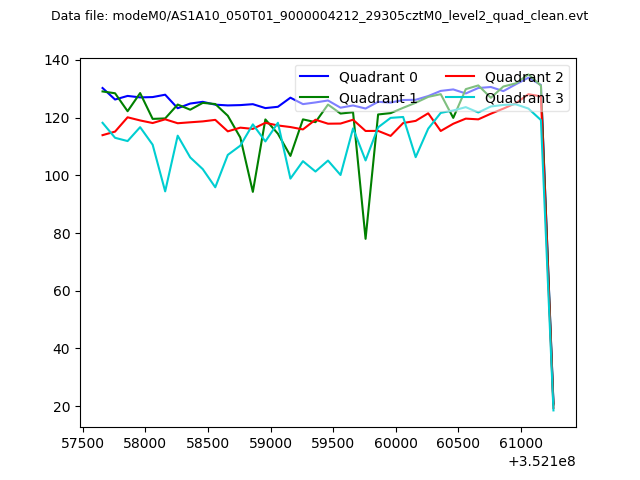 |
|
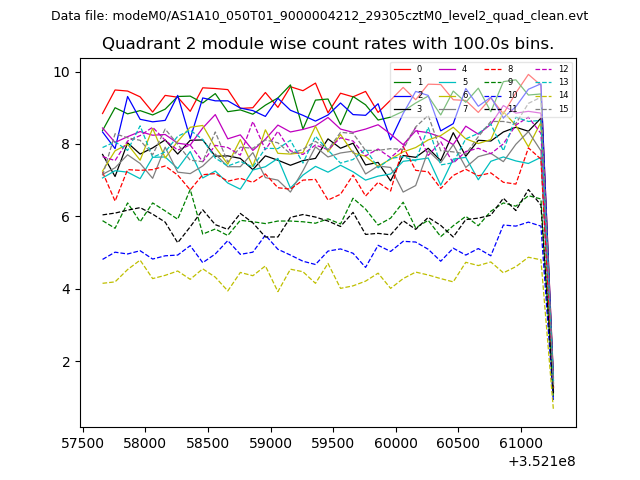
| Module-wise count rates for Quadrant A Data is divided into 100 sec bins |
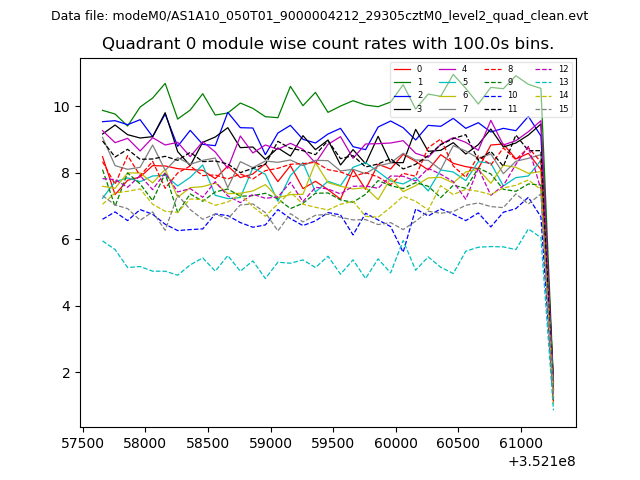 |
 |
| Module-wise count rates for Quadrant B Data is divided into 100 sec bins |
 |
 |
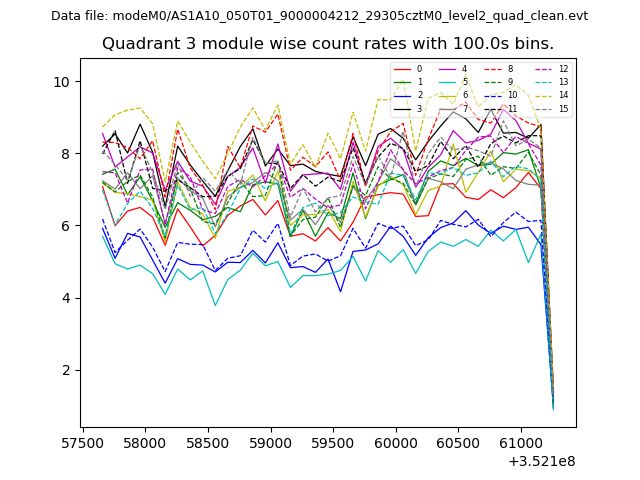
| Module-wise count rates for Quadrant C Data is divided into 100 sec bins |
 |
 |
| Module-wise count rates for Quadrant D Data is divided into 100 sec bins |
 |
 |
| Parameter | Plot |
|---|---|
| CZT HV Monitor |  |
| D_VDD | 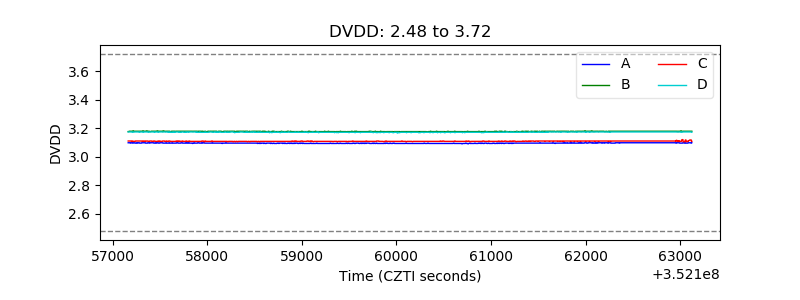 |
| Temperature 1 | 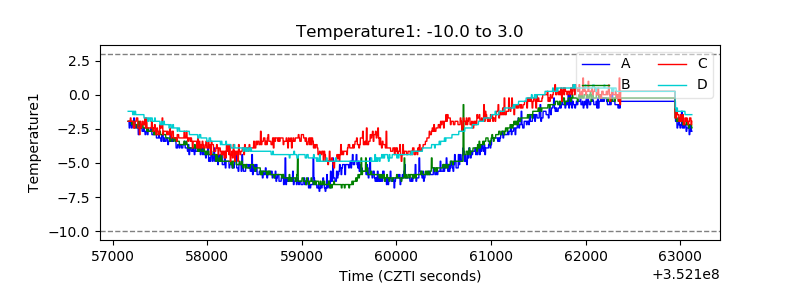 |
| Veto HV Monitor | 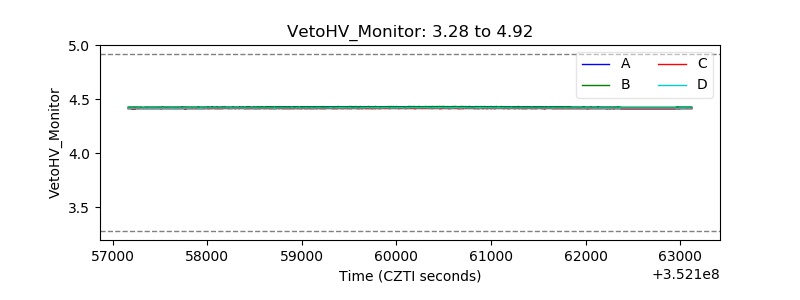 |
| Veto LLD | 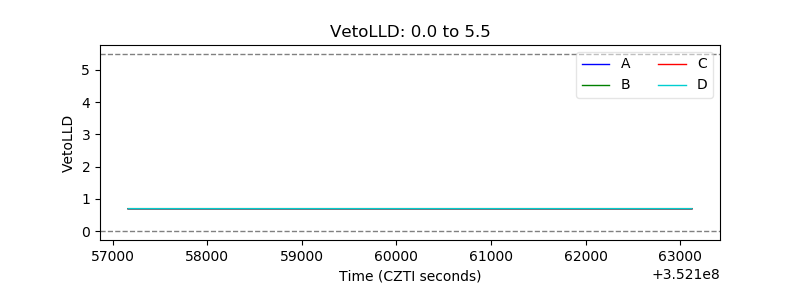 |
| Alpha Counter | 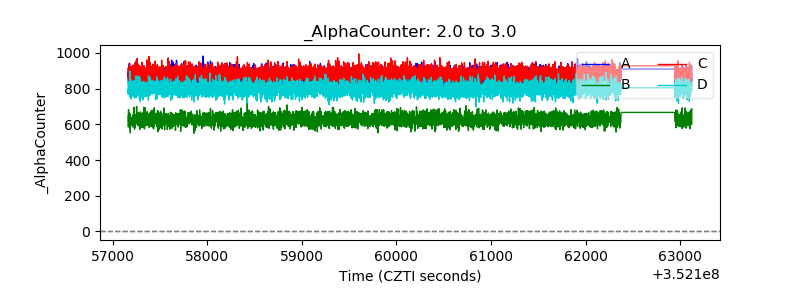 |
| _CPM_Rate | 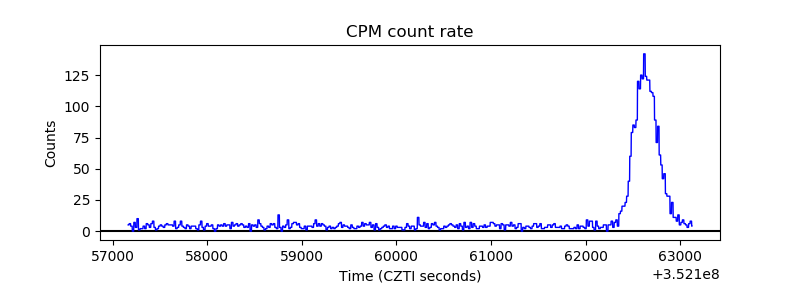 |
| CZT Counter | 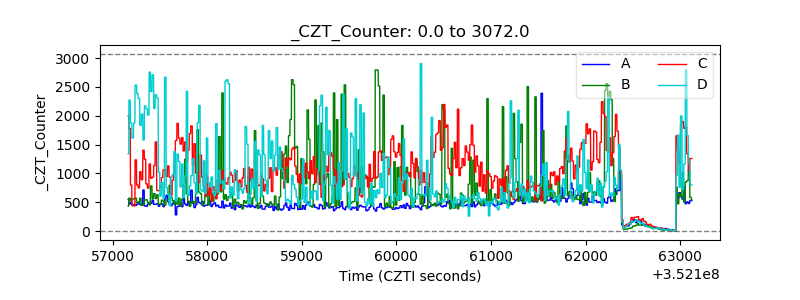 |
| +2.5 Volts monitor | 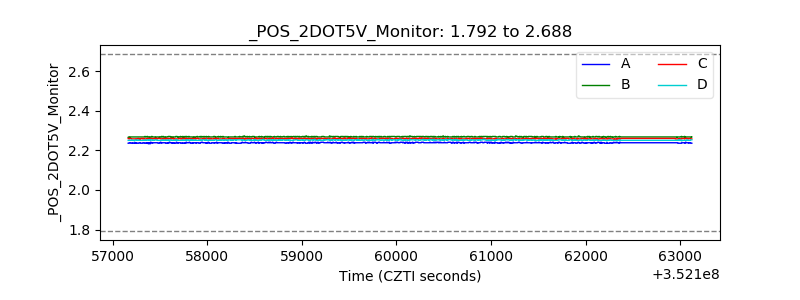 |
| +5 Volts monitor | 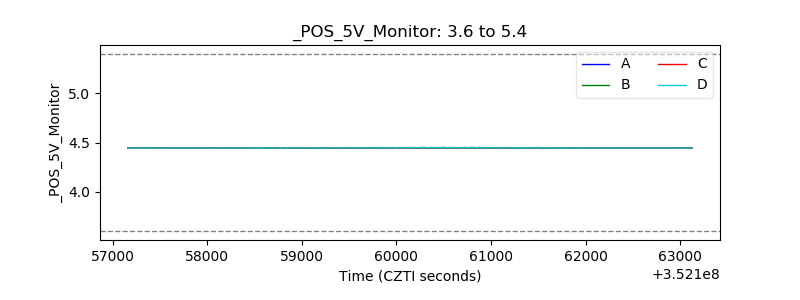 |
| _ROLL_ROT | 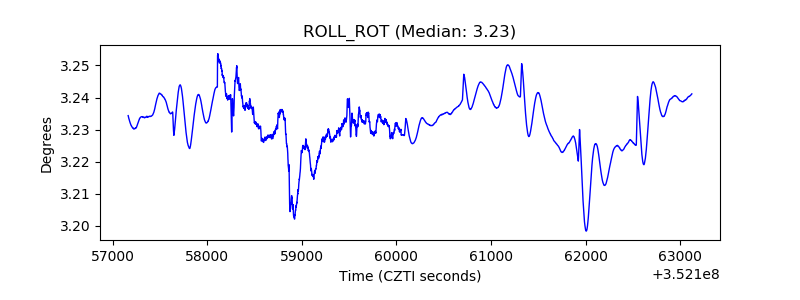 |
| _Roll_DEC | 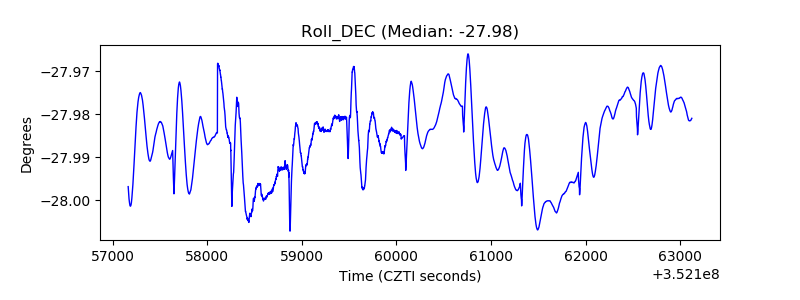 |
| _Roll_RA | 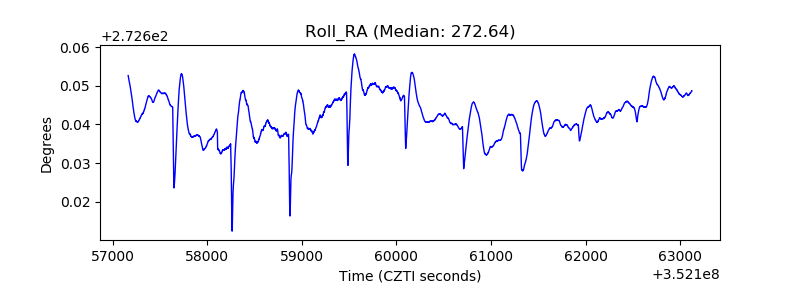 |
| Veto Counter | 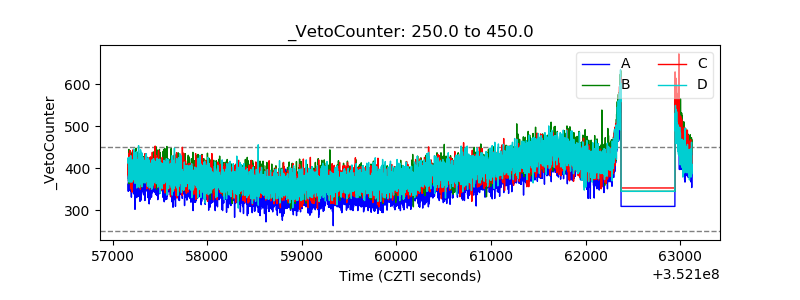 |