| Param | Original file | Final file |
|---|---|---|
| Filename | modeM0/AS1A10_050T01_9000004212_29306cztM0_level2.evt | modeM0/AS1A10_050T01_9000004212_29306cztM0_level2_quad_clean.evt |
| Size (bytes) | 1,228,916,160 | 168,416,640 |
| Size | 1.1 GB | 160.6 MB |
| Events in quadrant A | 6,466,774 | 1,109,299 |
| Events in quadrant B | 9,267,683 | 1,069,431 |
| Events in quadrant C | 9,909,929 | 1,045,318 |
| Events in quadrant D | 10,742,327 | 1,023,537 |
| Mode M9 | |||
|---|---|---|---|
| Quadrant | BADHDUFLAG | Total packets | Discarded packets |
| A | 0 | 16 | 0 |
| B | 0 | 16 | 0 |
| C | 0 | 16 | 0 |
| D | 0 | 16 | 0 |
| Mode M0 | |||
|---|---|---|---|
| Quadrant | BADHDUFLAG | Total packets | Discarded packets |
| A | 0 | 27241 | 2 |
| B | 0 | 35860 | 2 |
| C | 0 | 38162 | 2 |
| D | 0 | 40357 | 2 |
| Mode SS | |||
|---|---|---|---|
| Quadrant | BADHDUFLAG | Total packets | Discarded packets |
| A | 0 | 250 | 0 |
| B | 0 | 250 | 0 |
| C | 0 | 250 | 0 |
| D | 0 | 250 | 0 |
| Quadrant | Total seconds | Saturated seconds | Saturation percentage |
|---|---|---|---|
| A | 12331 | 164 | 1.329981% |
| B | 12332 | 1092 | 8.855011% |
| C | 12332 | 1596 | 12.941940% |
| D | 12332 | 1071 | 8.684723% |
Noise dominated data is calculated using 1-second bins in cleaned event files. If a bin has >2000 counts, and if more than 50% of those come from <1% of pixels, then it is considered to be noise-dominated and hence unusable.
| Quadrant | # 1 sec bins | Bins with >0 counts | Bins with >2000 counts | High rate bins dominated by noise | Noise dominated (total time) | Noise dominated (detector-on time) | Marked lightcurve |
|---|---|---|---|---|---|---|---|
| A | 13931 | 12333 | 92 | 92 | 0.66% | 0.75% | 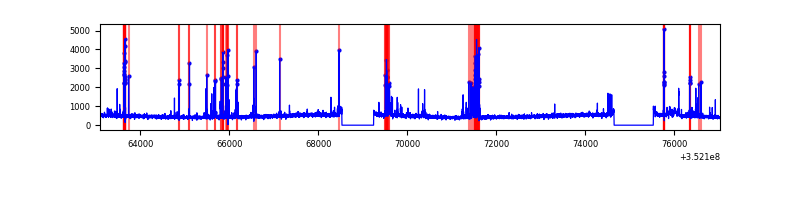 |
| B | 13932 | 12334 | 624 | 624 | 4.48% | 5.06% | 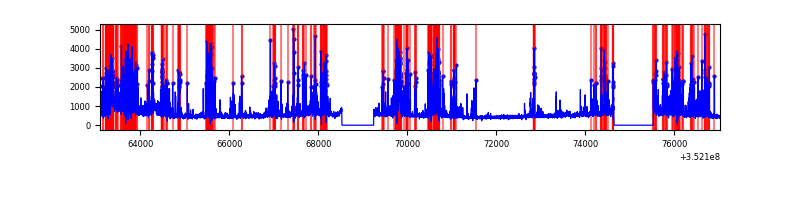 |
| C | 13932 | 12333 | 46 | 46 | 0.33% | 0.37% | 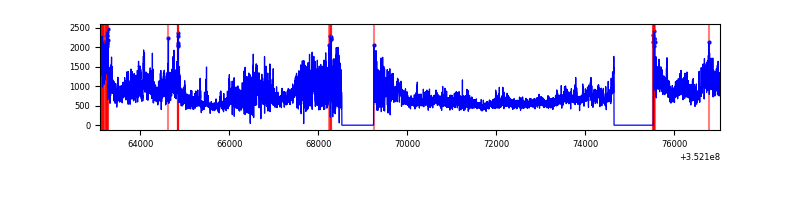 |
| D | 13932 | 12334 | 786 | 786 | 5.64% | 6.37% | 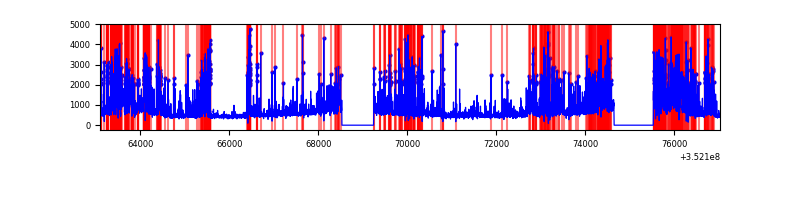 |
Top three noisy pixels from each quadrant. If the there are fewer than three noisy pixels in the level2.evt file, extra rows are filled as -1
| Pixel properties | Quadrant properties | ||||||
|---|---|---|---|---|---|---|---|
| Quadrant | DetID | PixID | Counts | Sigma | Mean | Median | Sigma |
| A | 0 | 13 | 623411 | 2066.69 | 1493 | 1461 | 300.9 |
| A | 15 | 174 | 55183 | 178.51 | 1493 | 1461 | 300.9 |
| A | 13 | 254 | 24785 | 77.5 | 1493 | 1461 | 300.9 |
| B | 5 | 255 | 3005857 | 11080.84 | 1437 | 1400 | 271.1 |
| B | 10 | 245 | 554733 | 2040.77 | 1437 | 1400 | 271.1 |
| B | 12 | 111 | 33325 | 117.74 | 1437 | 1400 | 271.1 |
| C | 3 | 233 | 3791510 | 11904.19 | 1351 | 1361 | 318.4 |
| C | 14 | 238 | 447350 | 1400.77 | 1351 | 1361 | 318.4 |
| C | 14 | 254 | 350485 | 1096.54 | 1351 | 1361 | 318.4 |
| D | 1 | 52 | 3263566 | 9509.69 | 1416 | 1378 | 343.0 |
| D | 2 | 250 | 546583 | 1589.34 | 1416 | 1378 | 343.0 |
| D | 8 | 195 | 454164 | 1319.93 | 1416 | 1378 | 343.0 |
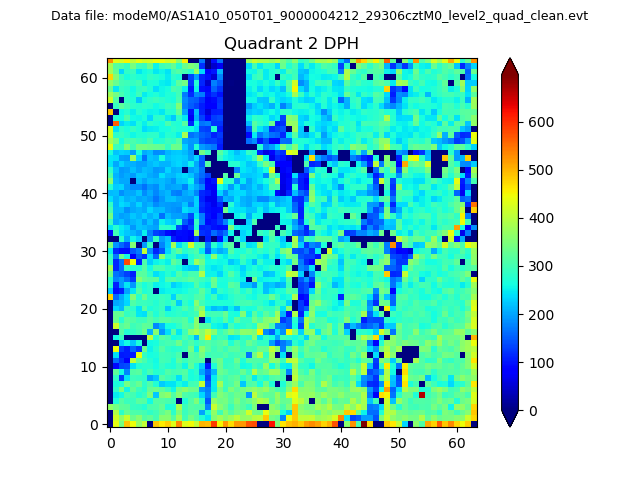
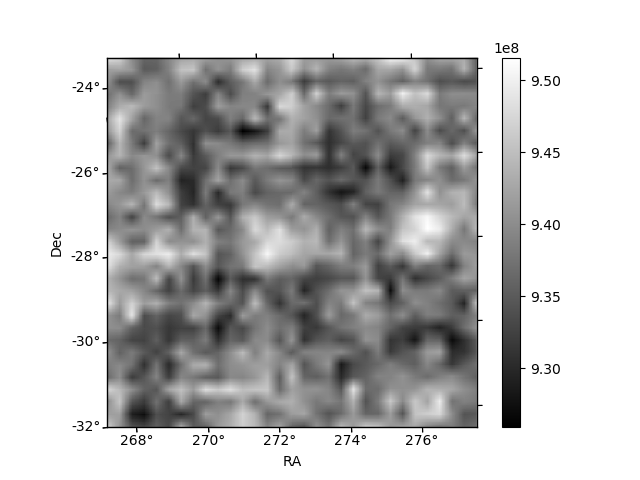
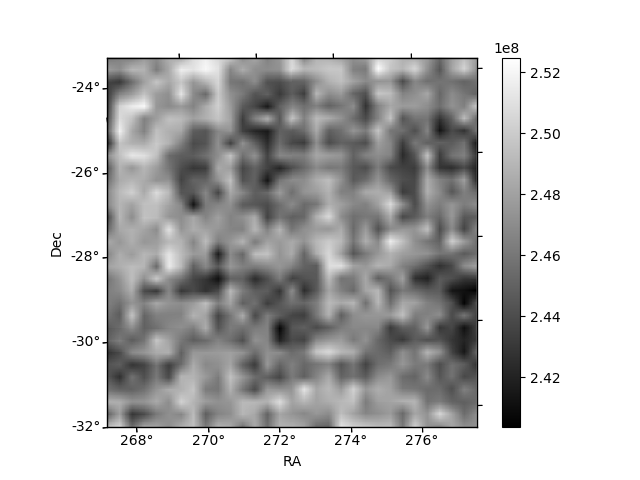
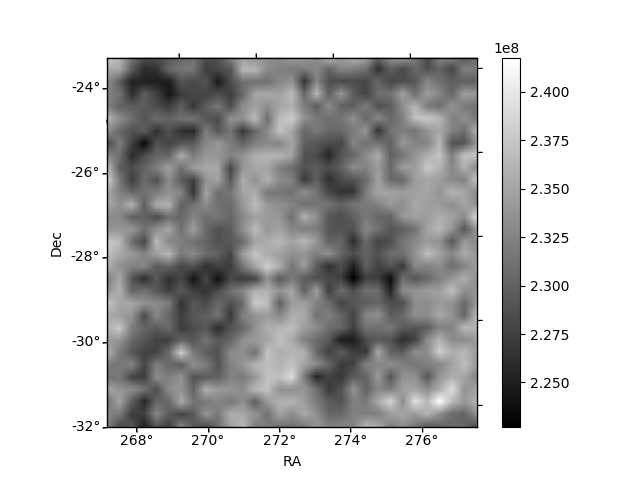
Histogram calculated using DETX and DETY for each event in the final _common_clean file
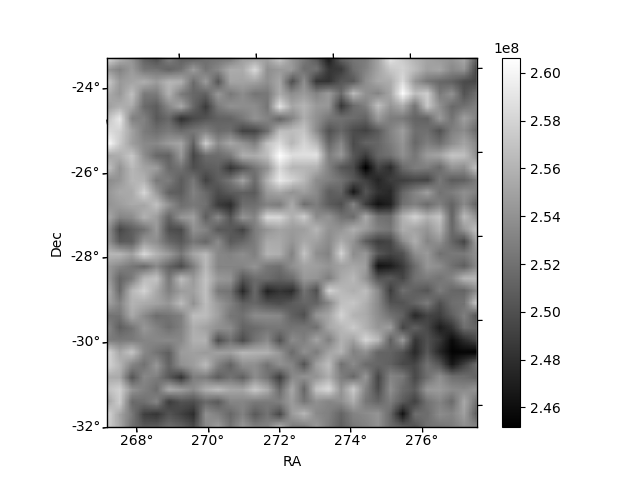
| Quadrant A | 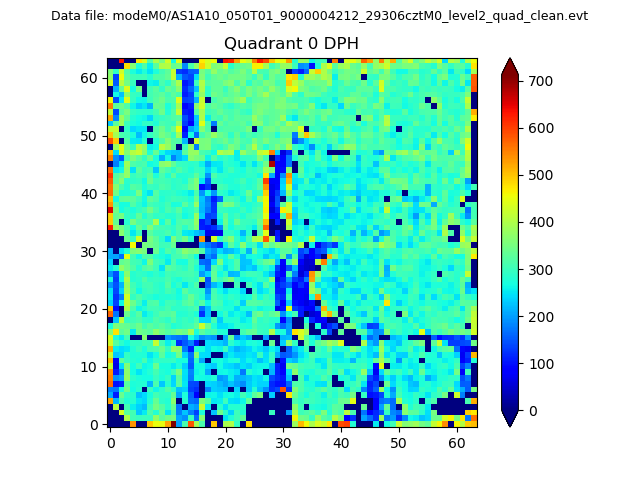 |
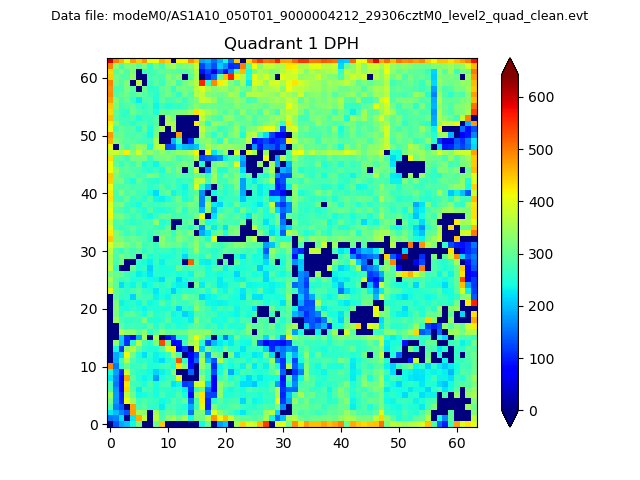 |
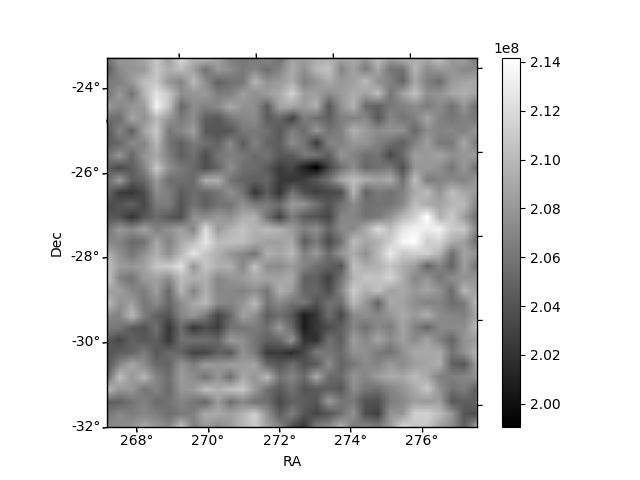
Quadrant B |
|---|---|---|---|
| Quadrant D | 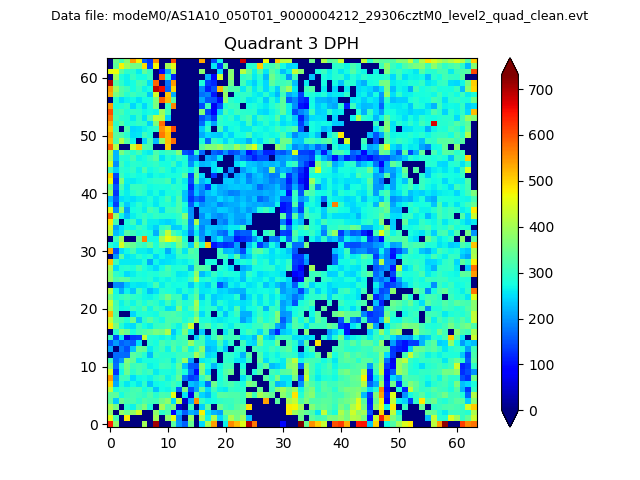 |
 |
Quadrant C |
| Plot type | Count rate plots | Images |
|---|---|---|
| Comparison with Poisson distribution Blue bars denote a histogram of data divided into 1 sec bins. Red curve is a Poisson curve with rate = median count rate of data. |
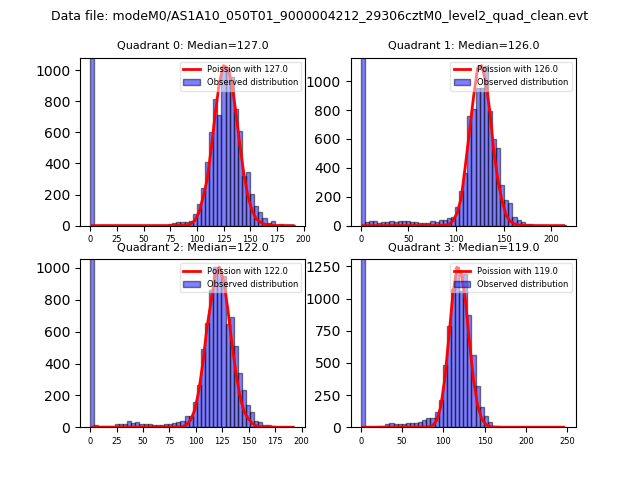 |
 |
| Quadrant-wise count rates Data is divided into 100 sec bins |
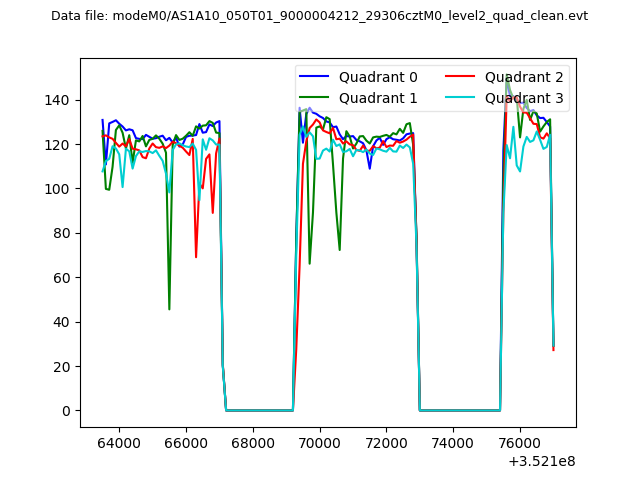 |
|
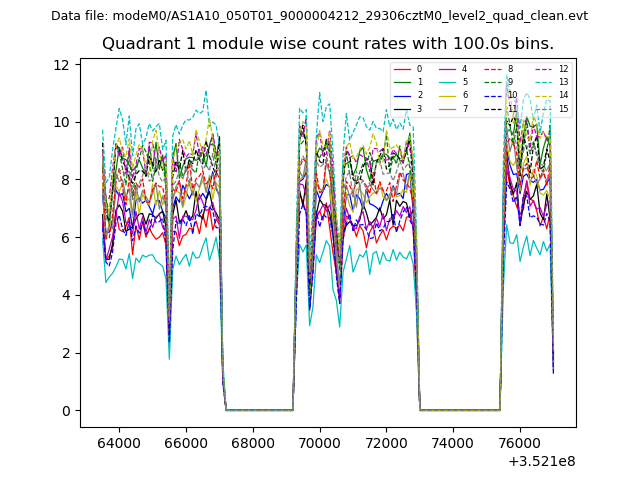
| Module-wise count rates for Quadrant A Data is divided into 100 sec bins |
 |
 |
| Module-wise count rates for Quadrant B Data is divided into 100 sec bins |
 |
 |
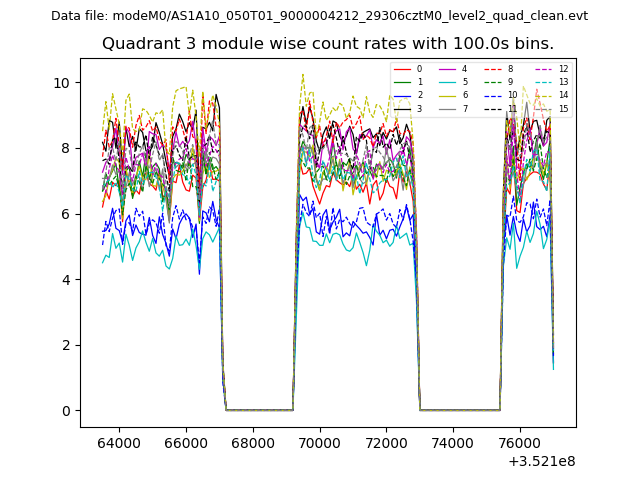
| Module-wise count rates for Quadrant C Data is divided into 100 sec bins |
 |
 |
| Module-wise count rates for Quadrant D Data is divided into 100 sec bins |
 |
 |
| Parameter | Plot |
|---|---|
| CZT HV Monitor |  |
| D_VDD | 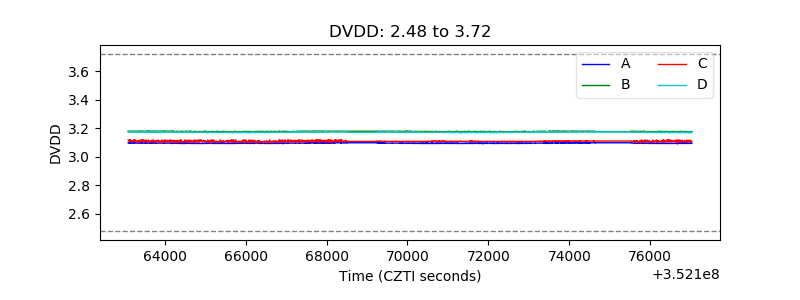 |
| Temperature 1 | 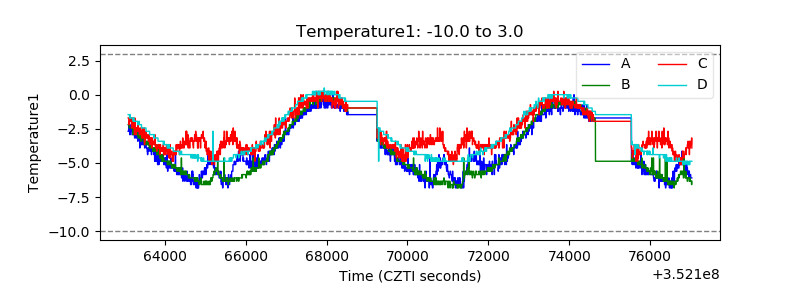 |
| Veto HV Monitor |  |
| Veto LLD | 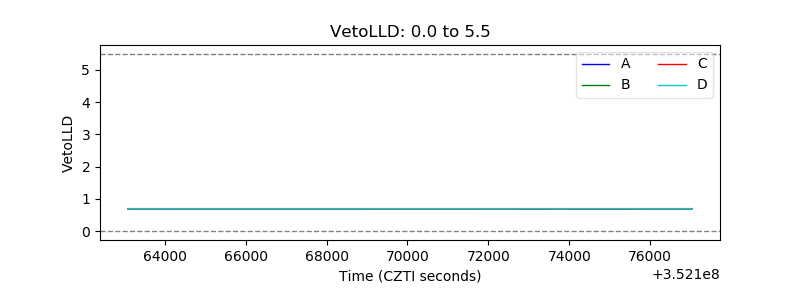 |
| Alpha Counter |  |
| _CPM_Rate | 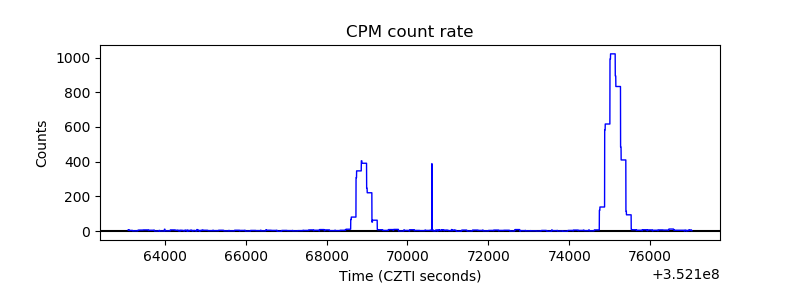 |
| CZT Counter | 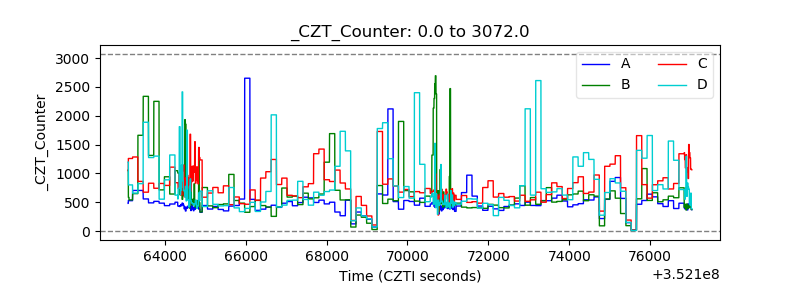 |
| +2.5 Volts monitor | 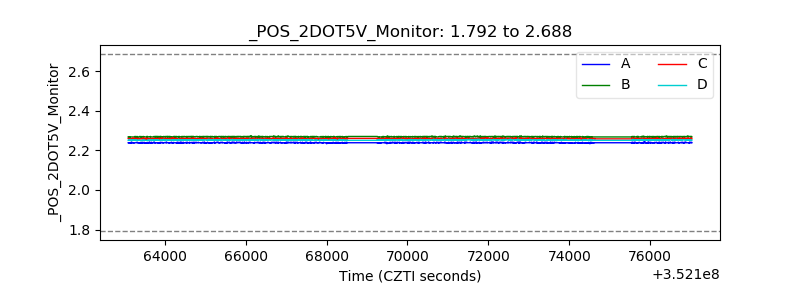 |
| +5 Volts monitor |  |
| _ROLL_ROT | 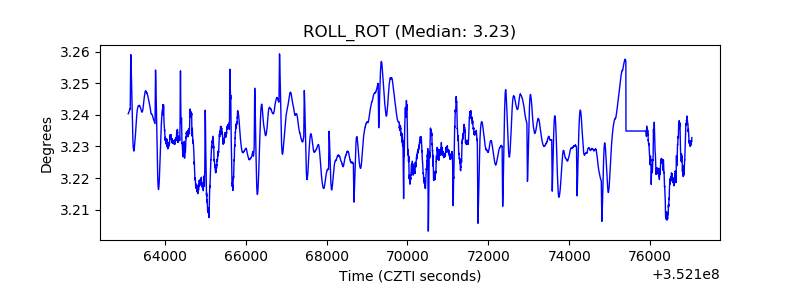 |
| _Roll_DEC |  |
| _Roll_RA | 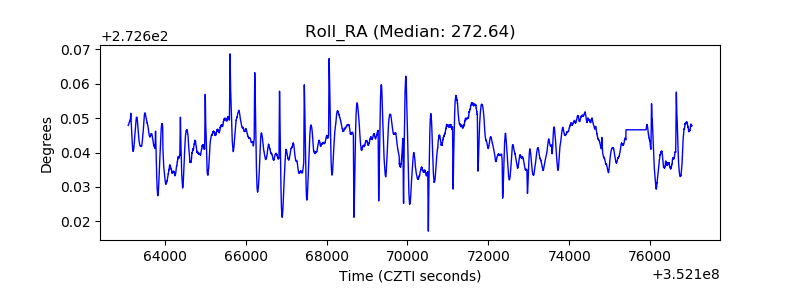 |
| Veto Counter |  |