| Param | Original file | Final file |
|---|---|---|
| Filename | modeM0/AS1A10_050T01_9000004212_29309cztM0_level2.evt | modeM0/AS1A10_050T01_9000004212_29309cztM0_level2_quad_clean.evt |
| Size (bytes) | 832,970,880 | 101,718,720 |
| Size | 794.4 MB | 97.0 MB |
| Events in quadrant A | 4,047,403 | 672,927 |
| Events in quadrant B | 6,264,030 | 651,404 |
| Events in quadrant C | 7,397,869 | 662,328 |
| Events in quadrant D | 7,056,123 | 616,297 |
| Mode M9 | |||
|---|---|---|---|
| Quadrant | BADHDUFLAG | Total packets | Discarded packets |
| A | 0 | 13 | 0 |
| B | 0 | 14 | 0 |
| C | 0 | 14 | 0 |
| D | 0 | 14 | 0 |
| Mode M0 | |||
|---|---|---|---|
| Quadrant | BADHDUFLAG | Total packets | Discarded packets |
| A | 0 | 16396 | 2 |
| B | 0 | 23216 | 2 |
| C | 0 | 26934 | 2 |
| D | 0 | 25758 | 2 |
| Mode SS | |||
|---|---|---|---|
| Quadrant | BADHDUFLAG | Total packets | Discarded packets |
| A | 0 | 138 | 0 |
| B | 0 | 138 | 0 |
| C | 0 | 138 | 0 |
| D | 0 | 138 | 0 |
| Quadrant | Total seconds | Saturated seconds | Saturation percentage |
|---|---|---|---|
| A | 6849 | 140 | 2.044094% |
| B | 6849 | 894 | 13.053000% |
| C | 6849 | 940 | 13.724631% |
| D | 6849 | 1083 | 15.812527% |
Noise dominated data is calculated using 1-second bins in cleaned event files. If a bin has >2000 counts, and if more than 50% of those come from <1% of pixels, then it is considered to be noise-dominated and hence unusable.
| Quadrant | # 1 sec bins | Bins with >0 counts | Bins with >2000 counts | High rate bins dominated by noise | Noise dominated (total time) | Noise dominated (detector-on time) | Marked lightcurve |
|---|---|---|---|---|---|---|---|
| A | 7989 | 6850 | 98 | 98 | 1.23% | 1.43% | 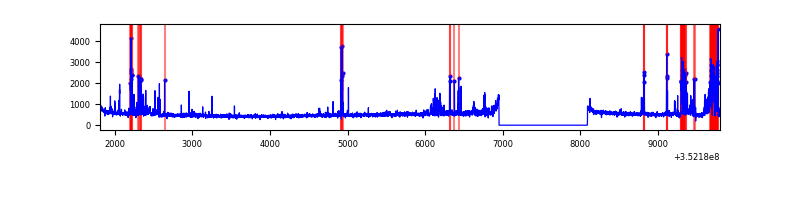 |
| B | 7989 | 6850 | 516 | 516 | 6.46% | 7.53% | 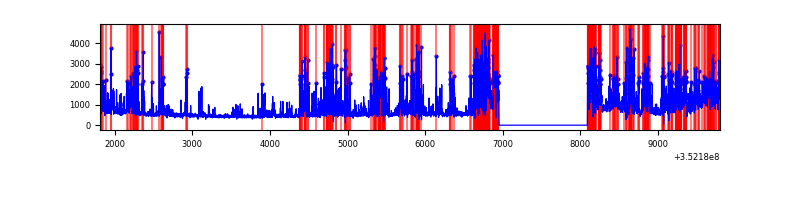 |
| C | 7989 | 6850 | 369 | 369 | 4.62% | 5.39% | 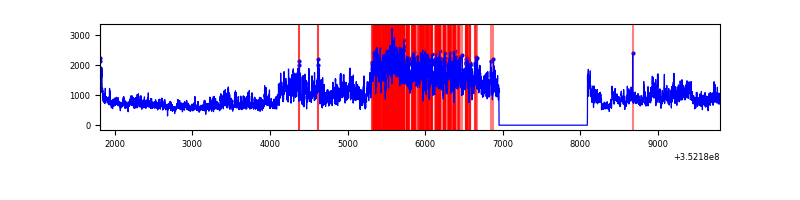 |
| D | 7989 | 6850 | 697 | 697 | 8.72% | 10.18% | 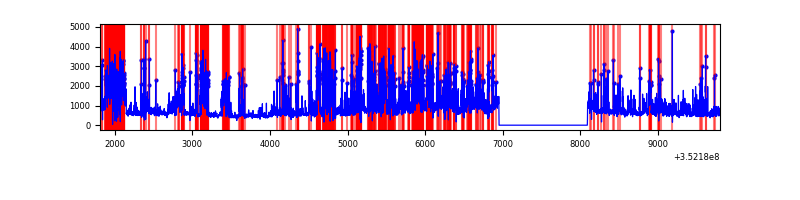 |
Top three noisy pixels from each quadrant. If the there are fewer than three noisy pixels in the level2.evt file, extra rows are filled as -1
| Pixel properties | Quadrant properties | ||||||
|---|---|---|---|---|---|---|---|
| Quadrant | DetID | PixID | Counts | Sigma | Mean | Median | Sigma |
| A | 0 | 13 | 518024 | 2966.75 | 873 | 859 | 174.3 |
| A | 15 | 174 | 135773 | 773.94 | 873 | 859 | 174.3 |
| A | 1 | 113 | 15564 | 84.36 | 873 | 859 | 174.3 |
| B | 5 | 255 | 2910624 | 18790.48 | 823 | 803 | 154.9 |
| B | 10 | 245 | 74126 | 473.49 | 823 | 803 | 154.9 |
| B | 5 | 172 | 35934 | 226.86 | 823 | 803 | 154.9 |
| C | 3 | 233 | 3990381 | 20458.38 | 835 | 843 | 195.0 |
| C | 14 | 238 | 132066 | 672.91 | 835 | 843 | 195.0 |
| C | 2 | 114 | 15941 | 77.42 | 835 | 843 | 195.0 |
| D | 1 | 52 | 2834664 | 14801.93 | 798 | 777 | 191.5 |
| D | 12 | 233 | 350504 | 1826.69 | 798 | 777 | 191.5 |
| D | 7 | 80 | 308711 | 1608.4 | 798 | 777 | 191.5 |
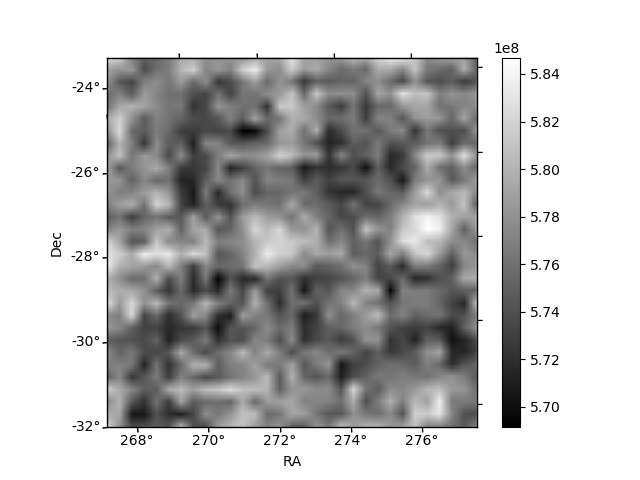
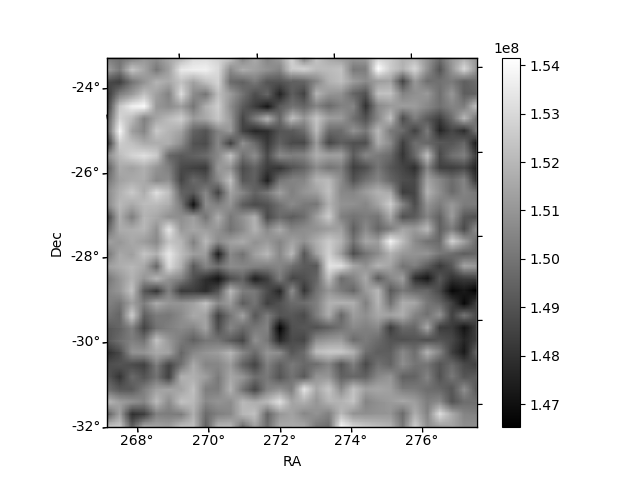
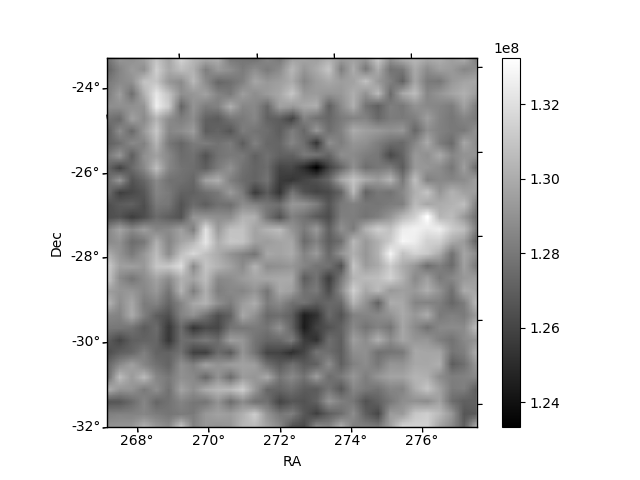
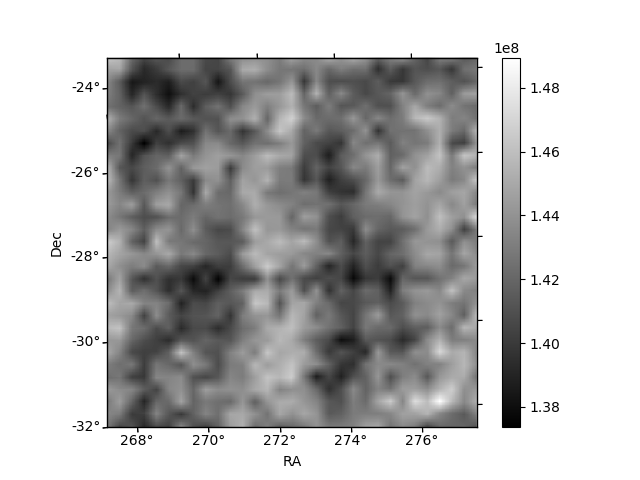
Histogram calculated using DETX and DETY for each event in the final _common_clean file
| Quadrant A | 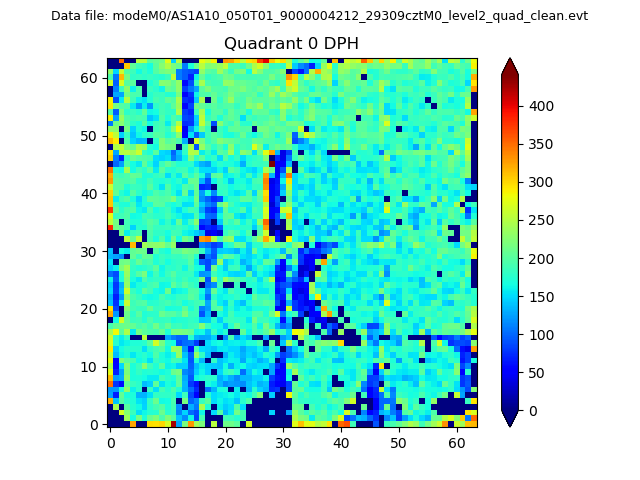 |
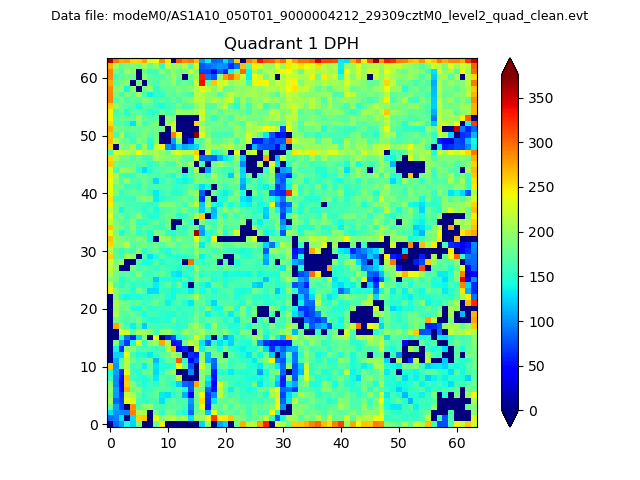 |
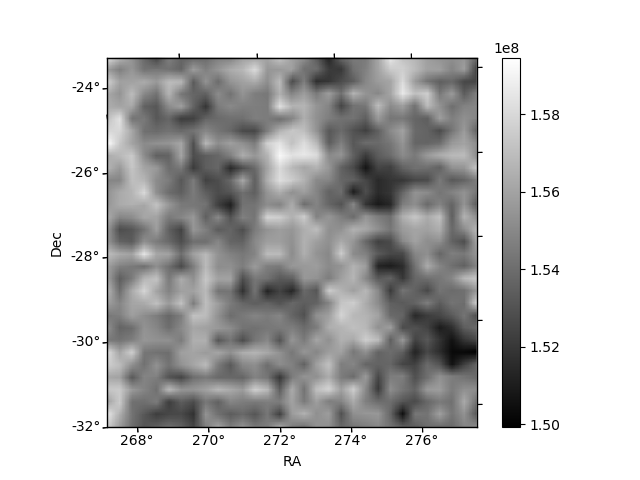
Quadrant B |
|---|---|---|---|
| Quadrant D | 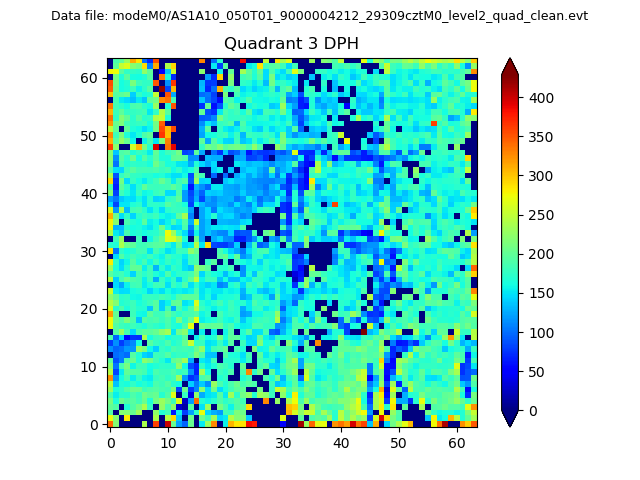 |
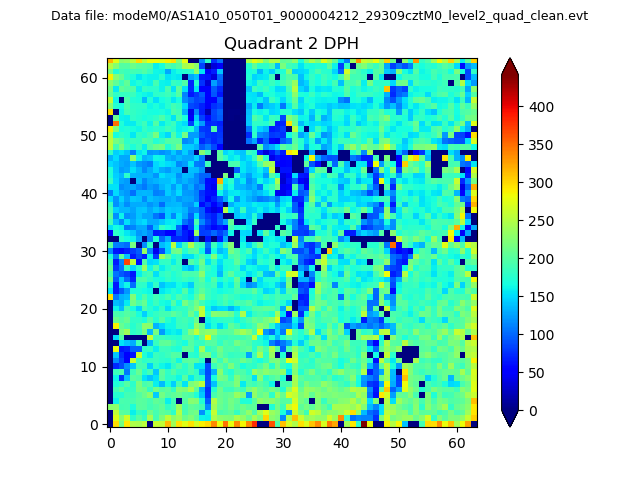 |
Quadrant C |
| Plot type | Count rate plots | Images |
|---|---|---|
| Comparison with Poisson distribution Blue bars denote a histogram of data divided into 1 sec bins. Red curve is a Poisson curve with rate = median count rate of data. |
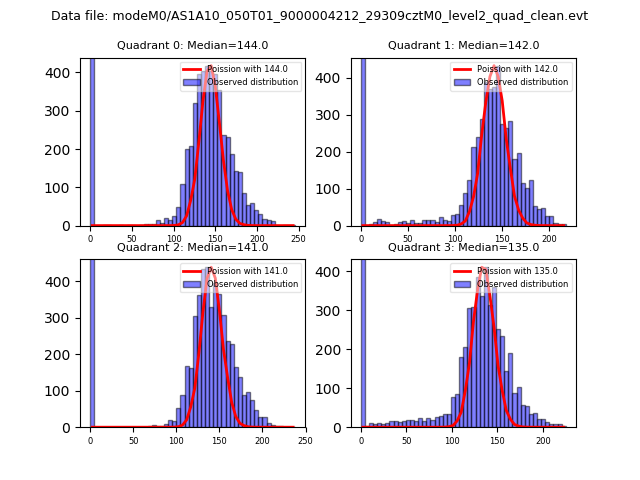 |
 |
| Quadrant-wise count rates Data is divided into 100 sec bins |
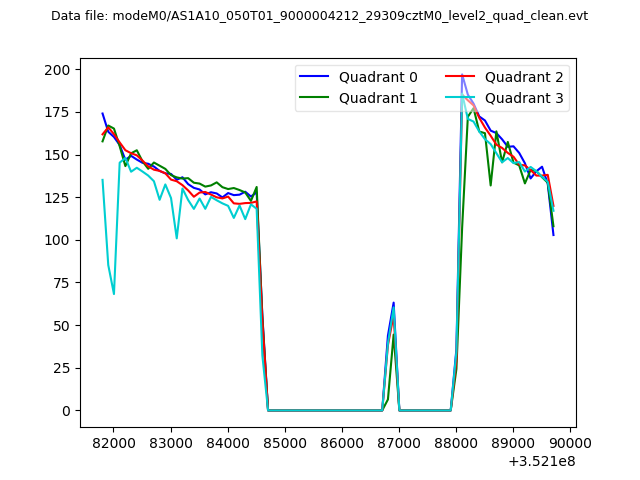 |
|
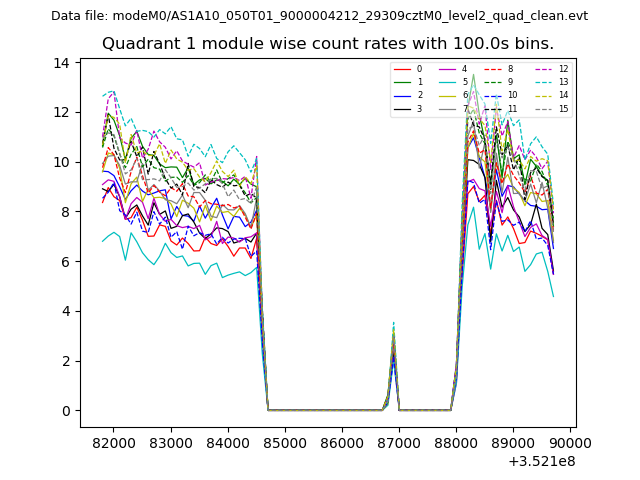
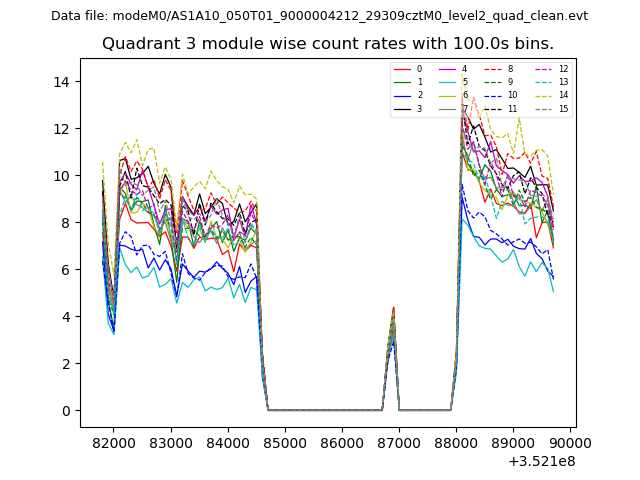
| Module-wise count rates for Quadrant A Data is divided into 100 sec bins |
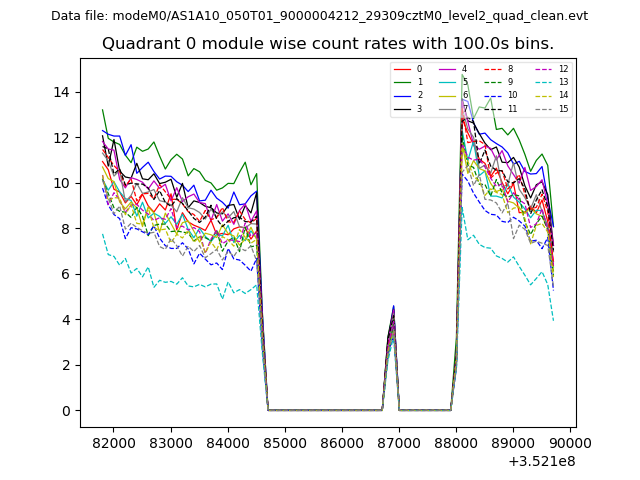 |
 |
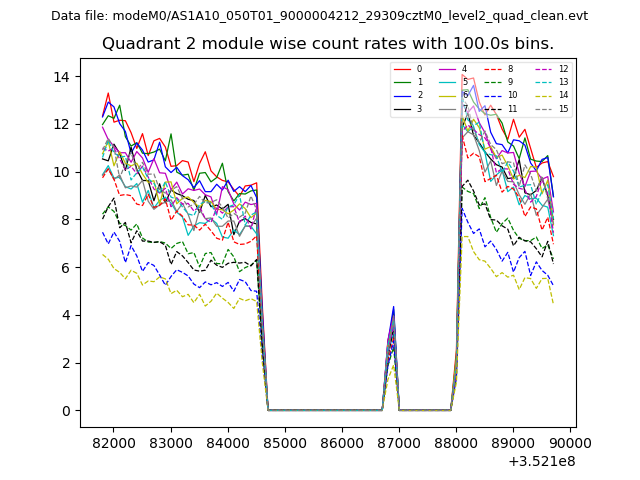
| Module-wise count rates for Quadrant B Data is divided into 100 sec bins |
 |
 |
| Module-wise count rates for Quadrant C Data is divided into 100 sec bins |
 |
 |
| Module-wise count rates for Quadrant D Data is divided into 100 sec bins |
 |
 |
| Parameter | Plot |
|---|---|
| CZT HV Monitor | 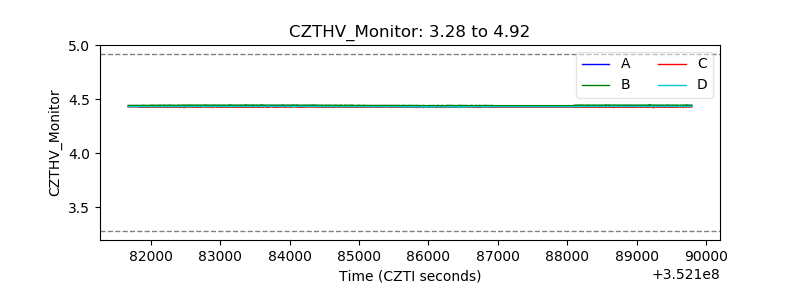 |
| D_VDD | 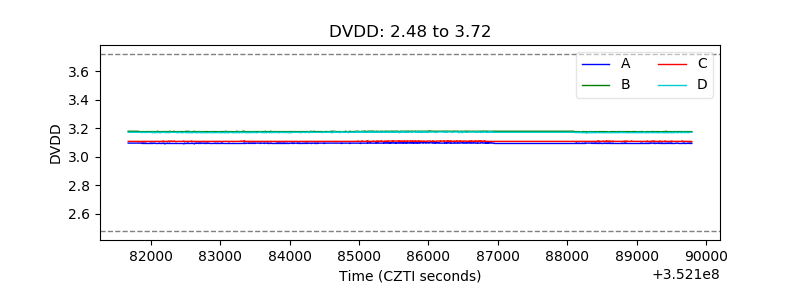 |
| Temperature 1 | 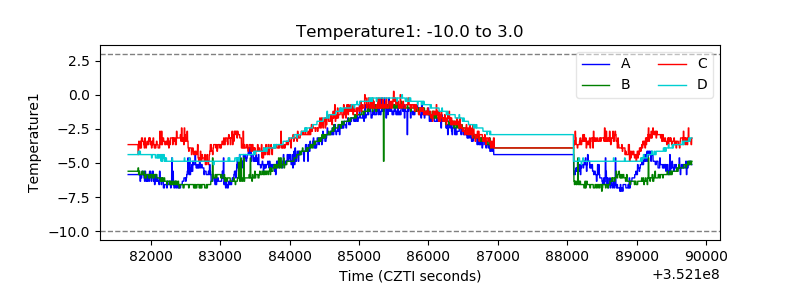 |
| Veto HV Monitor | 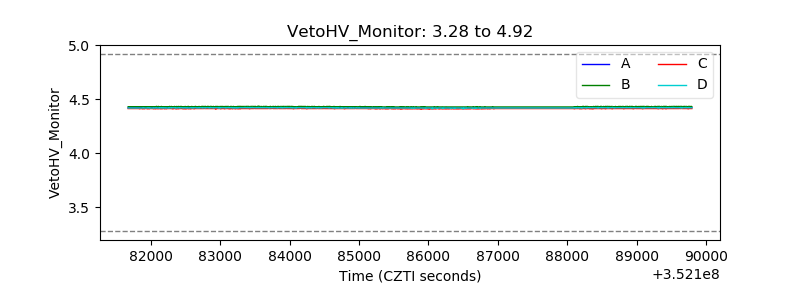 |
| Veto LLD | 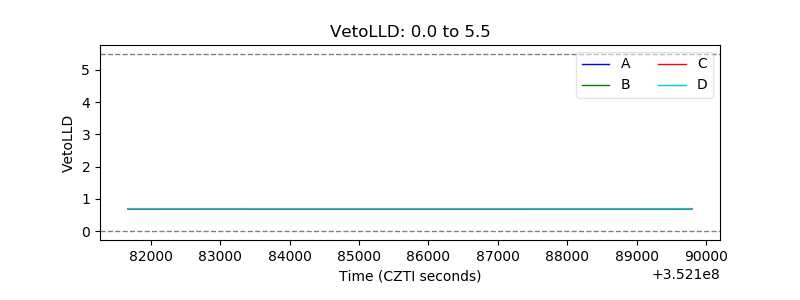 |
| Alpha Counter | 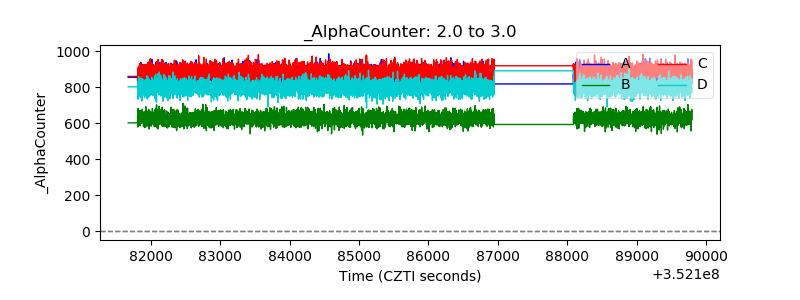 |
| _CPM_Rate | 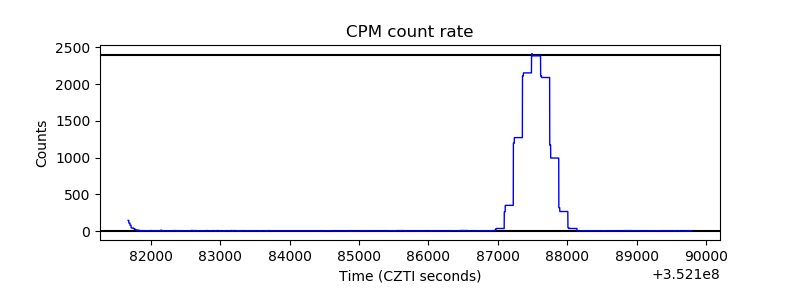 |
| CZT Counter | 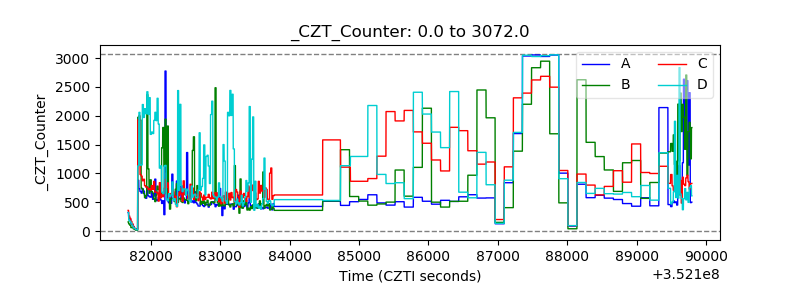 |
| +2.5 Volts monitor |  |
| +5 Volts monitor |  |
| _ROLL_ROT | 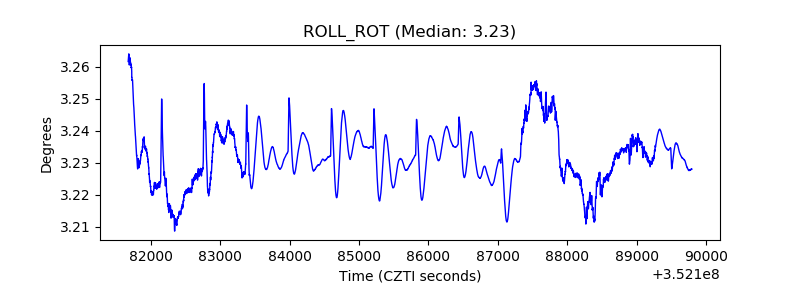 |
| _Roll_DEC | 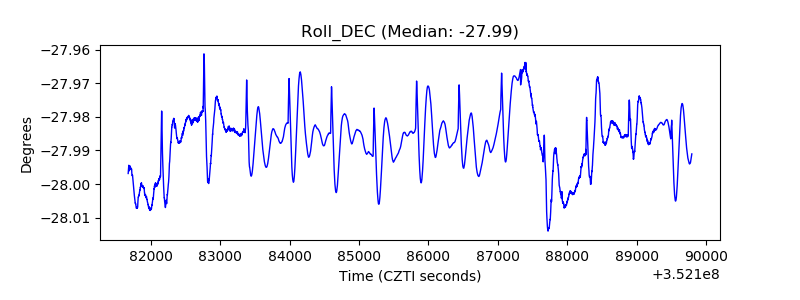 |
| _Roll_RA | 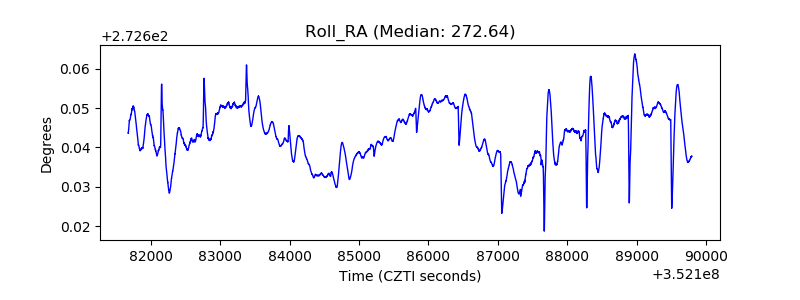 |
| Veto Counter | 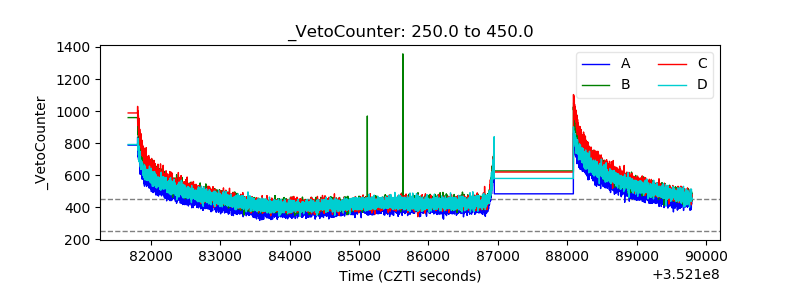 |