| Param | Original file | Final file |
|---|---|---|
| Filename | modeM0/AS1A10_050T01_9000004212_29310cztM0_level2.evt | modeM0/AS1A10_050T01_9000004212_29310cztM0_level2_quad_clean.evt |
| Size (bytes) | 754,611,840 | 83,802,240 |
| Size | 719.7 MB | 79.9 MB |
| Events in quadrant A | 3,355,573 | 552,003 |
| Events in quadrant B | 5,411,621 | 546,471 |
| Events in quadrant C | 6,957,548 | 527,021 |
| Events in quadrant D | 6,740,770 | 508,816 |
| Mode M9 | |||
|---|---|---|---|
| Quadrant | BADHDUFLAG | Total packets | Discarded packets |
| A | 0 | 12 | 0 |
| B | 0 | 12 | 0 |
| C | 0 | 12 | 0 |
| D | 0 | 12 | 0 |
| Mode M0 | |||
|---|---|---|---|
| Quadrant | BADHDUFLAG | Total packets | Discarded packets |
| A | 0 | 13375 | 1 |
| B | 0 | 19928 | 1 |
| C | 0 | 24769 | 1 |
| D | 0 | 24052 | 1 |
| Mode SS | |||
|---|---|---|---|
| Quadrant | BADHDUFLAG | Total packets | Discarded packets |
| A | 0 | 118 | 0 |
| B | 0 | 118 | 0 |
| C | 0 | 118 | 0 |
| D | 0 | 118 | 0 |
| Quadrant | Total seconds | Saturated seconds | Saturation percentage |
|---|---|---|---|
| A | 5762 | 109 | 1.891704% |
| B | 5763 | 576 | 9.994794% |
| C | 5763 | 821 | 14.246052% |
| D | 5763 | 1132 | 19.642547% |
Noise dominated data is calculated using 1-second bins in cleaned event files. If a bin has >2000 counts, and if more than 50% of those come from <1% of pixels, then it is considered to be noise-dominated and hence unusable.
| Quadrant | # 1 sec bins | Bins with >0 counts | Bins with >2000 counts | High rate bins dominated by noise | Noise dominated (total time) | Noise dominated (detector-on time) | Marked lightcurve |
|---|---|---|---|---|---|---|---|
| A | 6987 | 5763 | 77 | 77 | 1.10% | 1.34% | 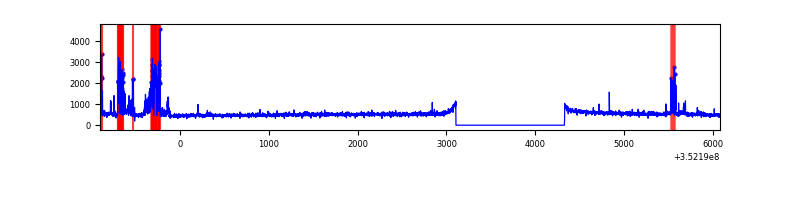 |
| B | 6988 | 5764 | 378 | 378 | 5.41% | 6.56% | 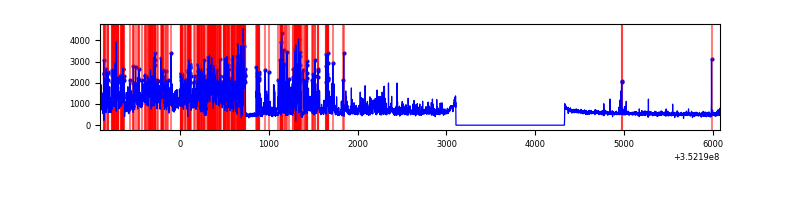 |
| C | 6988 | 5764 | 359 | 359 | 5.14% | 6.23% | 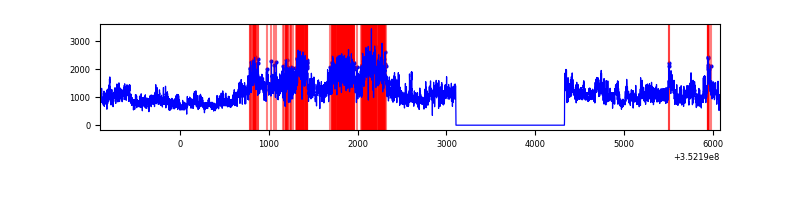 |
| D | 6988 | 5764 | 848 | 848 | 12.14% | 14.71% | 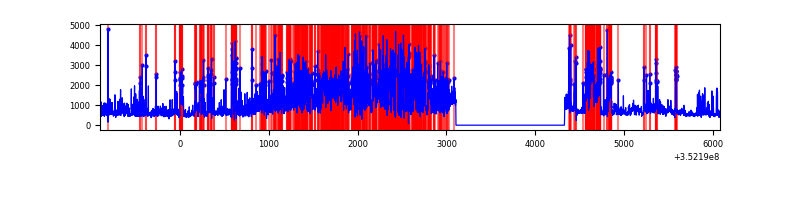 |
Top three noisy pixels from each quadrant. If the there are fewer than three noisy pixels in the level2.evt file, extra rows are filled as -1
| Pixel properties | Quadrant properties | ||||||
|---|---|---|---|---|---|---|---|
| Quadrant | DetID | PixID | Counts | Sigma | Mean | Median | Sigma |
| A | 0 | 13 | 406039 | 2679.38 | 762 | 747 | 151.3 |
| A | 13 | 254 | 10977 | 67.63 | 762 | 747 | 151.3 |
| A | 3 | 137 | 6588 | 38.61 | 762 | 747 | 151.3 |
| B | 5 | 255 | 2168439 | 15934.49 | 731 | 716 | 136.0 |
| B | 10 | 245 | 240488 | 1762.52 | 731 | 716 | 136.0 |
| B | 0 | 190 | 87957 | 641.29 | 731 | 716 | 136.0 |
| C | 3 | 233 | 4040742 | 24475.77 | 713 | 721 | 165.1 |
| C | 14 | 238 | 113282 | 681.93 | 713 | 721 | 165.1 |
| C | 2 | 114 | 13520 | 77.54 | 713 | 721 | 165.1 |
| D | 1 | 52 | 3342257 | 20369.51 | 693 | 677 | 164.0 |
| D | 8 | 195 | 296566 | 1803.67 | 693 | 677 | 164.0 |
| D | 13 | 153 | 144276 | 875.35 | 693 | 677 | 164.0 |
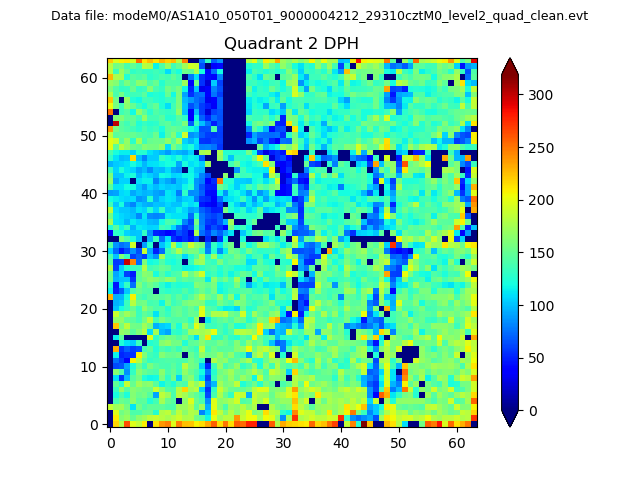
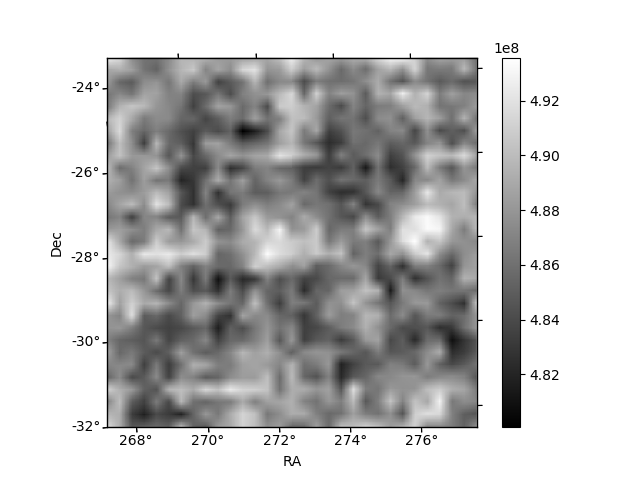
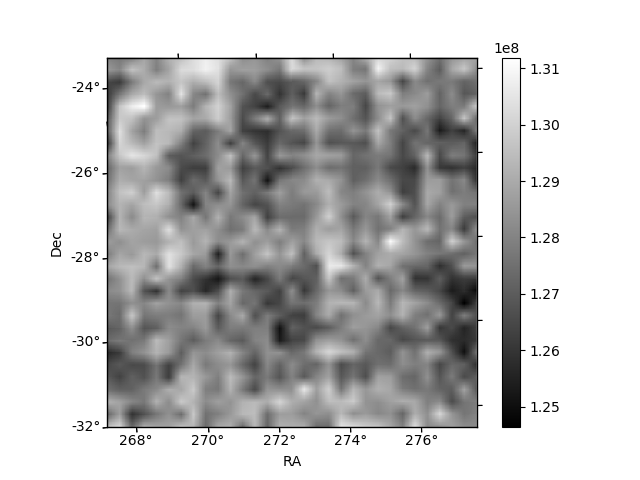
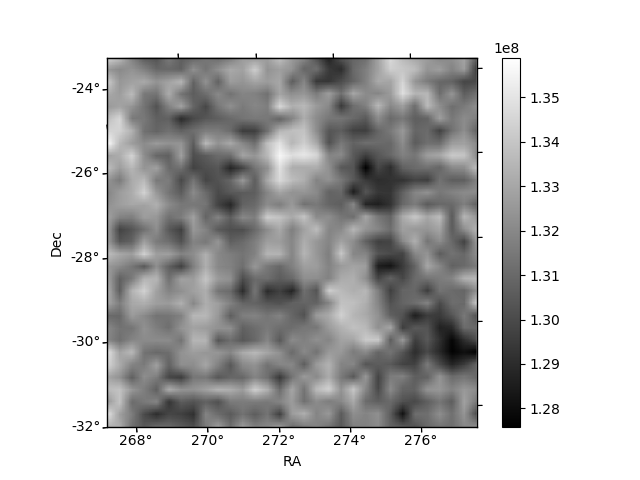
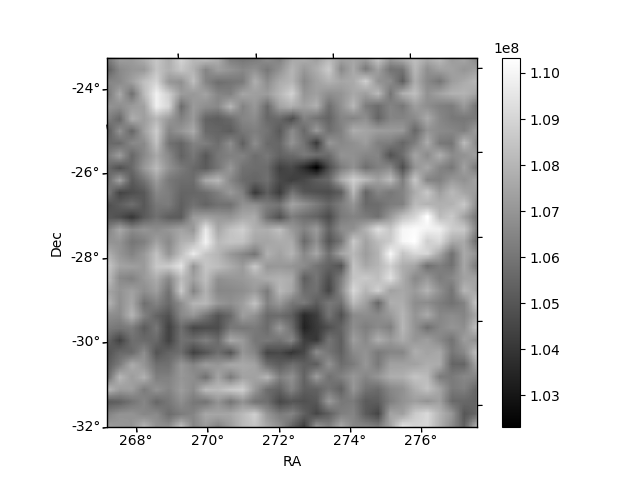
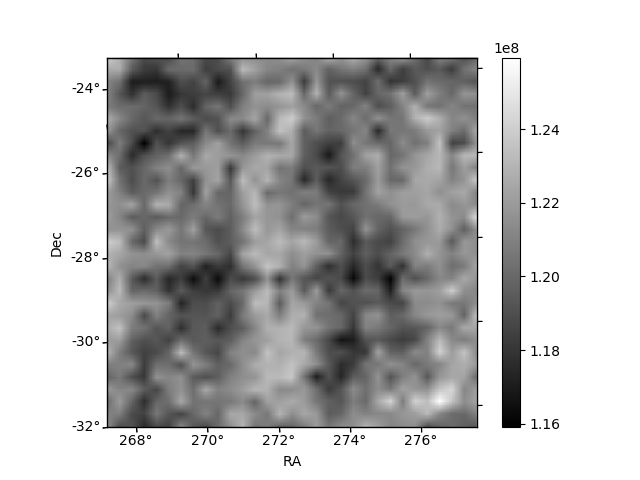
Histogram calculated using DETX and DETY for each event in the final _common_clean file
| Quadrant A | 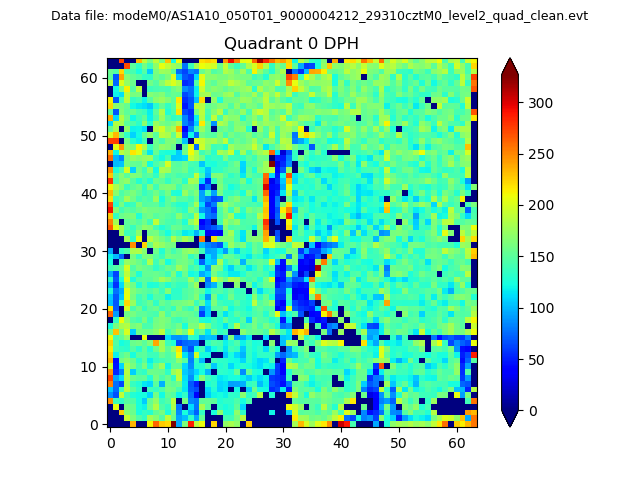 |
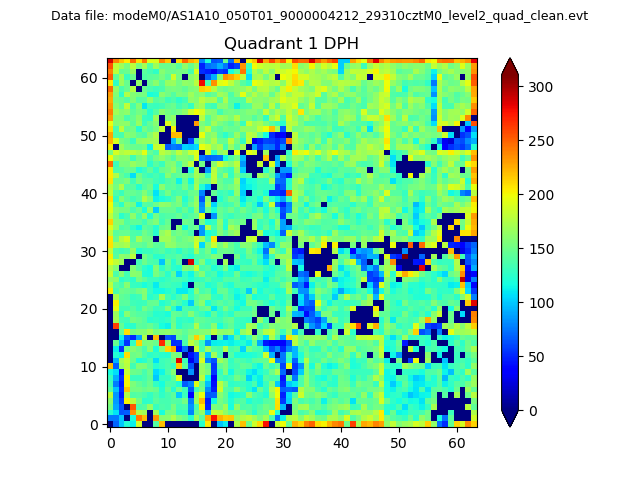 |
Quadrant B |
|---|---|---|---|
| Quadrant D | 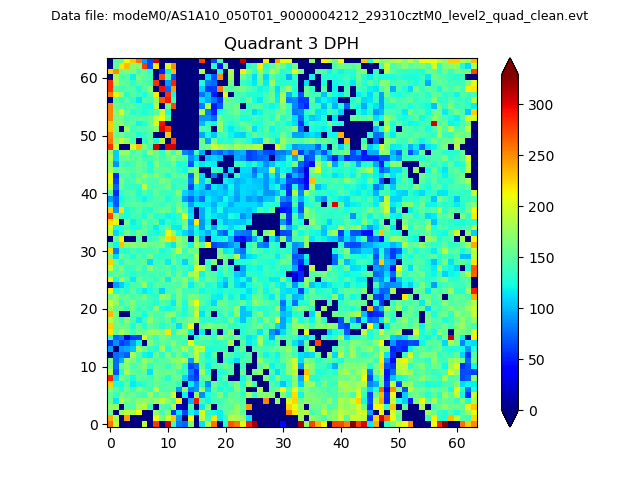 |
 |
Quadrant C |
| Plot type | Count rate plots | Images |
|---|---|---|
| Comparison with Poisson distribution Blue bars denote a histogram of data divided into 1 sec bins. Red curve is a Poisson curve with rate = median count rate of data. |
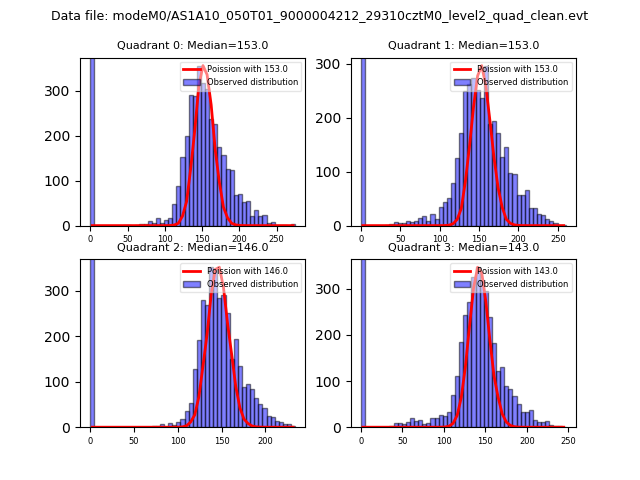 |
 |
| Quadrant-wise count rates Data is divided into 100 sec bins |
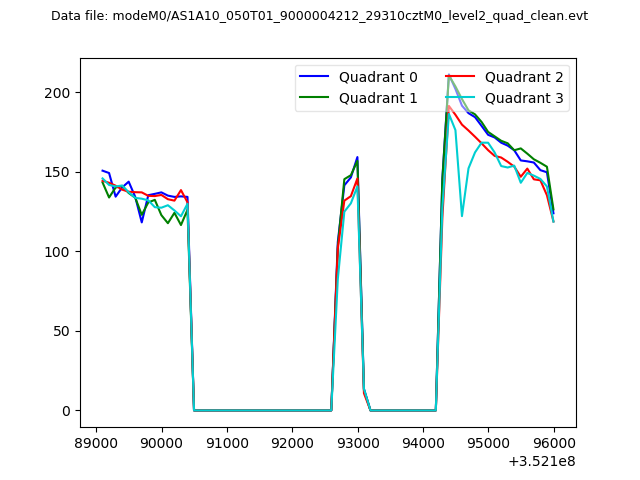 |
|
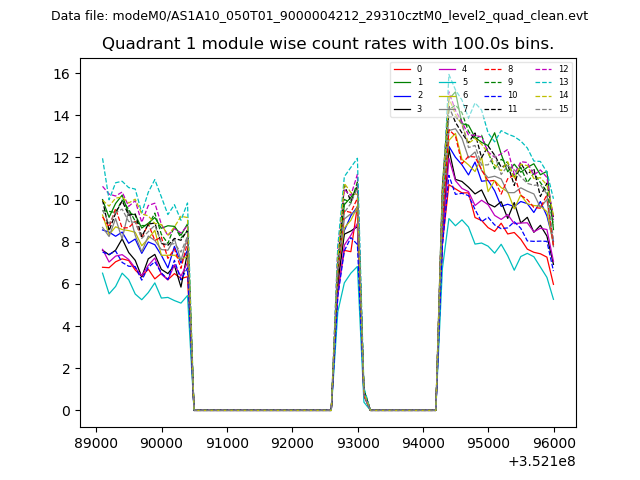
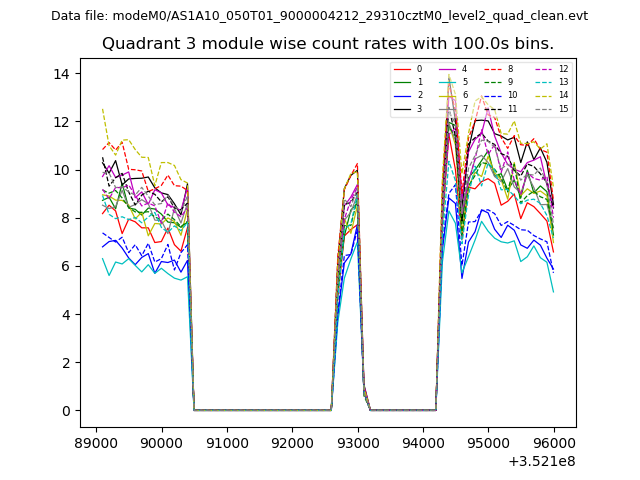
| Module-wise count rates for Quadrant A Data is divided into 100 sec bins |
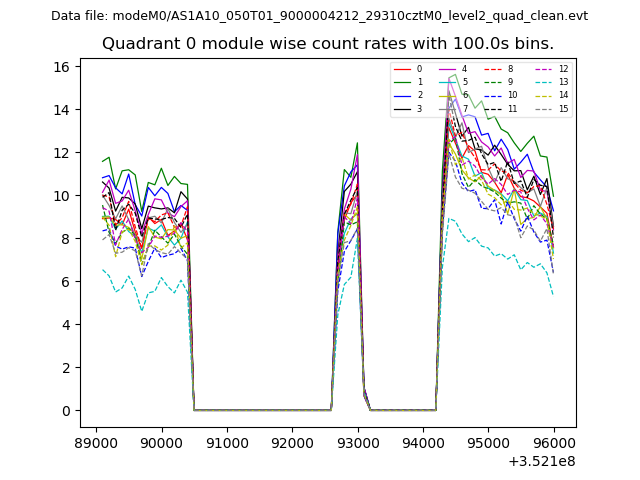 |
 |
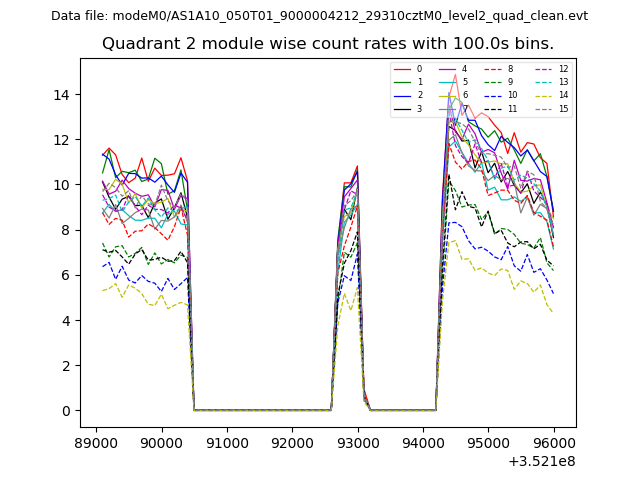
| Module-wise count rates for Quadrant B Data is divided into 100 sec bins |
 |
 |
| Module-wise count rates for Quadrant C Data is divided into 100 sec bins |
 |
 |
| Module-wise count rates for Quadrant D Data is divided into 100 sec bins |
 |
 |
| Parameter | Plot |
|---|---|
| CZT HV Monitor | 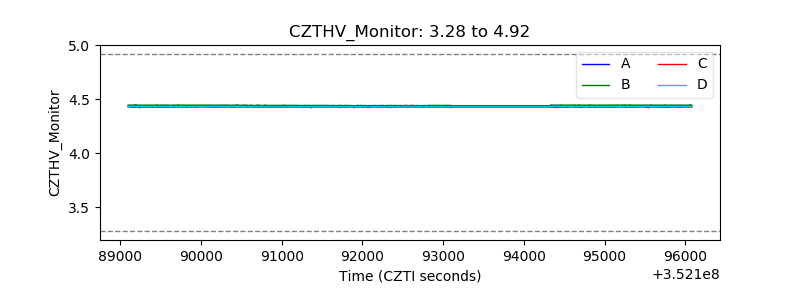 |
| D_VDD | 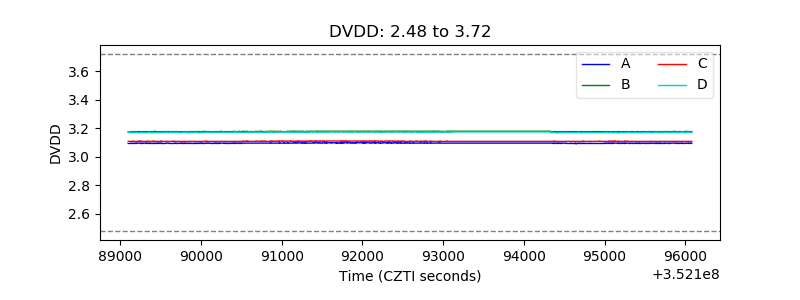 |
| Temperature 1 | 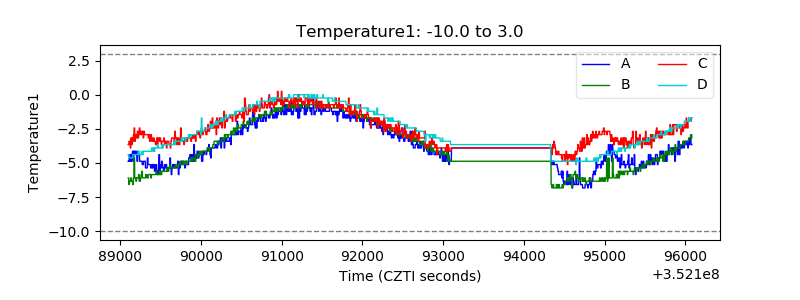 |
| Veto HV Monitor |  |
| Veto LLD | 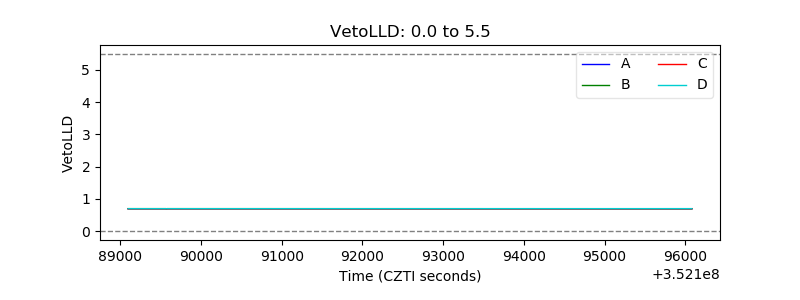 |
| Alpha Counter | 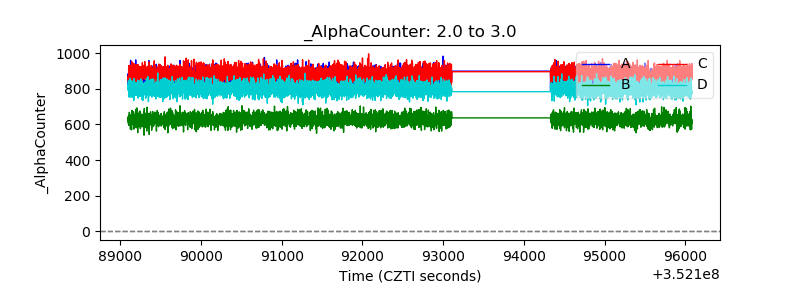 |
| _CPM_Rate |  |
| CZT Counter | 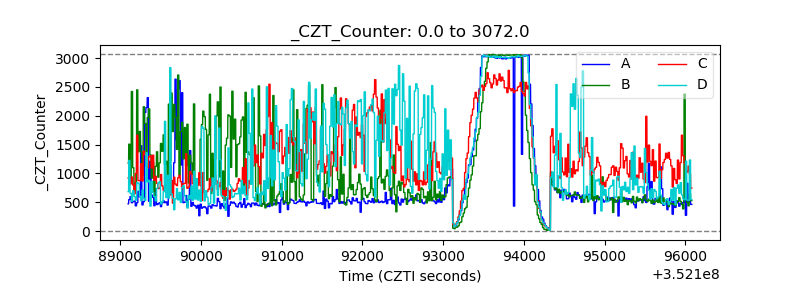 |
| +2.5 Volts monitor | 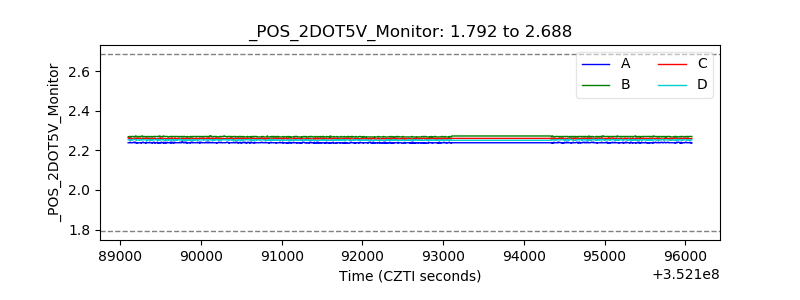 |
| +5 Volts monitor |  |
| _ROLL_ROT | 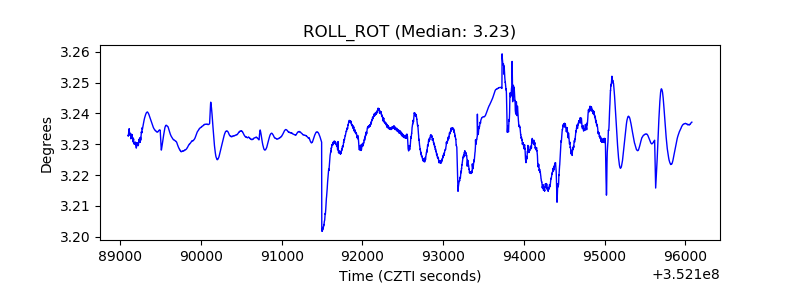 |
| _Roll_DEC |  |
| _Roll_RA | 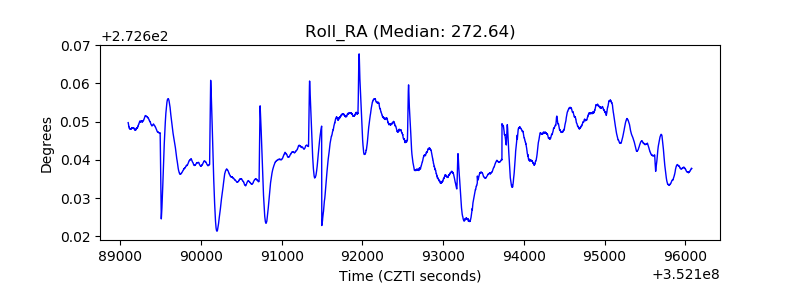 |
| Veto Counter | 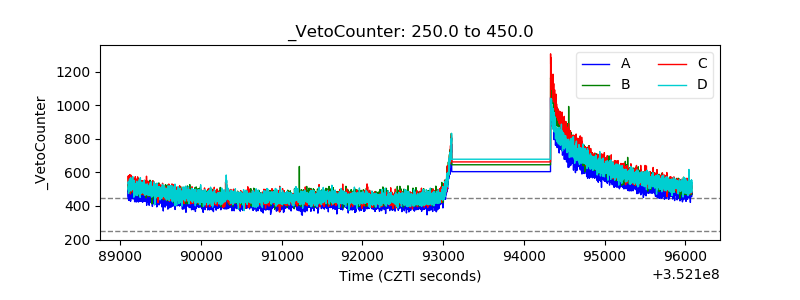 |