| Param | Original file | Final file |
|---|---|---|
| Filename | modeM0/AS1A10_050T01_9000004212_29311cztM0_level2.evt | modeM0/AS1A10_050T01_9000004212_29311cztM0_level2_quad_clean.evt |
| Size (bytes) | 1,207,811,520 | 147,093,120 |
| Size | 1.1 GB | 140.3 MB |
| Events in quadrant A | 5,634,893 | 954,360 |
| Events in quadrant B | 6,899,044 | 951,194 |
| Events in quadrant C | 12,617,760 | 903,928 |
| Events in quadrant D | 10,690,024 | 886,303 |
| Mode M9 | |||
|---|---|---|---|
| Quadrant | BADHDUFLAG | Total packets | Discarded packets |
| A | 0 | 9 | 0 |
| B | 0 | 9 | 0 |
| C | 0 | 9 | 0 |
| D | 0 | 9 | 0 |
| Mode M0 | |||
|---|---|---|---|
| Quadrant | BADHDUFLAG | Total packets | Discarded packets |
| A | 0 | 23605 | 1 |
| B | 0 | 27682 | 1 |
| C | 0 | 45195 | 8 |
| D | 0 | 39353 | 1 |
| Mode SS | |||
|---|---|---|---|
| Quadrant | BADHDUFLAG | Total packets | Discarded packets |
| A | 0 | 222 | 0 |
| B | 0 | 222 | 0 |
| C | 0 | 222 | 0 |
| D | 0 | 222 | 0 |
| Quadrant | Total seconds | Saturated seconds | Saturation percentage |
|---|---|---|---|
| A | 10956 | 61 | 0.556773% |
| B | 10956 | 393 | 3.587076% |
| C | 10955 | 1947 | 17.772707% |
| D | 10958 | 1202 | 10.969155% |
Noise dominated data is calculated using 1-second bins in cleaned event files. If a bin has >2000 counts, and if more than 50% of those come from <1% of pixels, then it is considered to be noise-dominated and hence unusable.
| Quadrant | # 1 sec bins | Bins with >0 counts | Bins with >2000 counts | High rate bins dominated by noise | Noise dominated (total time) | Noise dominated (detector-on time) | Marked lightcurve |
|---|---|---|---|---|---|---|---|
| A | 28776 | 10958 | 41 | 41 | 0.14% | 0.37% | 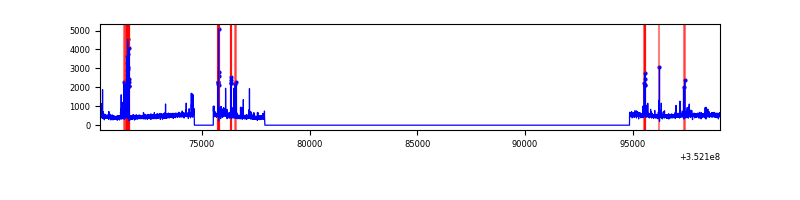 |
| B | 28776 | 10958 | 230 | 230 | 0.80% | 2.10% | 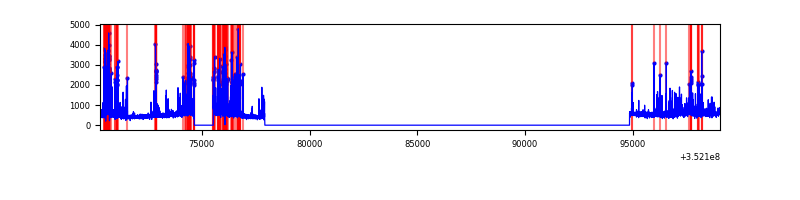 |
| C | 28776 | 10957 | 1312 | 1312 | 4.56% | 11.97% | 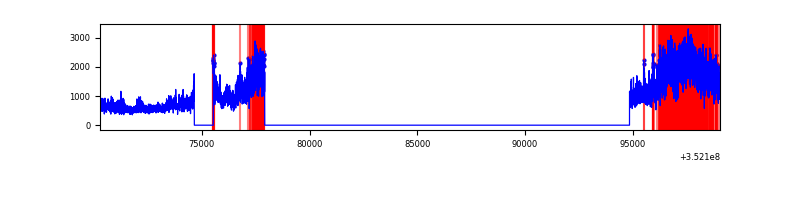 |
| D | 28777 | 10960 | 888 | 888 | 3.09% | 8.10% | 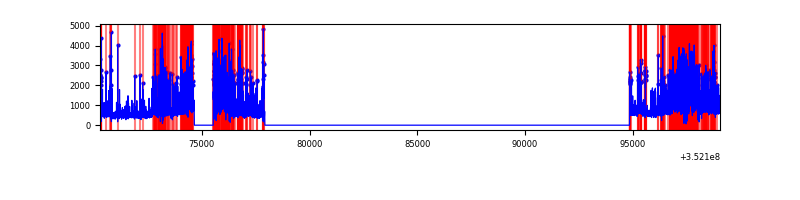 |
Top three noisy pixels from each quadrant. If the there are fewer than three noisy pixels in the level2.evt file, extra rows are filled as -1
| Pixel properties | Quadrant properties | ||||||
|---|---|---|---|---|---|---|---|
| Quadrant | DetID | PixID | Counts | Sigma | Mean | Median | Sigma |
| A | 0 | 13 | 328016 | 1210.19 | 1352 | 1327 | 269.9 |
| A | 15 | 174 | 52919 | 191.12 | 1352 | 1327 | 269.9 |
| A | 1 | 113 | 31081 | 110.22 | 1352 | 1327 | 269.9 |
| B | 5 | 255 | 1348286 | 5516.47 | 1323 | 1293 | 244.2 |
| B | 10 | 245 | 176484 | 717.48 | 1323 | 1293 | 244.2 |
| B | 0 | 190 | 126168 | 511.41 | 1323 | 1293 | 244.2 |
| C | 3 | 233 | 7487771 | 25476.56 | 1257 | 1266 | 293.9 |
| C | 14 | 238 | 197960 | 669.35 | 1257 | 1266 | 293.9 |
| C | 2 | 114 | 25020 | 80.83 | 1257 | 1266 | 293.9 |
| D | 1 | 52 | 3258107 | 10779.22 | 1268 | 1238 | 302.1 |
| D | 12 | 233 | 920366 | 3042.03 | 1268 | 1238 | 302.1 |
| D | 8 | 195 | 711045 | 2349.24 | 1268 | 1238 | 302.1 |
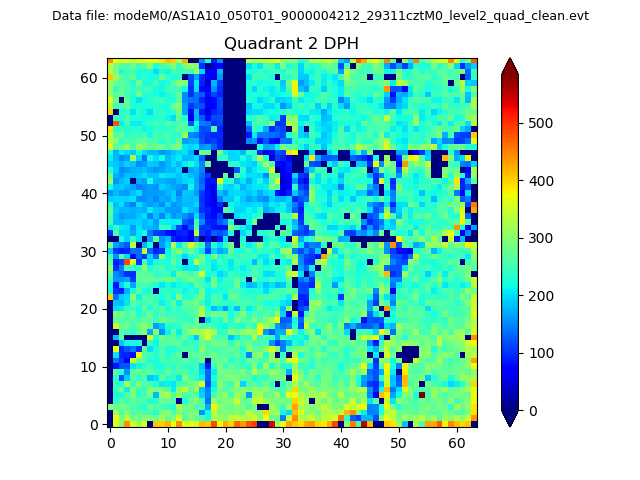
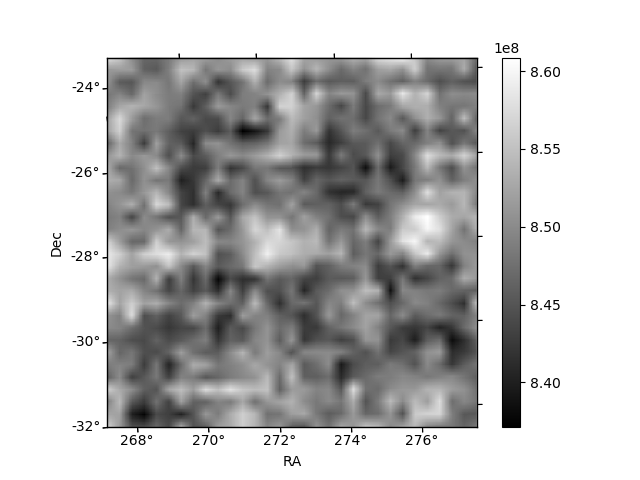
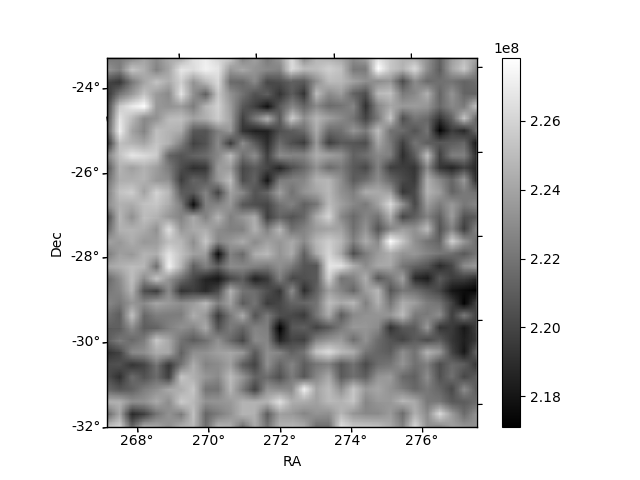
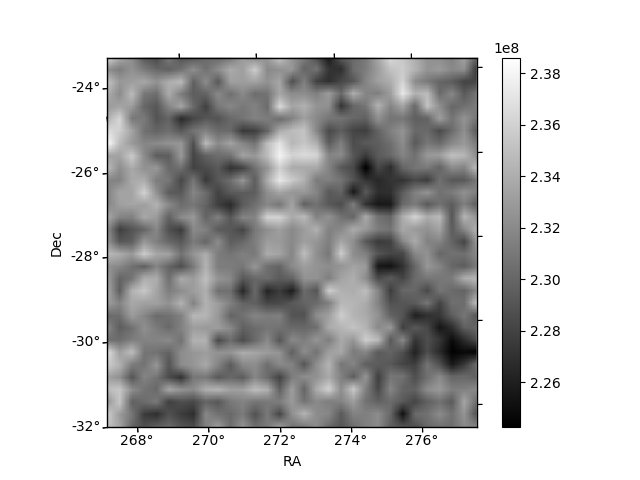
Histogram calculated using DETX and DETY for each event in the final _common_clean file
| Quadrant A | 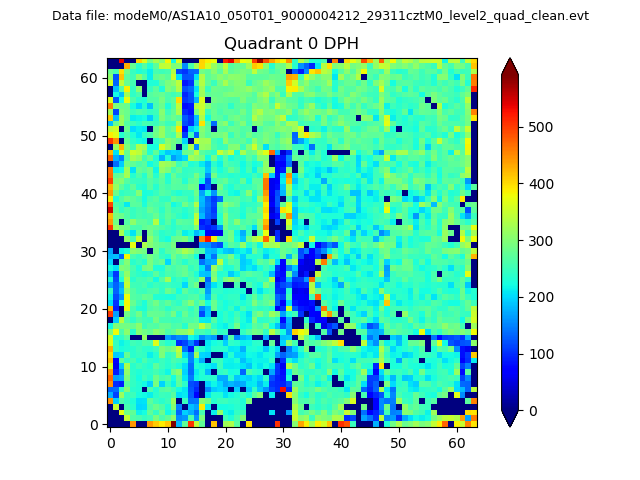 |
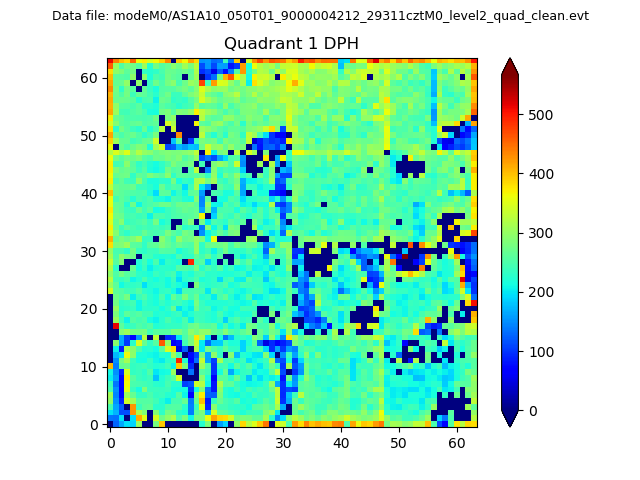 |
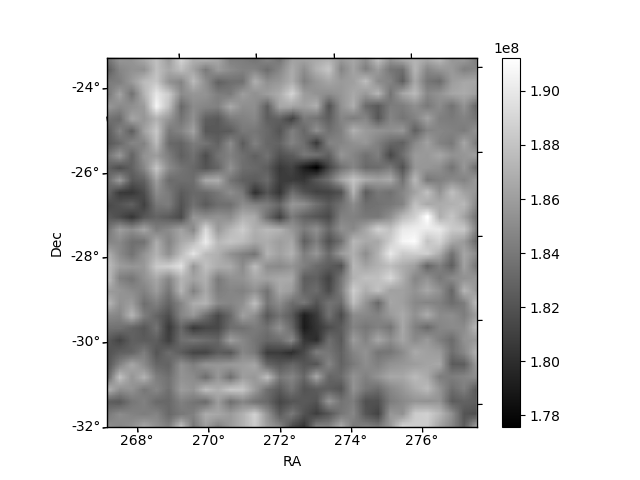
Quadrant B |
|---|---|---|---|
| Quadrant D | 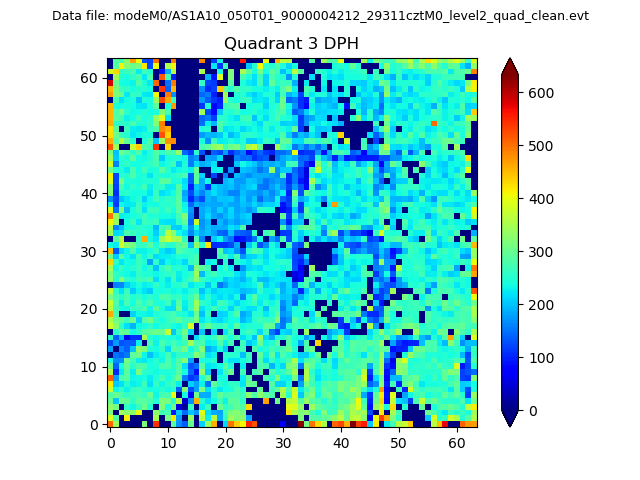 |
 |
Quadrant C |
| Plot type | Count rate plots | Images |
|---|---|---|
| Comparison with Poisson distribution Blue bars denote a histogram of data divided into 1 sec bins. Red curve is a Poisson curve with rate = median count rate of data. |
 |
 |
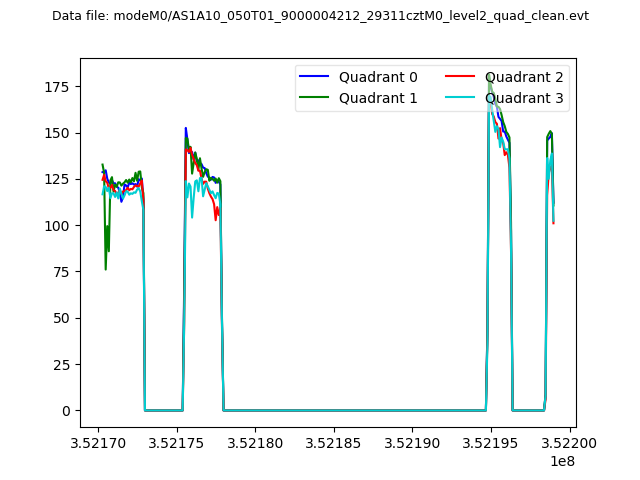
| Quadrant-wise count rates Data is divided into 100 sec bins |
 |
|
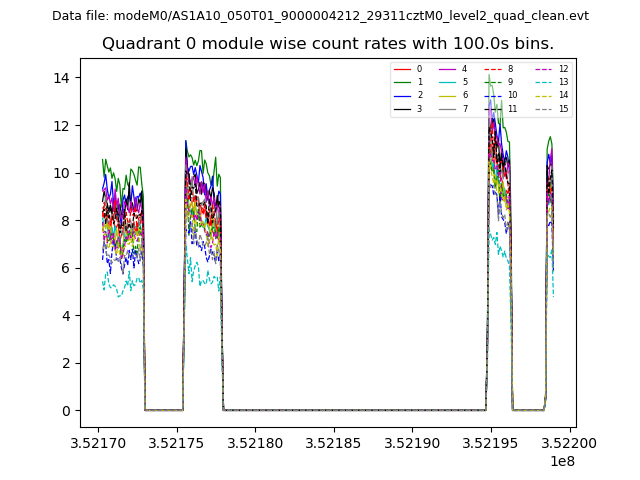
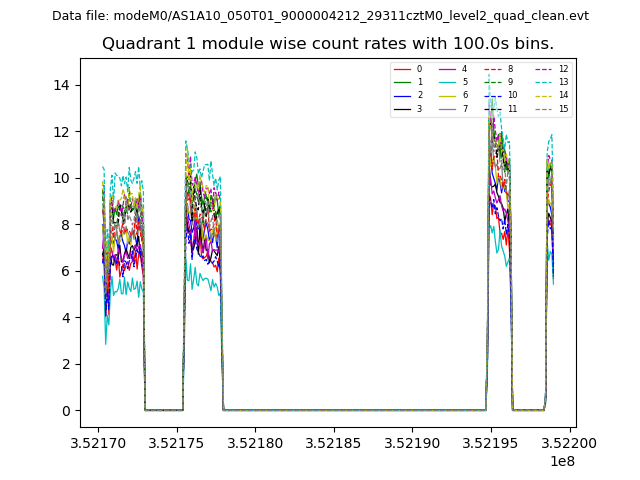
| Module-wise count rates for Quadrant A Data is divided into 100 sec bins |
 |
 |
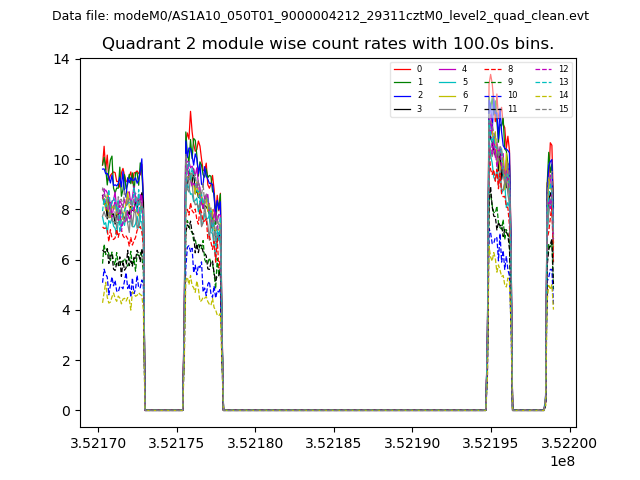
| Module-wise count rates for Quadrant B Data is divided into 100 sec bins |
 |
 |
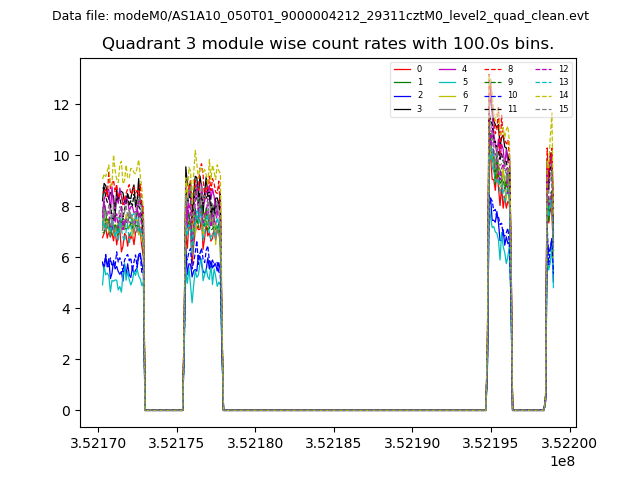
| Module-wise count rates for Quadrant C Data is divided into 100 sec bins |
 |
 |
| Module-wise count rates for Quadrant D Data is divided into 100 sec bins |
 |
 |
| Parameter | Plot |
|---|---|
| CZT HV Monitor | 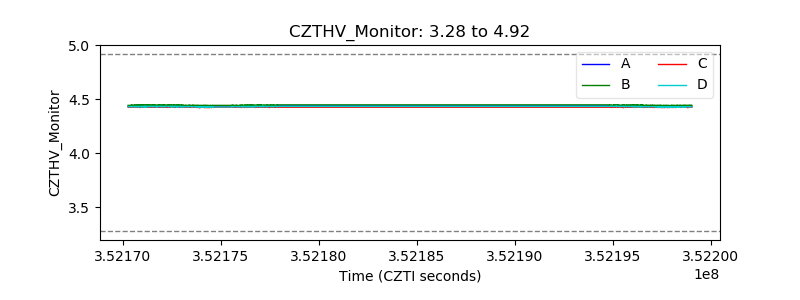 |
| D_VDD | 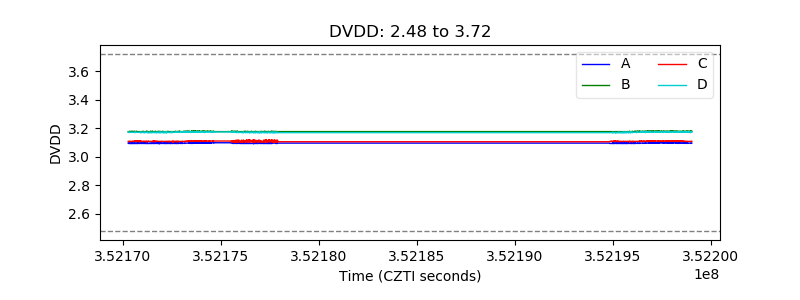 |
| Temperature 1 | 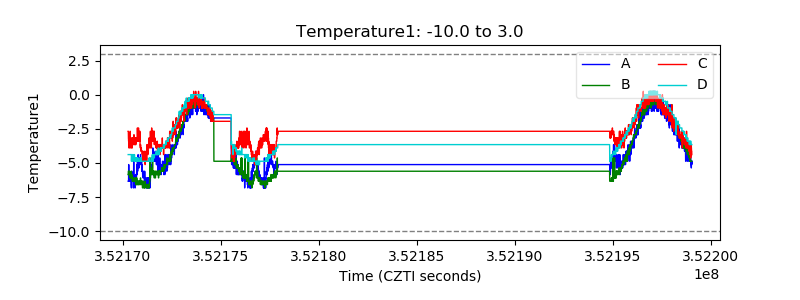 |
| Veto HV Monitor | 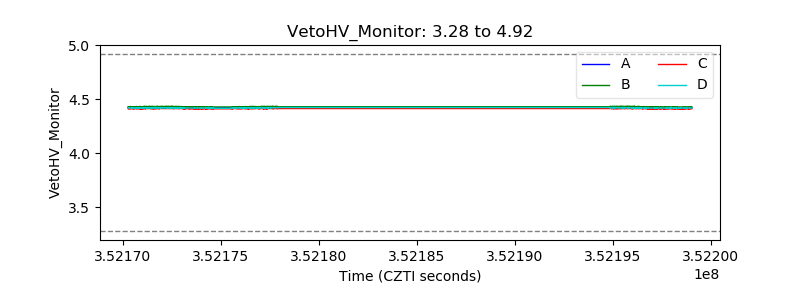 |
| Veto LLD | 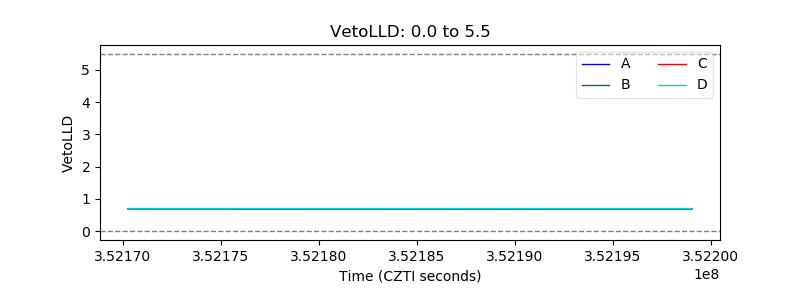 |
| Alpha Counter | 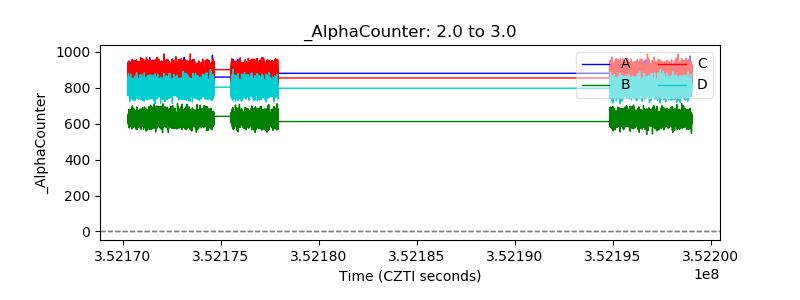 |
| _CPM_Rate |  |
| CZT Counter | 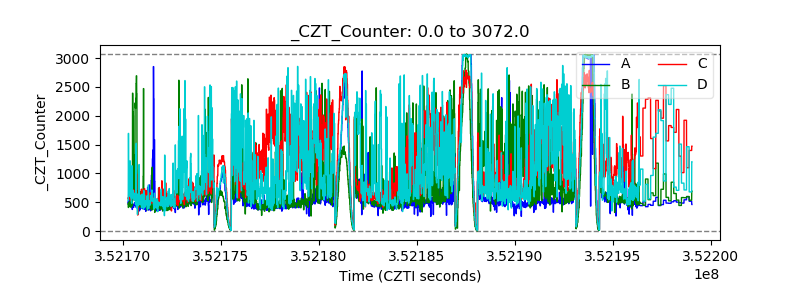 |
| +2.5 Volts monitor |  |
| +5 Volts monitor |  |
| _ROLL_ROT | 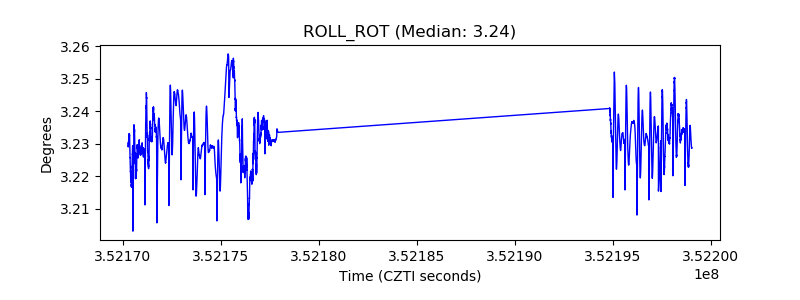 |
| _Roll_DEC | 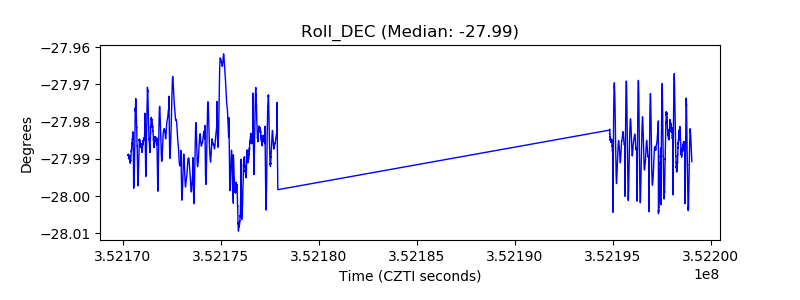 |
| _Roll_RA | 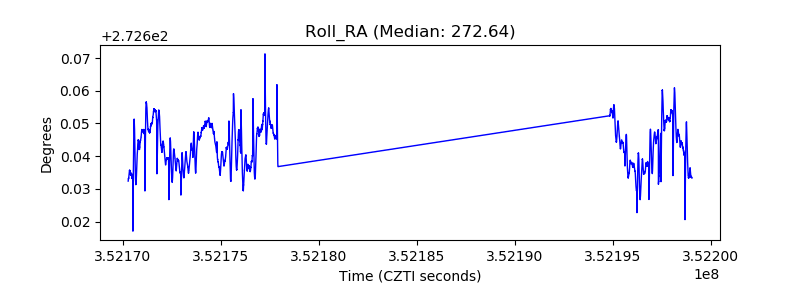 |
| Veto Counter | 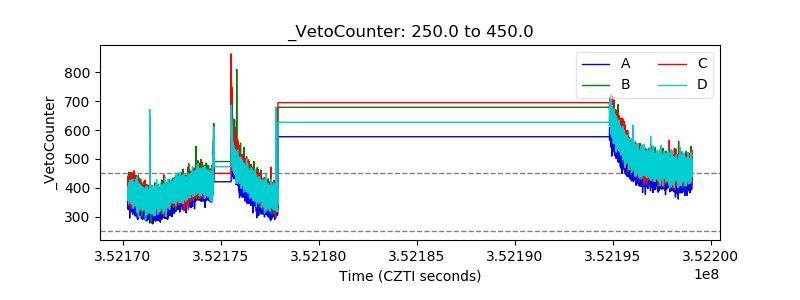 |