| Param | Original file | Final file |
|---|---|---|
| Filename | modeM0/AS1A10_050T03_9000004216cztM0_level2.fits | modeM0/AS1A10_050T03_9000004216cztM0_level2_quad_clean.evt |
| Size (bytes) | 927,538,560 | 797,558,400 |
| Size | 884.6 MB | 760.6 MB |
| Events in quadrant A | 6,099,962 | 5,033,088 |
| Events in quadrant B | 5,684,818 | 4,976,983 |
| Events in quadrant C | 5,849,392 | 4,789,705 |
| Events in quadrant D | 3,613,838 | 2,537,042 |
| Mode M9 | |||
|---|---|---|---|
| Quadrant | BADHDUFLAG | Total packets | Discarded packets |
| A | 0 | 138 | 0 |
| B | 0 | 138 | 0 |
| C | 0 | 138 | 0 |
| D | 0 | 138 | 0 |
| Mode SS | |||
|---|---|---|---|
| Quadrant | BADHDUFLAG | Total packets | Discarded packets |
| A | 0 | 2022 | 0 |
| B | 0 | 2022 | 0 |
| C | 0 | 2022 | 0 |
| D | 0 | 2022 | 0 |
| Mode M0 | |||
|---|---|---|---|
| Quadrant | BADHDUFLAG | Total packets | Discarded packets |
| A | 0 | 210099 | 0 |
| B | 0 | 246184 | 0 |
| C | 0 | 242298 | 0 |
| D | 0 | 552342 | 0 |
| Quadrant | Total seconds | Saturated seconds | Saturation percentage |
|---|---|---|---|
| A | 99448 | 1213 | 1.219733% |
| B | 99448 | 4529 | 4.554139% |
| C | 99448 | 3265 | 3.283123% |
| D | 99448 | 51815 | 52.102606% |
Noise dominated data is calculated using 1-second bins in cleaned event files. If a bin has >2000 counts, and if more than 50% of those come from <1% of pixels, then it is considered to be noise-dominated and hence unusable.
| Quadrant | # 1 sec bins | Bins with >0 counts | Bins with >2000 counts | High rate bins dominated by noise | Noise dominated (total time) | Noise dominated (detector-on time) | Marked lightcurve |
|---|---|---|---|---|---|---|---|
| A | 113068 | 99446 | 0 | 0 | 0.00% | 0.00% | 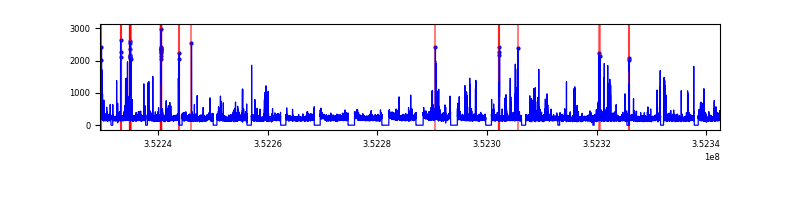 |
| B | 113068 | 99396 | 0 | 0 | 0.00% | 0.00% | 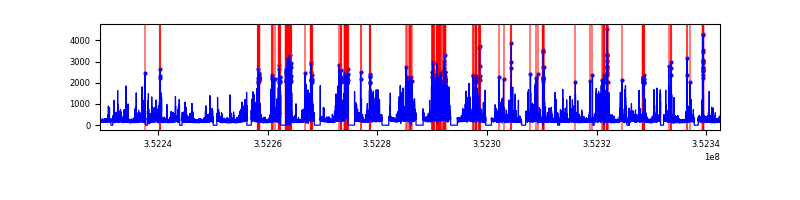 |
| C | 113068 | 99444 | 0 | 0 | 0.00% | 0.00% | 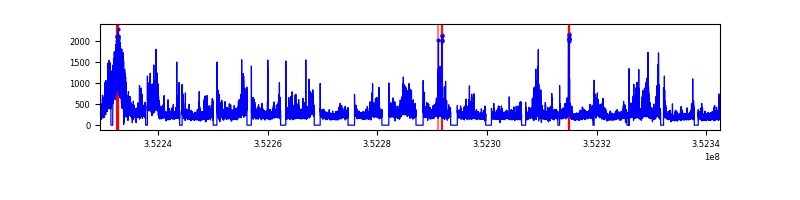 |
| D | 113068 | 98991 | 0 | 0 | 0.00% | 0.00% | 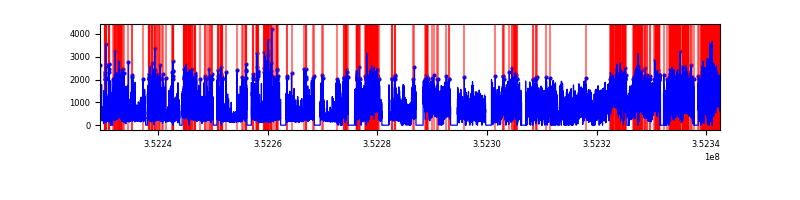 |
Top three noisy pixels from each quadrant. If the there are fewer than three noisy pixels in the level2.evt file, extra rows are filled as -1
| Pixel properties | Quadrant properties | ||||||
|---|---|---|---|---|---|---|---|
| Quadrant | DetID | PixID | Counts | Sigma | Mean | Median | Sigma |
| A | 0 | 29 | 5203 | 9.61 | 1590 | 1490 | 386.4 |
| A | 7 | 110 | 4878 | 8.77 | 1590 | 1490 | 386.4 |
| A | 0 | 30 | 4573 | 7.98 | 1590 | 1490 | 386.4 |
| B | 2 | 9 | 4595 | 10.59 | 1506 | 1434 | 298.4 |
| B | 2 | 8 | 3842 | 8.07 | 1506 | 1434 | 298.4 |
| B | 5 | 128 | 3772 | 7.83 | 1506 | 1434 | 298.4 |
| C | 12 | 241 | 4046 | 6.63 | 1550 | 1450 | 391.5 |
| C | 9 | 209 | 3927 | 6.33 | 1550 | 1450 | 391.5 |
| C | 3 | 187 | 3927 | 6.33 | 1550 | 1450 | 391.5 |
| D | 15 | 46 | 2745 | 6.59 | 1034 | 945 | 273.3 |
| D | 3 | 14 | 2584 | 6.0 | 1034 | 945 | 273.3 |
| D | 6 | 231 | 2565 | 5.93 | 1034 | 945 | 273.3 |
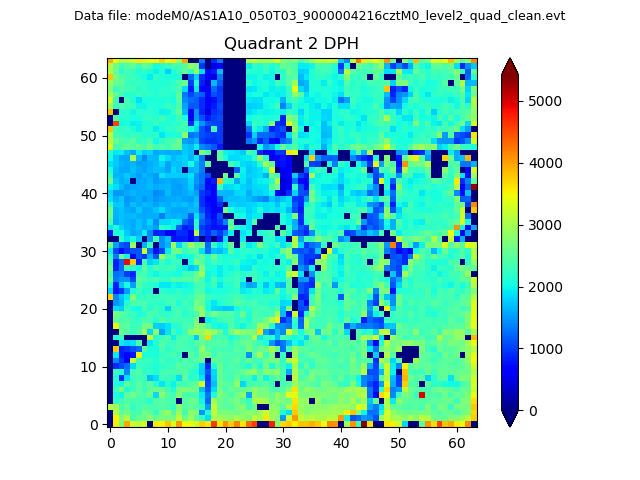
Histogram calculated using DETX and DETY for each event in the final _common_clean file
| Quadrant A | 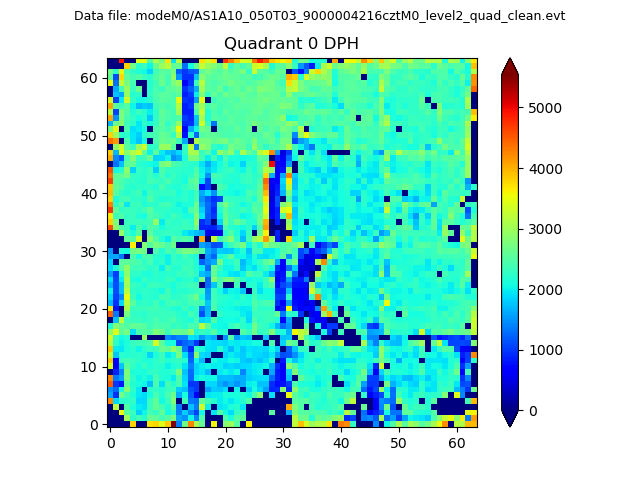 |
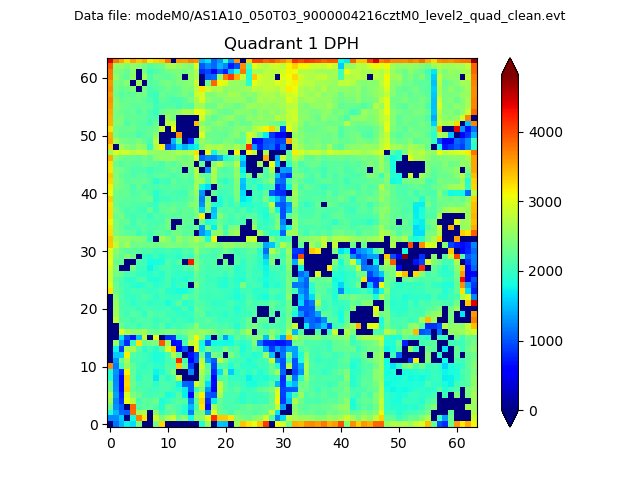 |
Quadrant B |
|---|---|---|---|
| Quadrant D | 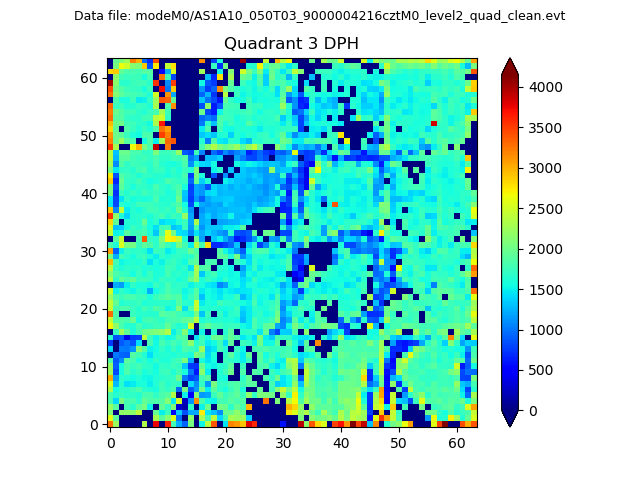 |
 |
Quadrant C |
| Plot type | Count rate plots | Images |
|---|---|---|
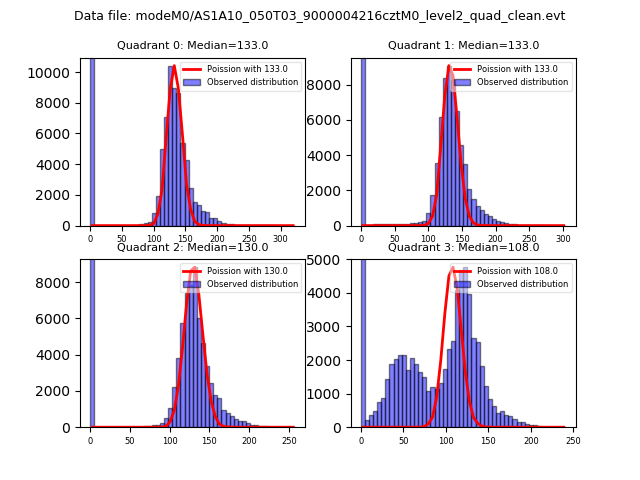
| Comparison with Poisson distribution Blue bars denote a histogram of data divided into 1 sec bins. Red curve is a Poisson curve with rate = median count rate of data. |
 |
 |
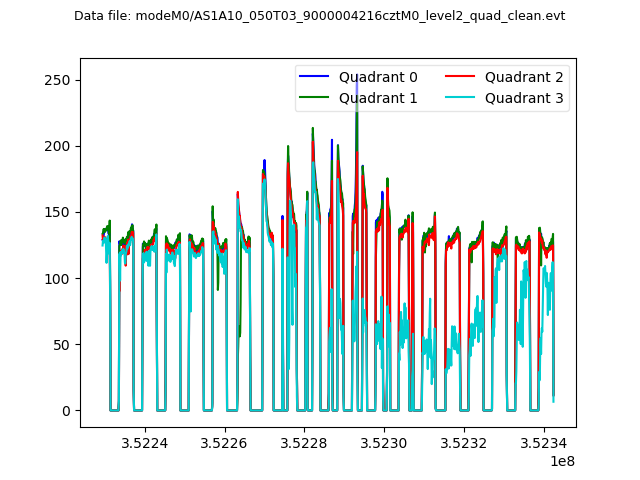
| Quadrant-wise count rates Data is divided into 100 sec bins |
 |
|
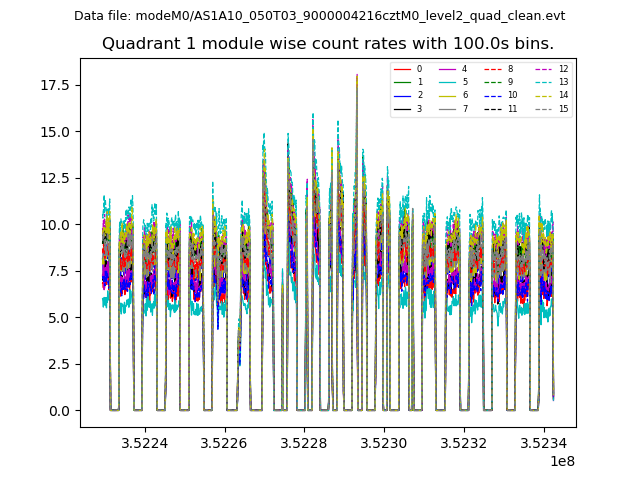
| Module-wise count rates for Quadrant A Data is divided into 100 sec bins |
 |
 |
| Module-wise count rates for Quadrant B Data is divided into 100 sec bins |
 |
 |
| Module-wise count rates for Quadrant C Data is divided into 100 sec bins |
 |
 |
| Module-wise count rates for Quadrant D Data is divided into 100 sec bins |
 |
 |
| Parameter | Plot |
|---|---|
| CZT HV Monitor | 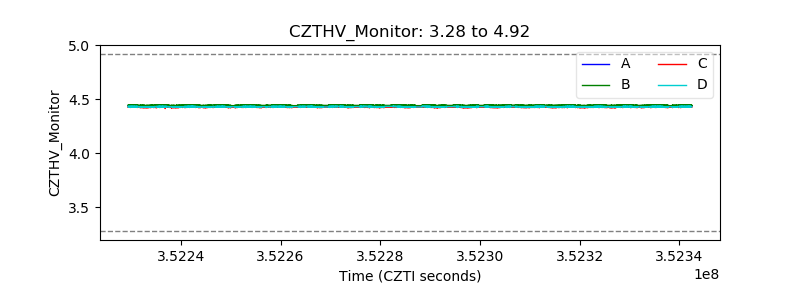 |
| D_VDD | 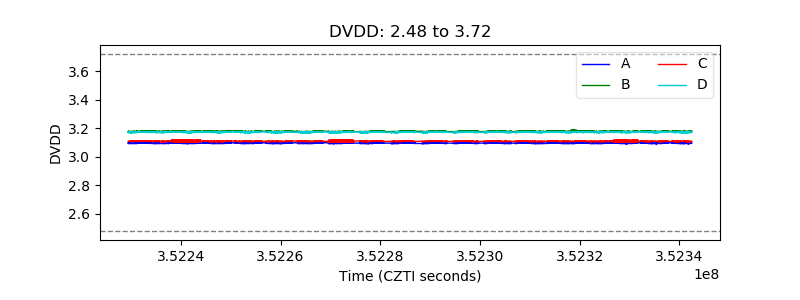 |
| Temperature 1 |  |
| Veto HV Monitor | 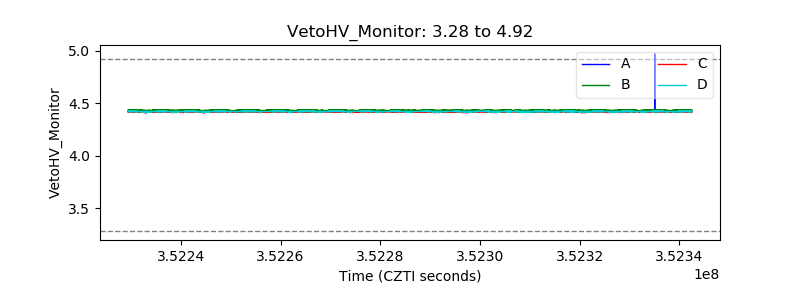 |
| Veto LLD | 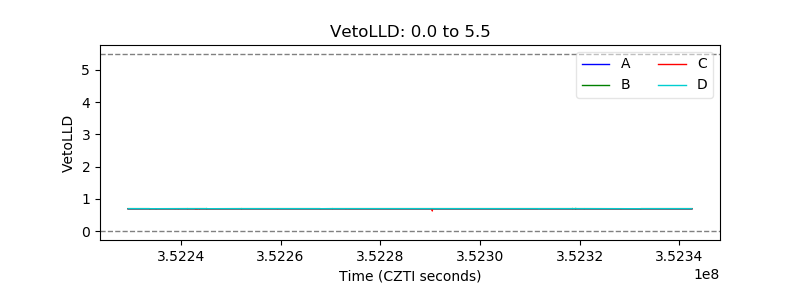 |
| Alpha Counter | 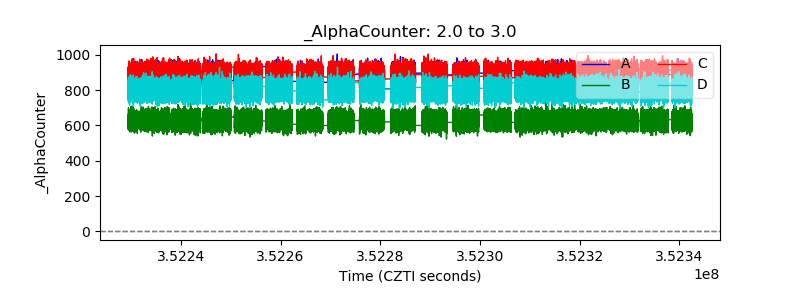 |
| _CPM_Rate | 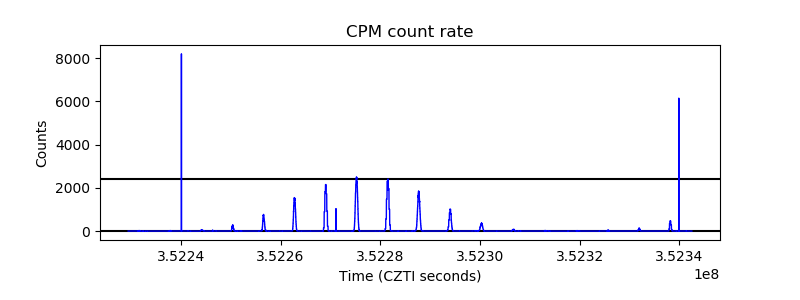 |
| CZT Counter |  |
| +2.5 Volts monitor |  |
| +5 Volts monitor |  |
| _ROLL_ROT | 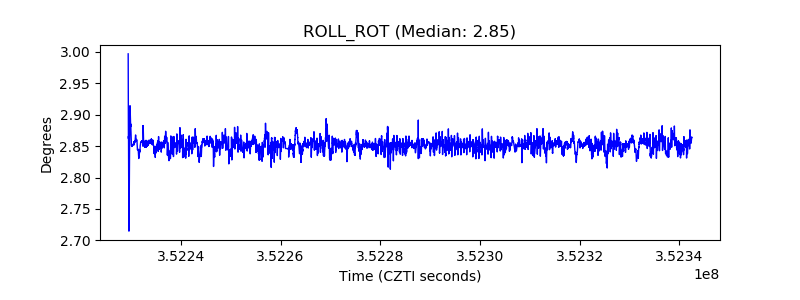 |
| _Roll_DEC | 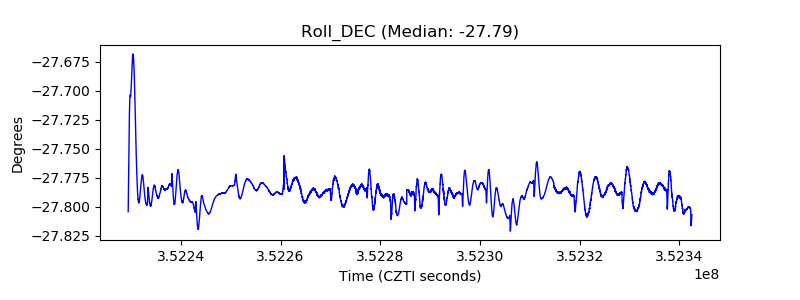 |
| _Roll_RA |  |
| Veto Counter | 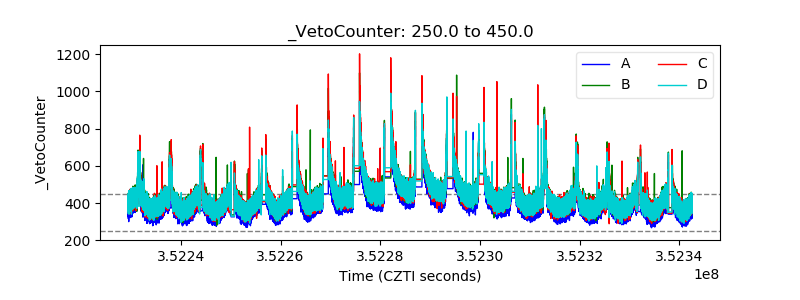 |