| Param | Original file | Final file |
|---|---|---|
| Filename | modeM0/AS1A10_050T03_9000004216_29316cztM0_level2.evt | modeM0/AS1A10_050T03_9000004216_29316cztM0_level2_quad_clean.evt |
| Size (bytes) | 394,240,320 | 42,670,080 |
| Size | 376.0 MB | 40.7 MB |
| Events in quadrant A | 2,019,072 | 266,515 |
| Events in quadrant B | 1,901,854 | 271,362 |
| Events in quadrant C | 4,458,264 | 253,680 |
| Events in quadrant D | 3,318,396 | 248,176 |
| Mode M9 | |||
|---|---|---|---|
| Quadrant | BADHDUFLAG | Total packets | Discarded packets |
| A | 0 | 3 | 0 |
| B | 0 | 3 | 0 |
| C | 0 | 3 | 0 |
| D | 0 | 3 | 0 |
| Mode SS | |||
|---|---|---|---|
| Quadrant | BADHDUFLAG | Total packets | Discarded packets |
| A | 0 | 74 | 0 |
| B | 0 | 74 | 0 |
| C | 0 | 74 | 0 |
| D | 0 | 74 | 0 |
| Mode M0 | |||
|---|---|---|---|
| Quadrant | BADHDUFLAG | Total packets | Discarded packets |
| A | 0 | 8109 | 1 |
| B | 0 | 7794 | 1 |
| C | 0 | 15717 | 1 |
| D | 0 | 12209 | 1 |
| Quadrant | Total seconds | Saturated seconds | Saturation percentage |
|---|---|---|---|
| A | 3555 | 81 | 2.278481% |
| B | 3555 | 92 | 2.587904% |
| C | 3555 | 907 | 25.513361% |
| D | 3555 | 326 | 9.170183% |
Noise dominated data is calculated using 1-second bins in cleaned event files. If a bin has >2000 counts, and if more than 50% of those come from <1% of pixels, then it is considered to be noise-dominated and hence unusable.
| Quadrant | # 1 sec bins | Bins with >0 counts | Bins with >2000 counts | High rate bins dominated by noise | Noise dominated (total time) | Noise dominated (detector-on time) | Marked lightcurve |
|---|---|---|---|---|---|---|---|
| A | 3885 | 3556 | 9 | 9 | 0.23% | 0.25% | 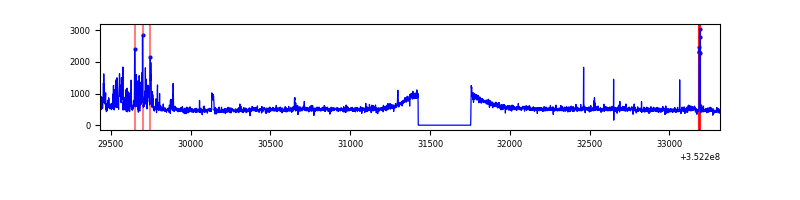 |
| B | 3885 | 3556 | 1 | 1 | 0.03% | 0.03% | 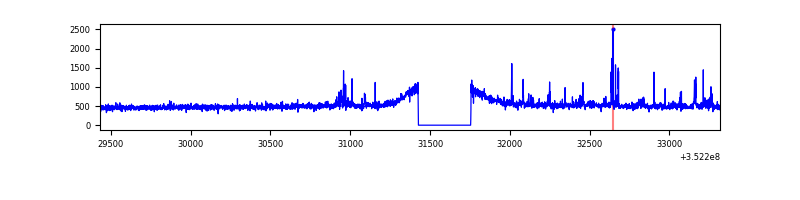 |
| C | 3885 | 3556 | 296 | 296 | 7.62% | 8.32% | 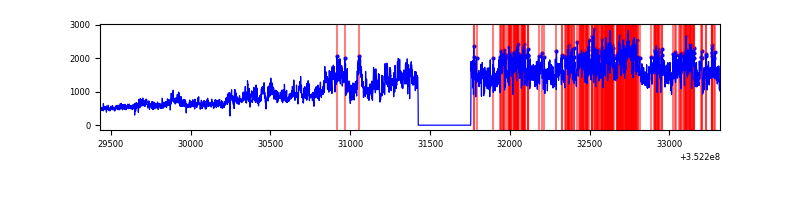 |
| D | 3885 | 3555 | 198 | 198 | 5.10% | 5.57% | 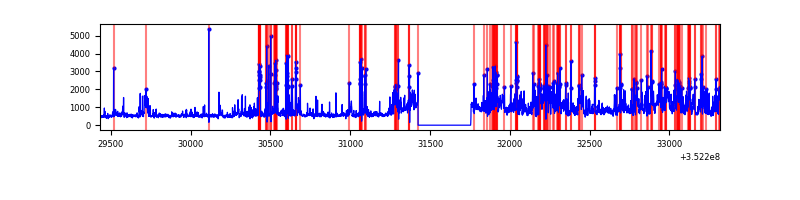 |
Top three noisy pixels from each quadrant. If the there are fewer than three noisy pixels in the level2.evt file, extra rows are filled as -1
| Pixel properties | Quadrant properties | ||||||
|---|---|---|---|---|---|---|---|
| Quadrant | DetID | PixID | Counts | Sigma | Mean | Median | Sigma |
| A | 14 | 235 | 166437 | 1722.43 | 468 | 457 | 96.4 |
| A | 1 | 113 | 19525 | 197.88 | 468 | 457 | 96.4 |
| A | 13 | 248 | 17777 | 179.74 | 468 | 457 | 96.4 |
| B | 0 | 190 | 44089 | 478.54 | 462 | 449 | 91.2 |
| B | 5 | 172 | 21305 | 228.7 | 462 | 449 | 91.2 |
| B | 3 | 209 | 11048 | 116.23 | 462 | 449 | 91.2 |
| C | 3 | 233 | 2725442 | 27025.45 | 424 | 427 | 100.8 |
| C | 14 | 238 | 66167 | 651.98 | 424 | 427 | 100.8 |
| C | 2 | 114 | 8806 | 83.1 | 424 | 427 | 100.8 |
| D | 1 | 52 | 1271134 | 11705.88 | 442 | 429 | 108.6 |
| D | 8 | 195 | 237390 | 2182.91 | 442 | 429 | 108.6 |
| D | 2 | 250 | 44451 | 405.53 | 442 | 429 | 108.6 |
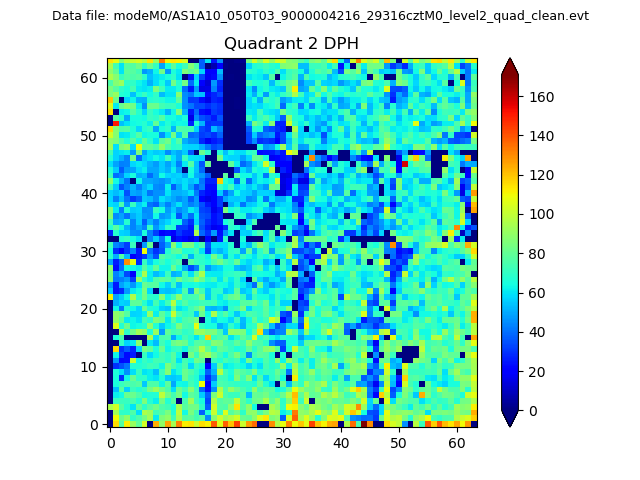
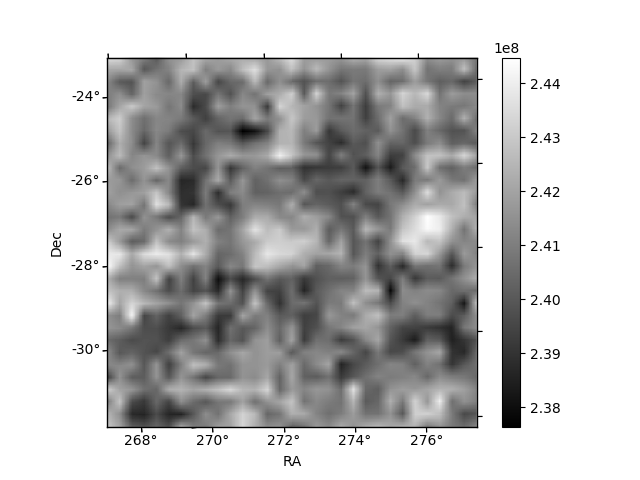
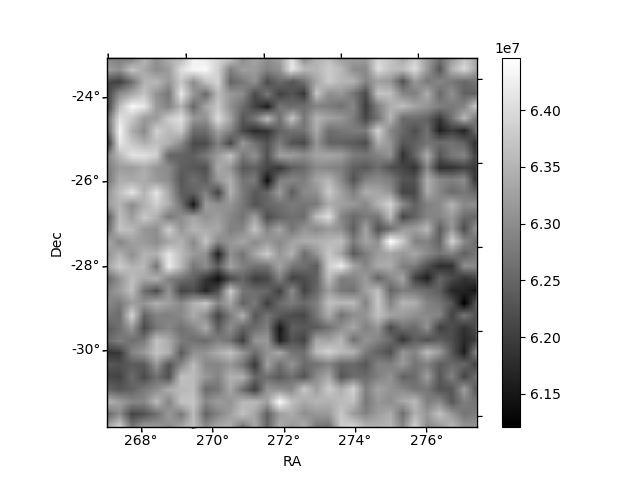
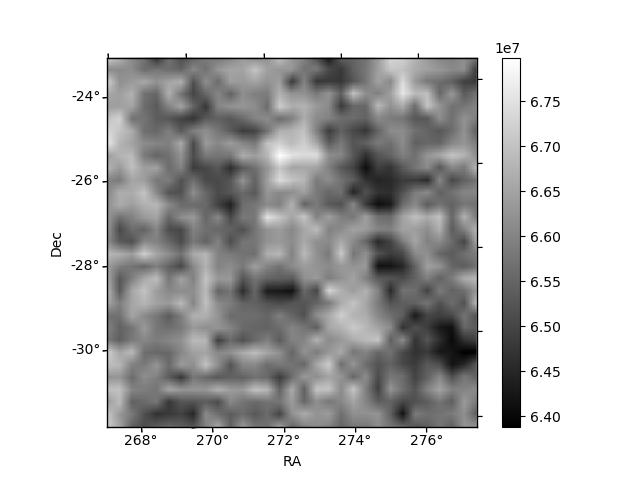
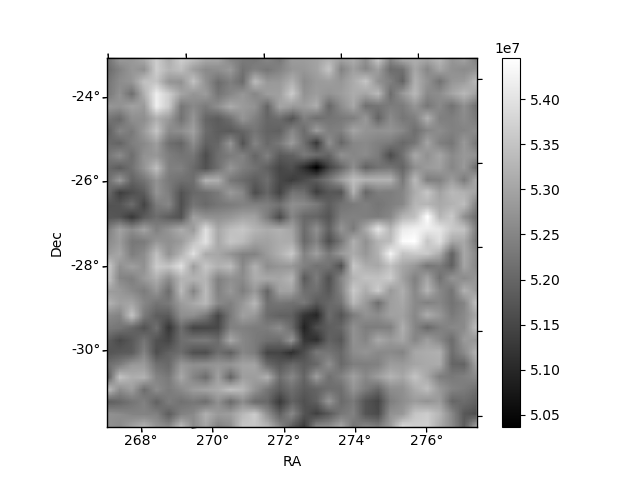
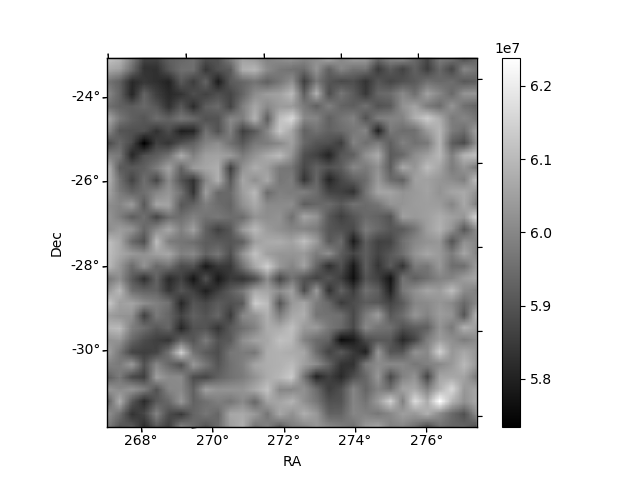
Histogram calculated using DETX and DETY for each event in the final _common_clean file
| Quadrant A | 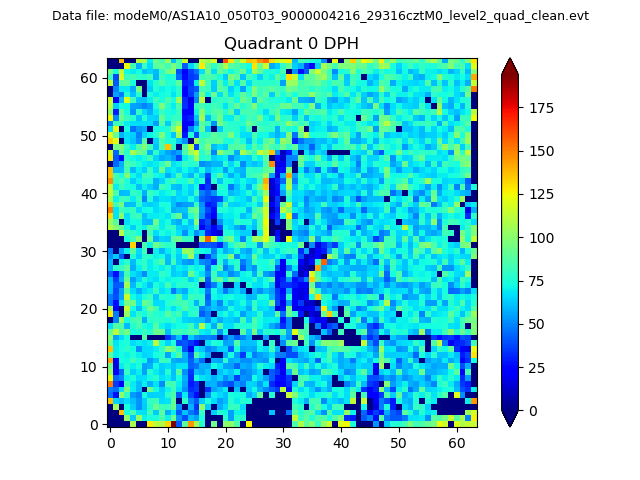 |
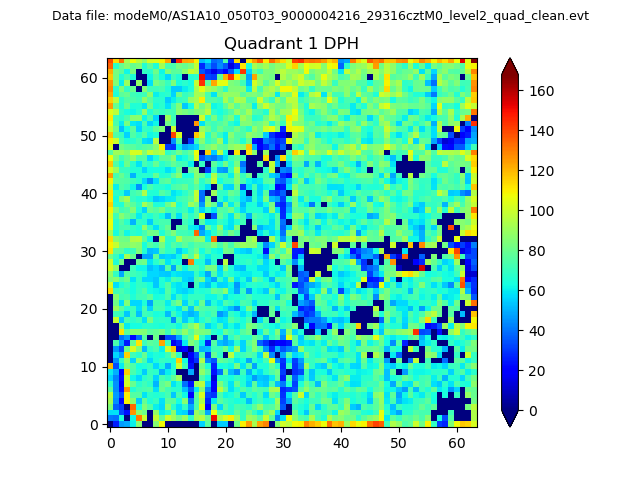 |
Quadrant B |
|---|---|---|---|
| Quadrant D | 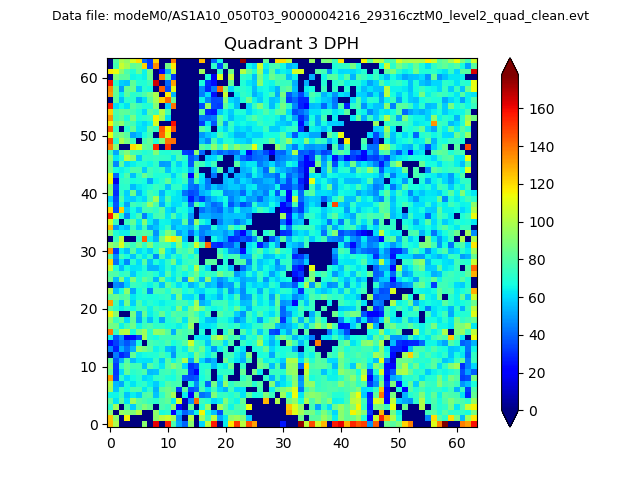 |
 |
Quadrant C |
| Plot type | Count rate plots | Images |
|---|---|---|
| Comparison with Poisson distribution Blue bars denote a histogram of data divided into 1 sec bins. Red curve is a Poisson curve with rate = median count rate of data. |
 |
 |
| Quadrant-wise count rates Data is divided into 100 sec bins |
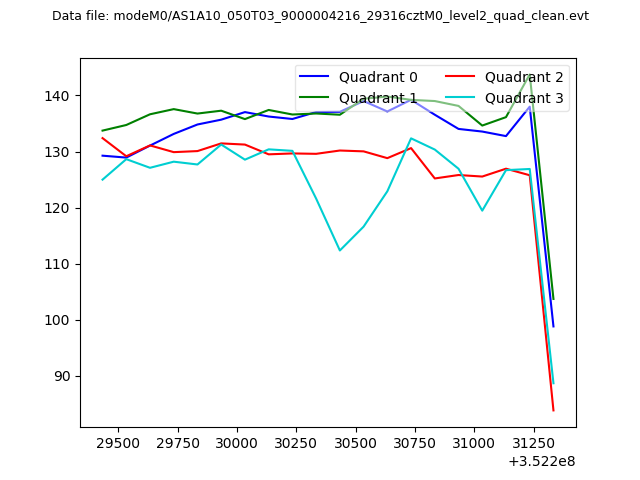 |
|
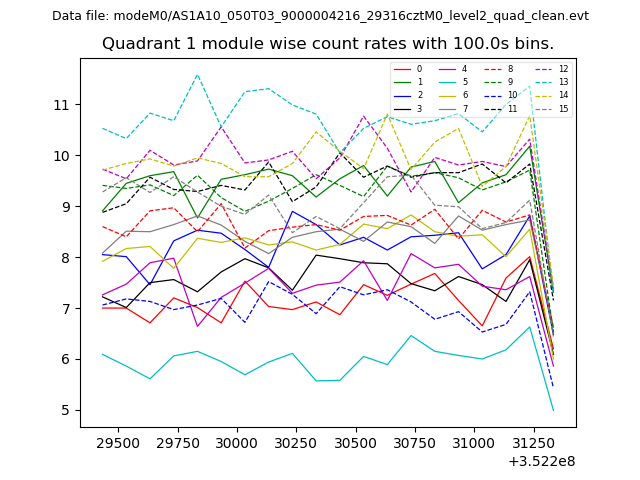
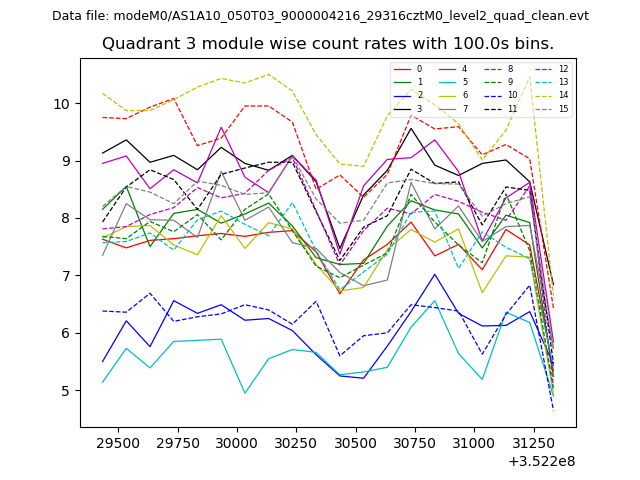
| Module-wise count rates for Quadrant A Data is divided into 100 sec bins |
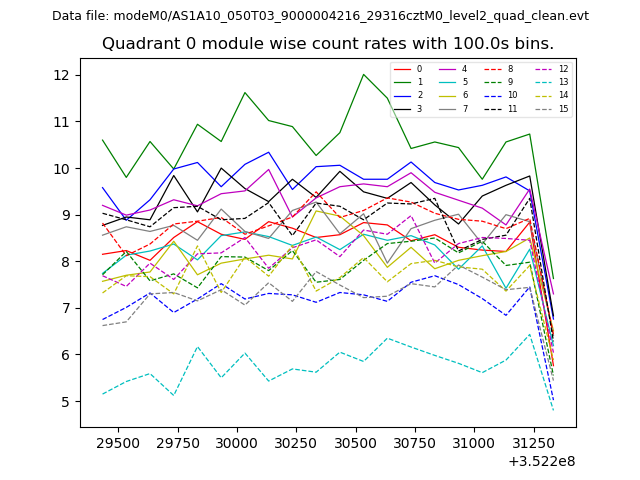 |
 |
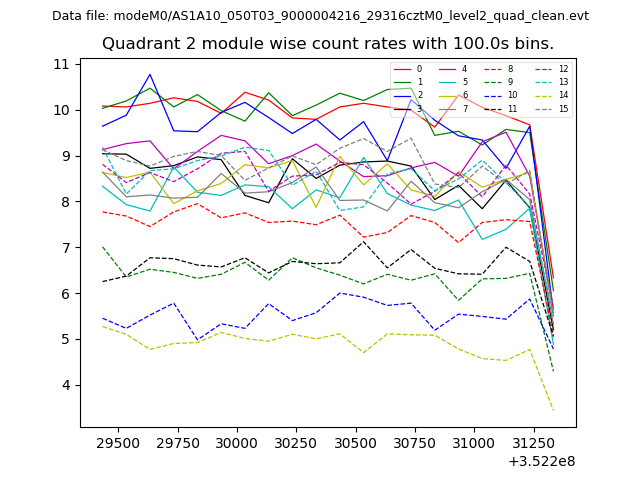
| Module-wise count rates for Quadrant B Data is divided into 100 sec bins |
 |
 |
| Module-wise count rates for Quadrant C Data is divided into 100 sec bins |
 |
 |
| Module-wise count rates for Quadrant D Data is divided into 100 sec bins |
 |
 |
| Parameter | Plot |
|---|---|
| CZT HV Monitor | 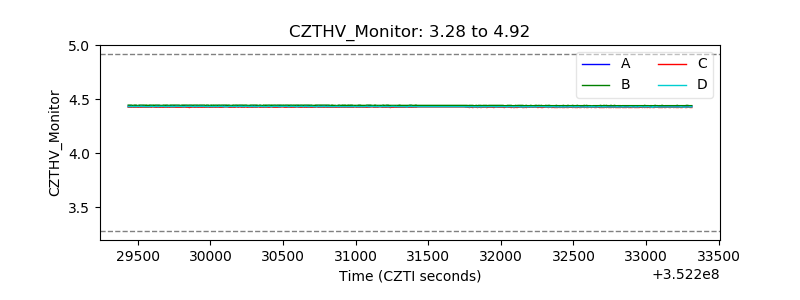 |
| D_VDD | 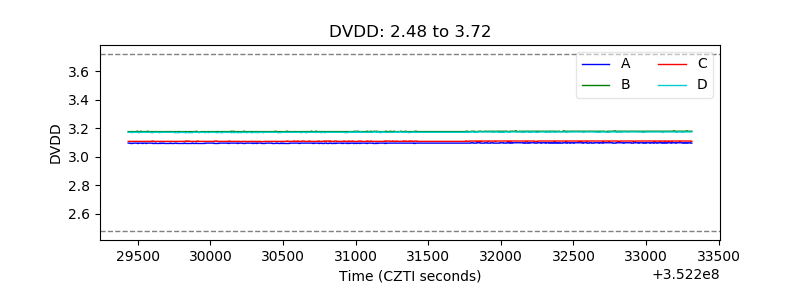 |
| Temperature 1 | 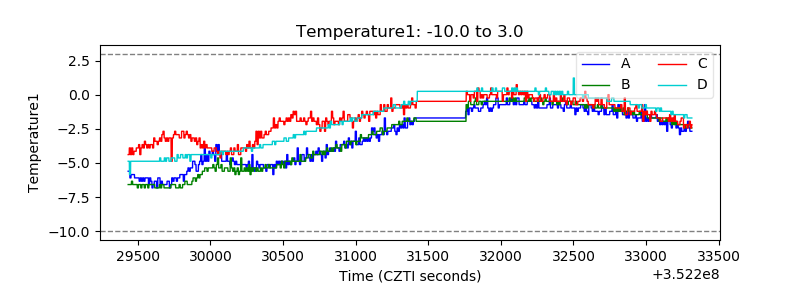 |
| Veto HV Monitor | 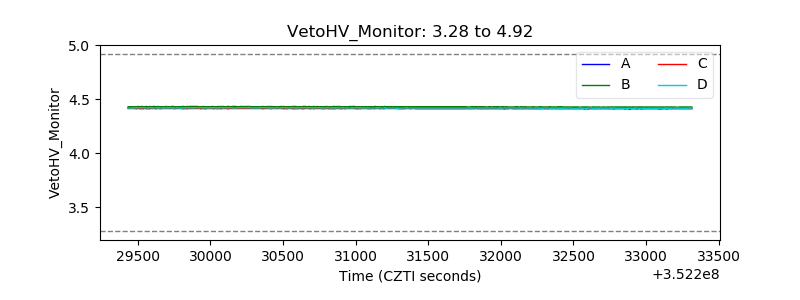 |
| Veto LLD | 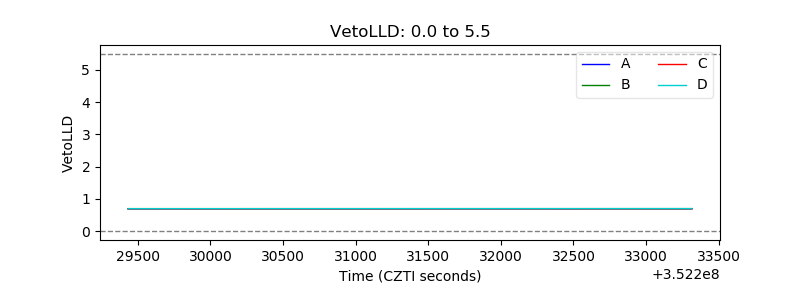 |
| Alpha Counter | 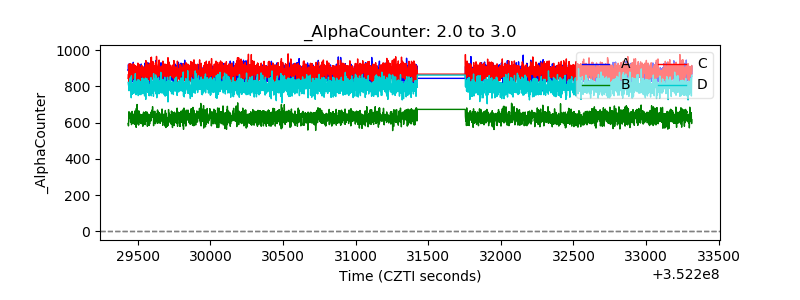 |
| _CPM_Rate | 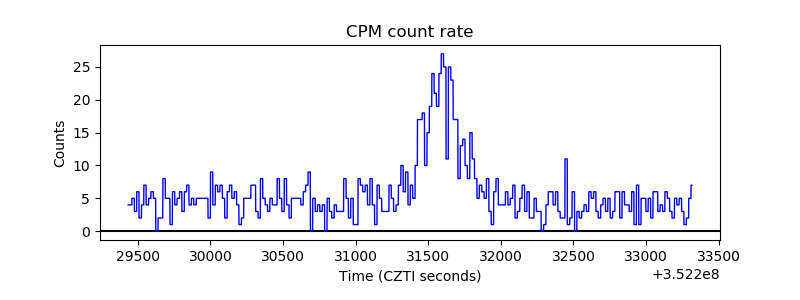 |
| CZT Counter | 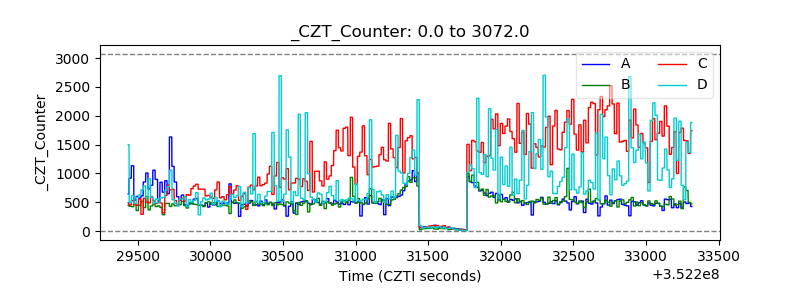 |
| +2.5 Volts monitor |  |
| +5 Volts monitor |  |
| _ROLL_ROT | 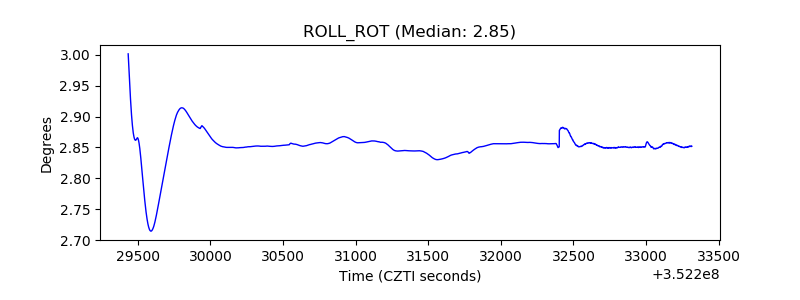 |
| _Roll_DEC | 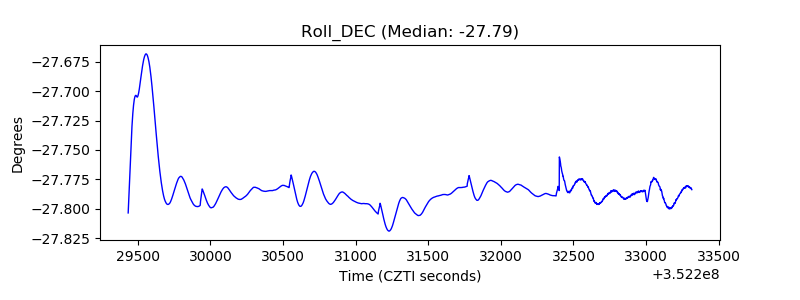 |
| _Roll_RA | 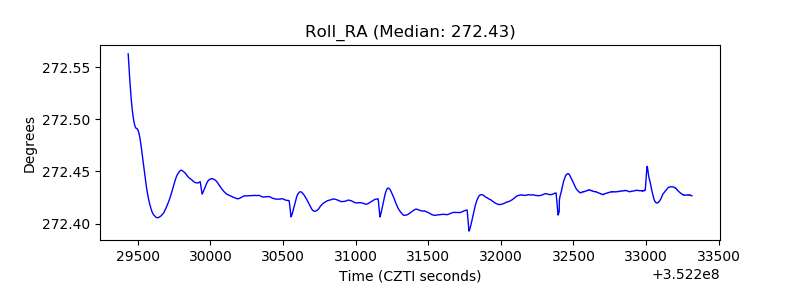 |
| Veto Counter | 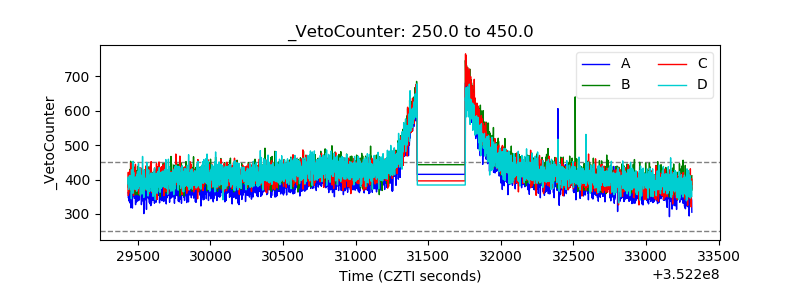 |