| Param | Original file | Final file |
|---|---|---|
| Filename | modeM0/AS1A10_050T03_9000004216_29317cztM0_level2.evt | modeM0/AS1A10_050T03_9000004216_29317cztM0_level2_quad_clean.evt |
| Size (bytes) | 771,615,360 | 81,679,680 |
| Size | 735.9 MB | 77.9 MB |
| Events in quadrant A | 4,105,135 | 497,128 |
| Events in quadrant B | 4,115,840 | 503,010 |
| Events in quadrant C | 7,434,702 | 472,812 |
| Events in quadrant D | 7,196,832 | 468,858 |
| Mode M9 | |||
|---|---|---|---|
| Quadrant | BADHDUFLAG | Total packets | Discarded packets |
| A | 0 | 7 | 0 |
| B | 0 | 7 | 0 |
| C | 0 | 7 | 0 |
| D | 0 | 7 | 0 |
| Mode SS | |||
|---|---|---|---|
| Quadrant | BADHDUFLAG | Total packets | Discarded packets |
| A | 0 | 156 | 0 |
| B | 0 | 156 | 0 |
| C | 0 | 156 | 0 |
| D | 0 | 156 | 0 |
| Mode M0 | |||
|---|---|---|---|
| Quadrant | BADHDUFLAG | Total packets | Discarded packets |
| A | 0 | 16900 | 2 |
| B | 0 | 17019 | 2 |
| C | 0 | 27525 | 3 |
| D | 0 | 26556 | 2 |
| Quadrant | Total seconds | Saturated seconds | Saturation percentage |
|---|---|---|---|
| A | 7642 | 146 | 1.910495% |
| B | 7642 | 218 | 2.852656% |
| C | 7641 | 1146 | 14.998037% |
| D | 7641 | 753 | 9.854731% |
Noise dominated data is calculated using 1-second bins in cleaned event files. If a bin has >2000 counts, and if more than 50% of those come from <1% of pixels, then it is considered to be noise-dominated and hence unusable.
| Quadrant | # 1 sec bins | Bins with >0 counts | Bins with >2000 counts | High rate bins dominated by noise | Noise dominated (total time) | Noise dominated (detector-on time) | Marked lightcurve |
|---|---|---|---|---|---|---|---|
| A | 8297 | 7644 | 23 | 23 | 0.28% | 0.30% | 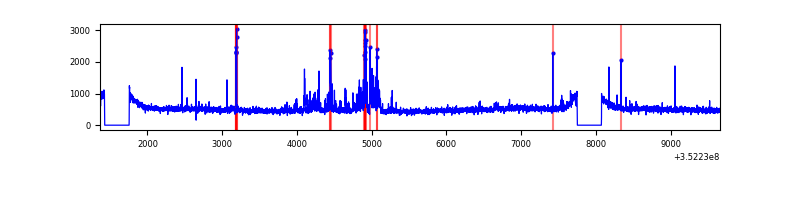 |
| B | 8297 | 7644 | 9 | 9 | 0.11% | 0.12% | 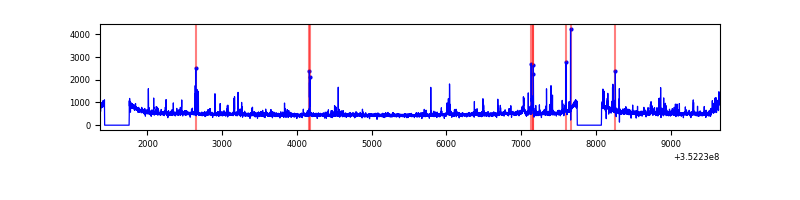 |
| C | 8296 | 7643 | 311 | 311 | 3.75% | 4.07% | 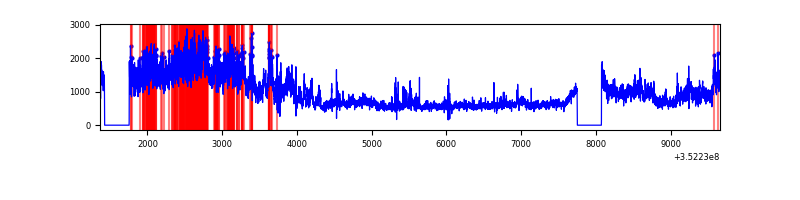 |
| D | 8296 | 7642 | 467 | 467 | 5.63% | 6.11% | 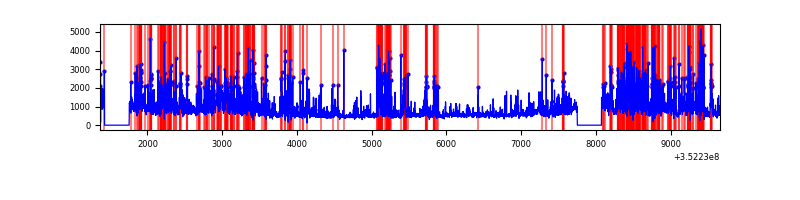 |
Top three noisy pixels from each quadrant. If the there are fewer than three noisy pixels in the level2.evt file, extra rows are filled as -1
| Pixel properties | Quadrant properties | ||||||
|---|---|---|---|---|---|---|---|
| Quadrant | DetID | PixID | Counts | Sigma | Mean | Median | Sigma |
| A | 14 | 235 | 303705 | 1539.59 | 968 | 946 | 196.6 |
| A | 1 | 113 | 26373 | 129.3 | 968 | 946 | 196.6 |
| A | 13 | 248 | 19723 | 95.48 | 968 | 946 | 196.6 |
| B | 10 | 245 | 133914 | 726.73 | 955 | 931 | 183.0 |
| B | 0 | 190 | 101161 | 547.74 | 955 | 931 | 183.0 |
| B | 5 | 172 | 41550 | 221.98 | 955 | 931 | 183.0 |
| C | 3 | 233 | 3690171 | 17628.6 | 888 | 894 | 209.3 |
| C | 14 | 238 | 174398 | 829.06 | 888 | 894 | 209.3 |
| C | 14 | 254 | 55496 | 260.91 | 888 | 894 | 209.3 |
| D | 1 | 52 | 2836527 | 12949.72 | 906 | 883 | 219.0 |
| D | 8 | 195 | 564644 | 2574.56 | 906 | 883 | 219.0 |
| D | 2 | 250 | 95826 | 433.58 | 906 | 883 | 219.0 |
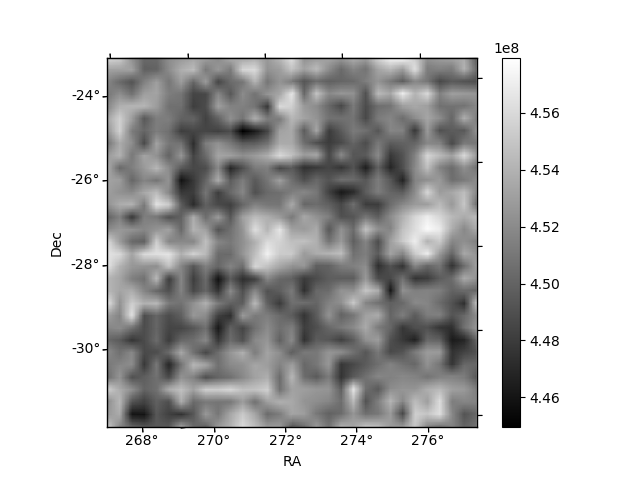
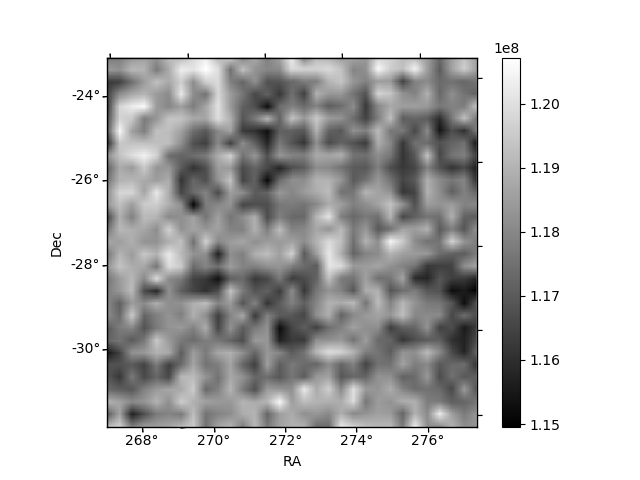
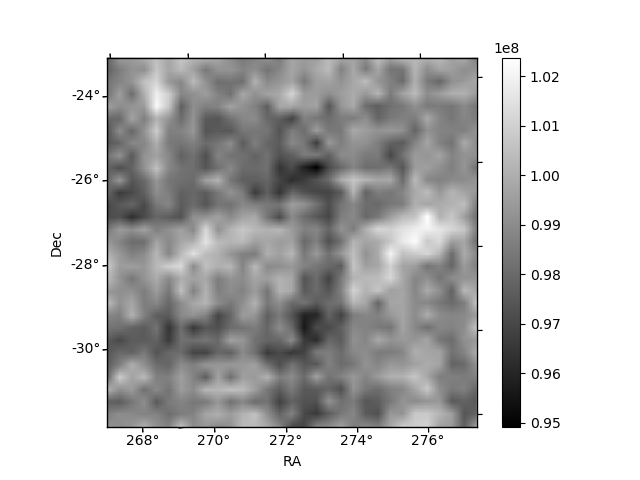
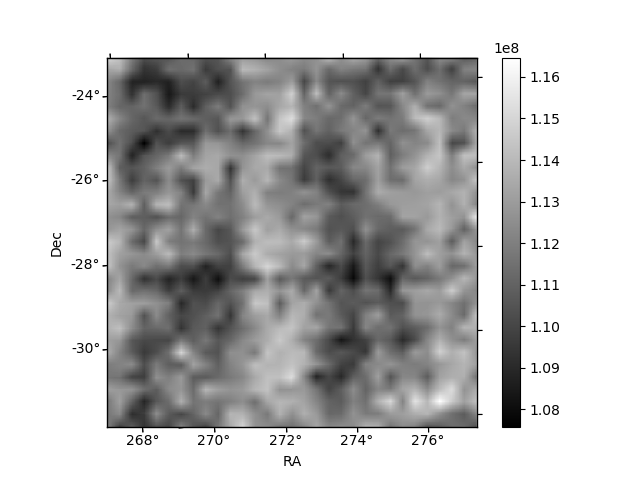
Histogram calculated using DETX and DETY for each event in the final _common_clean file
| Quadrant A | 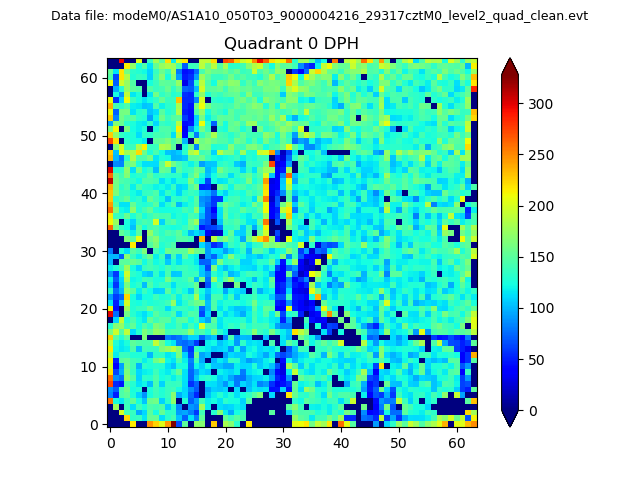 |
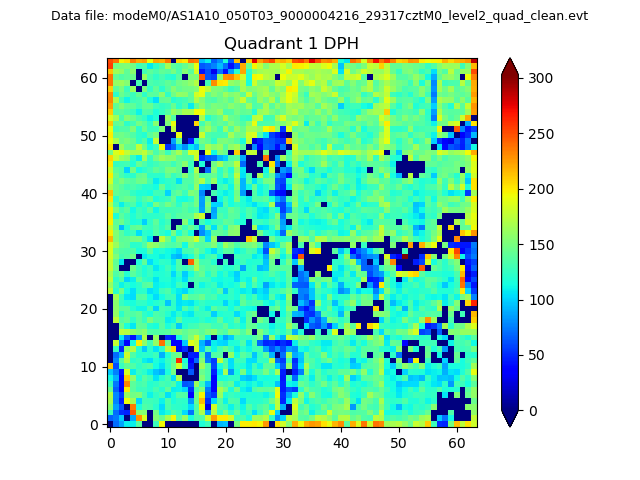 |
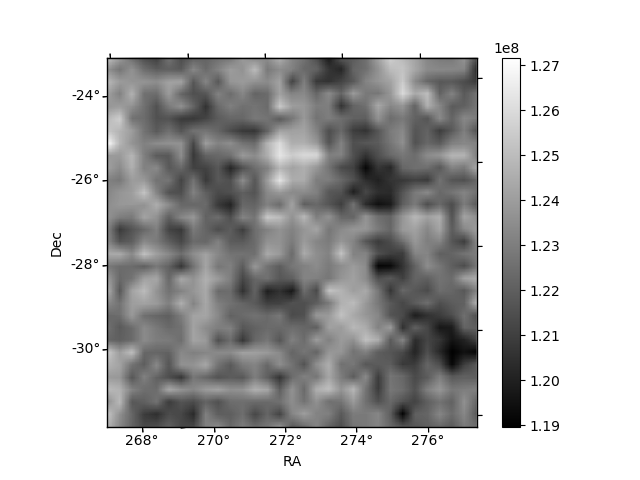
Quadrant B |
|---|---|---|---|
| Quadrant D | 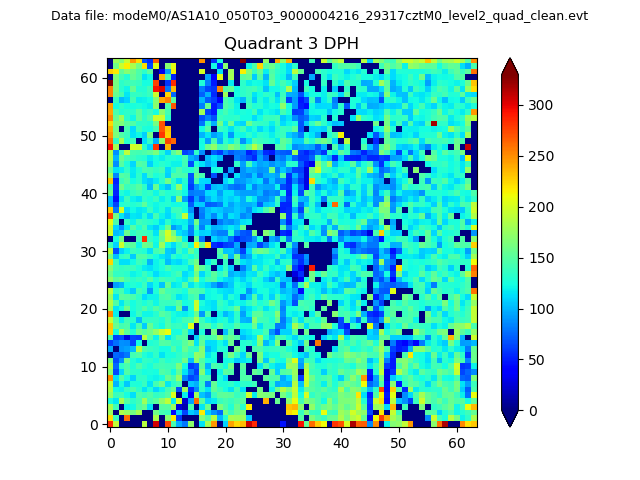 |
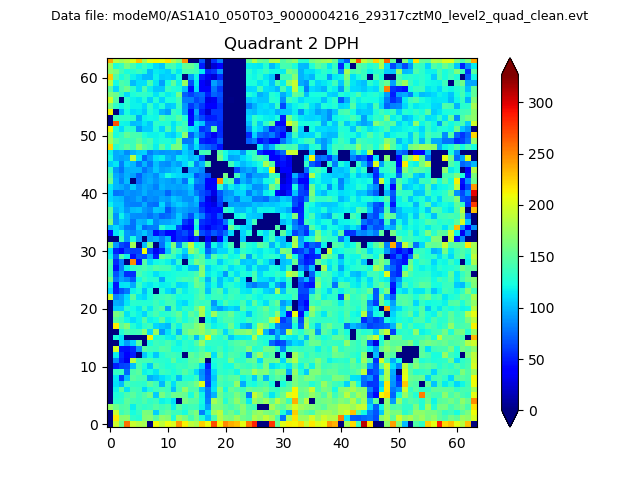 |
Quadrant C |
| Plot type | Count rate plots | Images |
|---|---|---|
| Comparison with Poisson distribution Blue bars denote a histogram of data divided into 1 sec bins. Red curve is a Poisson curve with rate = median count rate of data. |
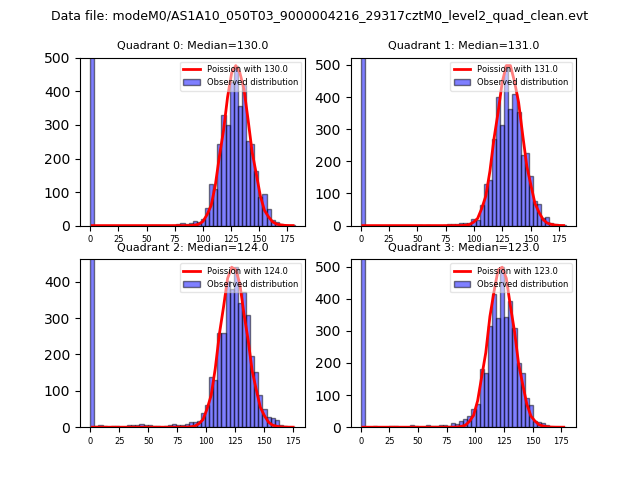 |
 |
| Quadrant-wise count rates Data is divided into 100 sec bins |
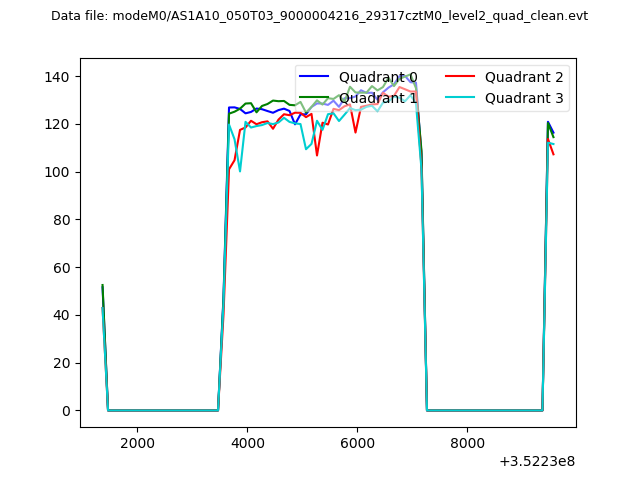 |
|
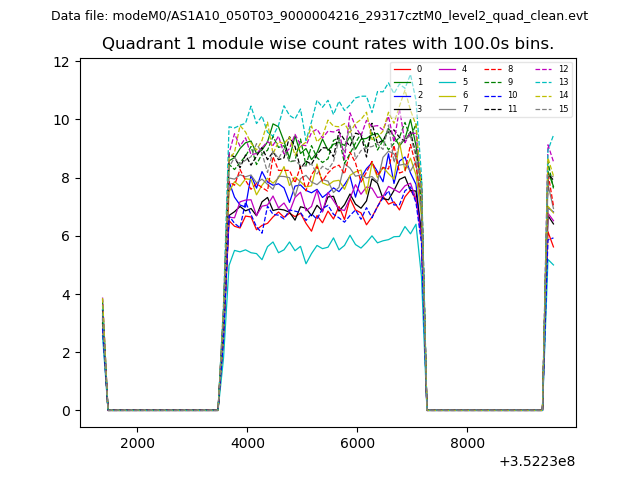
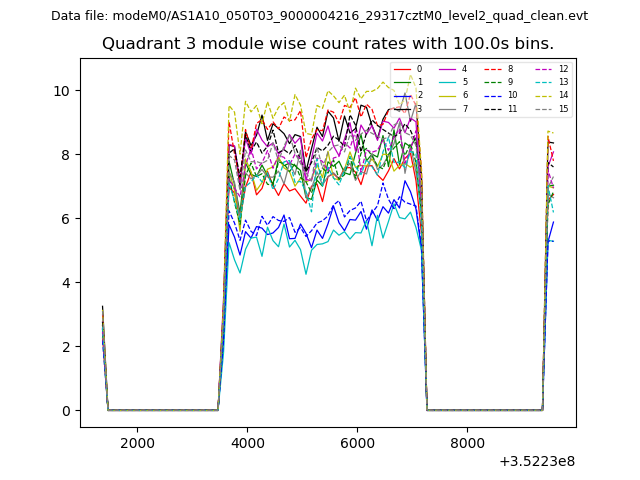
| Module-wise count rates for Quadrant A Data is divided into 100 sec bins |
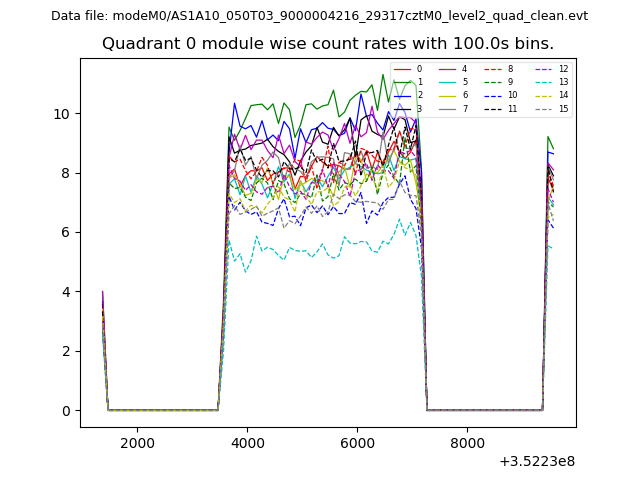 |
 |
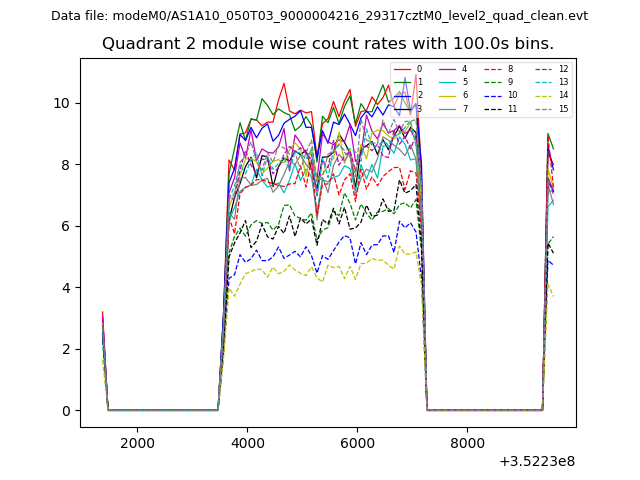
| Module-wise count rates for Quadrant B Data is divided into 100 sec bins |
 |
 |
| Module-wise count rates for Quadrant C Data is divided into 100 sec bins |
 |
 |
| Module-wise count rates for Quadrant D Data is divided into 100 sec bins |
 |
 |
| Parameter | Plot |
|---|---|
| CZT HV Monitor | 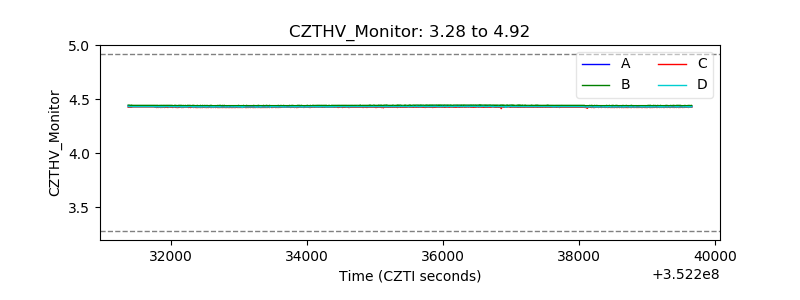 |
| D_VDD | 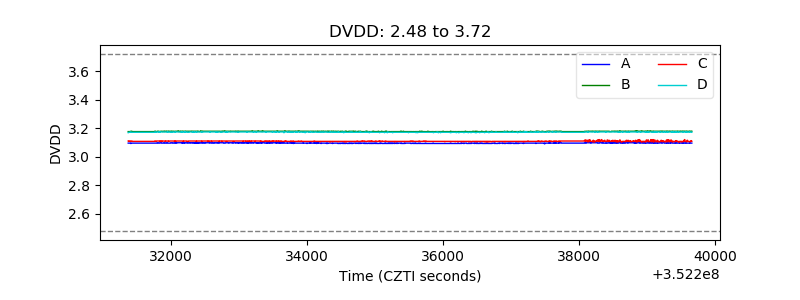 |
| Temperature 1 | 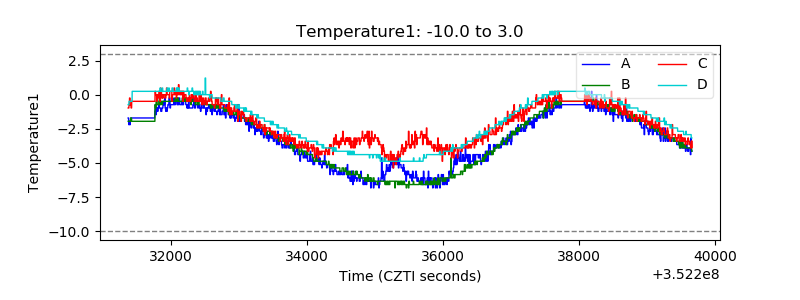 |
| Veto HV Monitor | 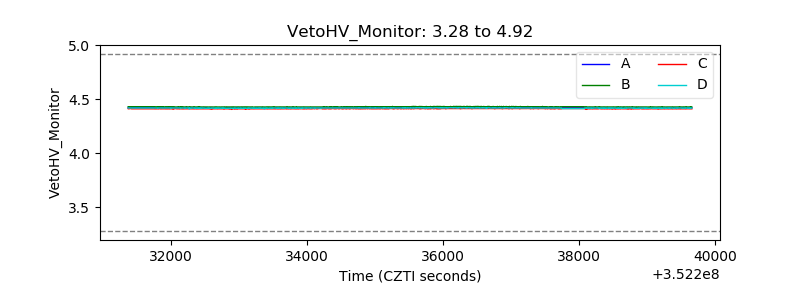 |
| Veto LLD |  |
| Alpha Counter | 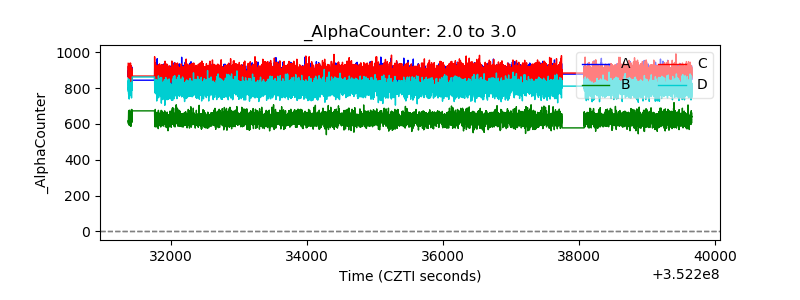 |
| _CPM_Rate | 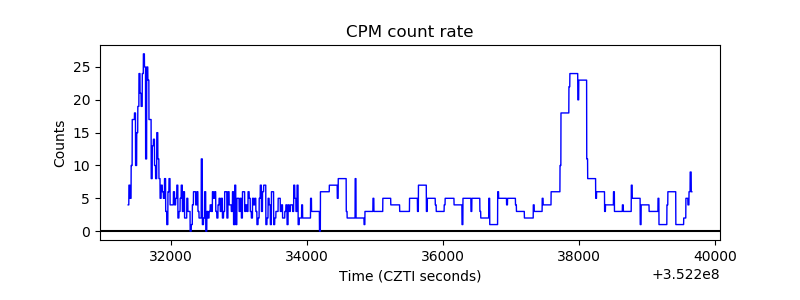 |
| CZT Counter | 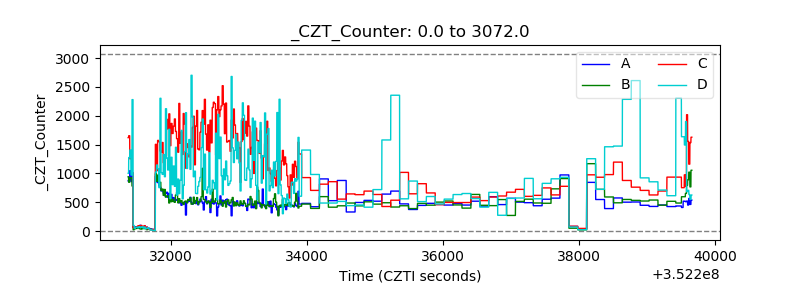 |
| +2.5 Volts monitor |  |
| +5 Volts monitor |  |
| _ROLL_ROT | 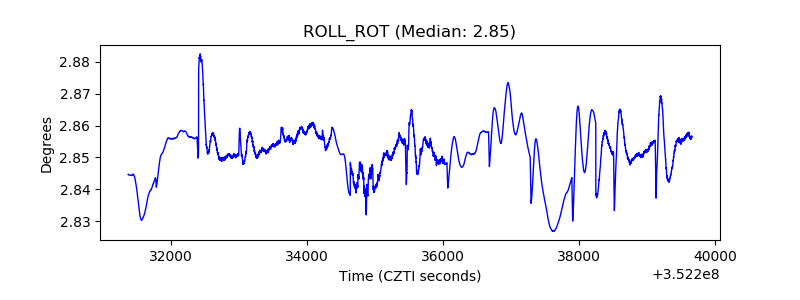 |
| _Roll_DEC | 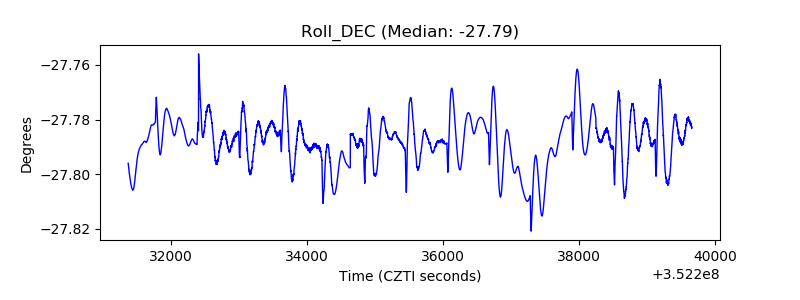 |
| _Roll_RA | 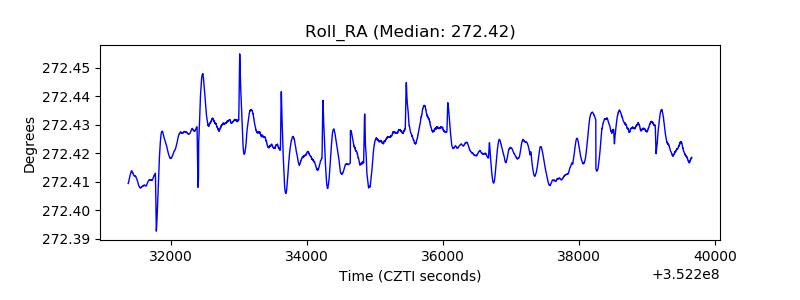 |
| Veto Counter | 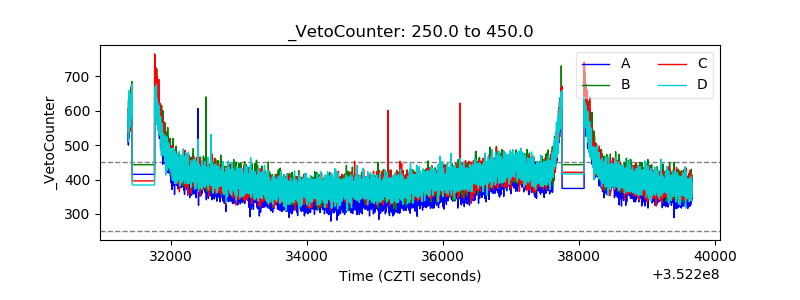 |