| Param | Original file | Final file |
|---|---|---|
| Filename | modeM0/AS1A10_050T03_9000004216_29320cztM0_level2.evt | modeM0/AS1A10_050T03_9000004216_29320cztM0_level2_quad_clean.evt |
| Size (bytes) | 892,535,040 | 142,450,560 |
| Size | 851.2 MB | 135.9 MB |
| Events in quadrant A | 5,129,840 | 917,952 |
| Events in quadrant B | 5,341,229 | 924,441 |
| Events in quadrant C | 6,435,271 | 889,615 |
| Events in quadrant D | 9,419,402 | 859,569 |
| Mode M9 | |||
|---|---|---|---|
| Quadrant | BADHDUFLAG | Total packets | Discarded packets |
| A | 0 | 5 | 0 |
| B | 0 | 5 | 0 |
| C | 0 | 5 | 0 |
| D | 0 | 5 | 0 |
| Mode SS | |||
|---|---|---|---|
| Quadrant | BADHDUFLAG | Total packets | Discarded packets |
| A | 0 | 210 | 0 |
| B | 0 | 210 | 0 |
| C | 0 | 210 | 0 |
| D | 0 | 210 | 0 |
| Mode M0 | |||
|---|---|---|---|
| Quadrant | BADHDUFLAG | Total packets | Discarded packets |
| A | 0 | 21881 | 2 |
| B | 0 | 22629 | 2 |
| C | 0 | 25702 | 2 |
| D | 0 | 35059 | 2 |
| Quadrant | Total seconds | Saturated seconds | Saturation percentage |
|---|---|---|---|
| A | 10437 | 134 | 1.283894% |
| B | 10437 | 139 | 1.331800% |
| C | 10437 | 286 | 2.740251% |
| D | 10438 | 738 | 7.070320% |
Noise dominated data is calculated using 1-second bins in cleaned event files. If a bin has >2000 counts, and if more than 50% of those come from <1% of pixels, then it is considered to be noise-dominated and hence unusable.
| Quadrant | # 1 sec bins | Bins with >0 counts | Bins with >2000 counts | High rate bins dominated by noise | Noise dominated (total time) | Noise dominated (detector-on time) | Marked lightcurve |
|---|---|---|---|---|---|---|---|
| A | 10892 | 10438 | 55 | 55 | 0.50% | 0.53% | 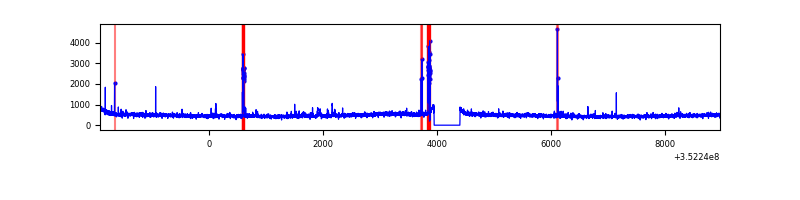 |
| B | 10892 | 10438 | 12 | 12 | 0.11% | 0.11% | 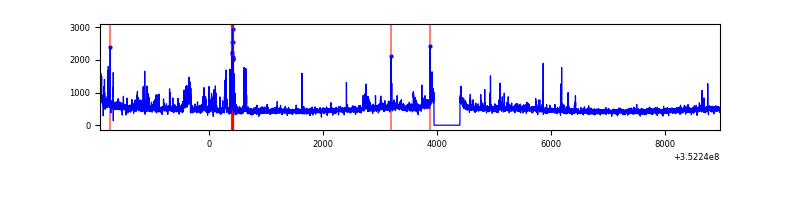 |
| C | 10892 | 10438 | 3 | 3 | 0.03% | 0.03% | 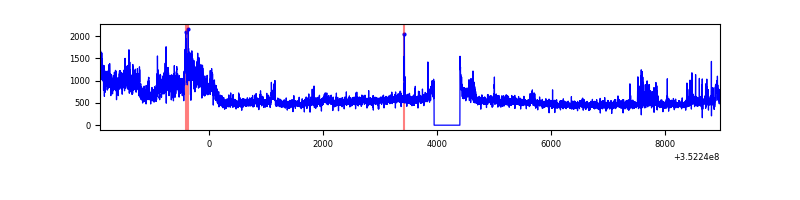 |
| D | 10893 | 10439 | 521 | 521 | 4.78% | 4.99% | 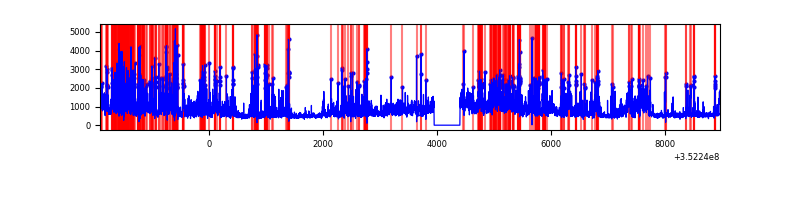 |
Top three noisy pixels from each quadrant. If the there are fewer than three noisy pixels in the level2.evt file, extra rows are filled as -1
| Pixel properties | Quadrant properties | ||||||
|---|---|---|---|---|---|---|---|
| Quadrant | DetID | PixID | Counts | Sigma | Mean | Median | Sigma |
| A | 15 | 174 | 181020 | 711.81 | 1253 | 1228 | 252.6 |
| A | 1 | 113 | 53941 | 208.7 | 1253 | 1228 | 252.6 |
| A | 14 | 235 | 48185 | 185.91 | 1253 | 1228 | 252.6 |
| B | 10 | 245 | 198368 | 822.81 | 1248 | 1217 | 239.6 |
| B | 0 | 190 | 107760 | 444.66 | 1248 | 1217 | 239.6 |
| B | 3 | 209 | 50314 | 204.91 | 1248 | 1217 | 239.6 |
| C | 3 | 233 | 1363238 | 4800.84 | 1202 | 1208 | 283.7 |
| C | 14 | 238 | 213278 | 747.5 | 1202 | 1208 | 283.7 |
| C | 7 | 247 | 42586 | 145.85 | 1202 | 1208 | 283.7 |
| D | 1 | 52 | 2926487 | 10168.47 | 1195 | 1163 | 287.7 |
| D | 8 | 195 | 1290258 | 4480.91 | 1195 | 1163 | 287.7 |
| D | 7 | 80 | 204747 | 707.66 | 1195 | 1163 | 287.7 |
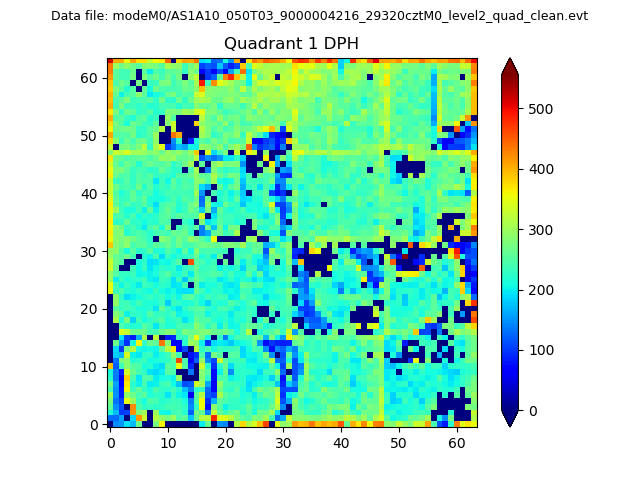
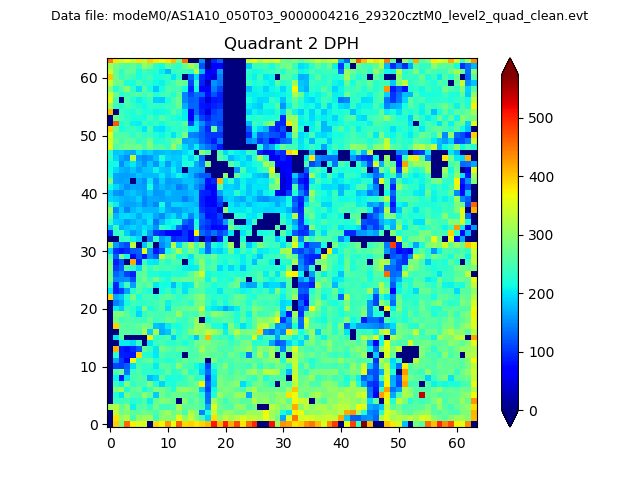
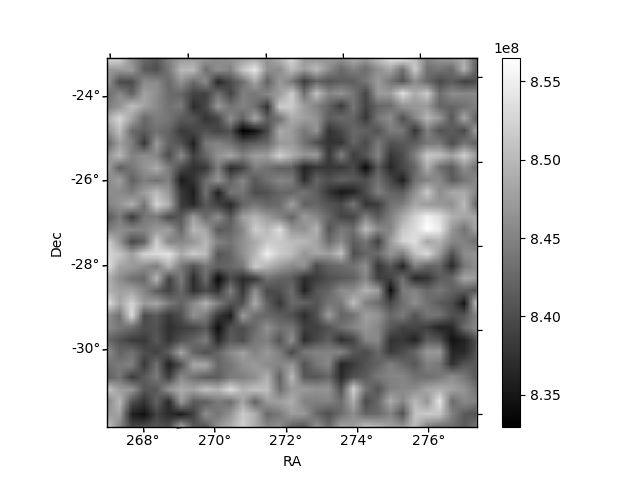
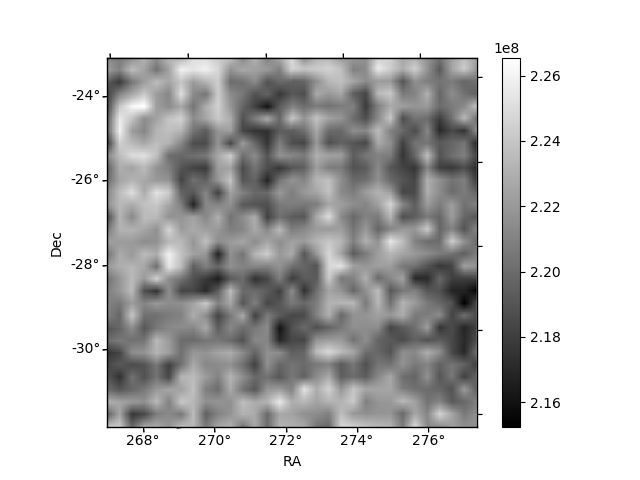
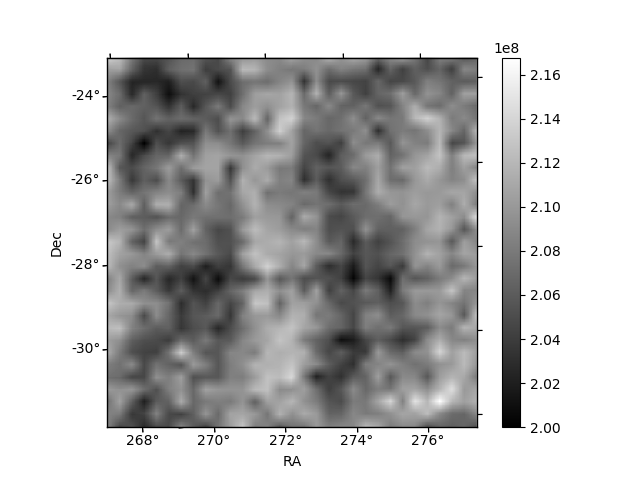
Histogram calculated using DETX and DETY for each event in the final _common_clean file
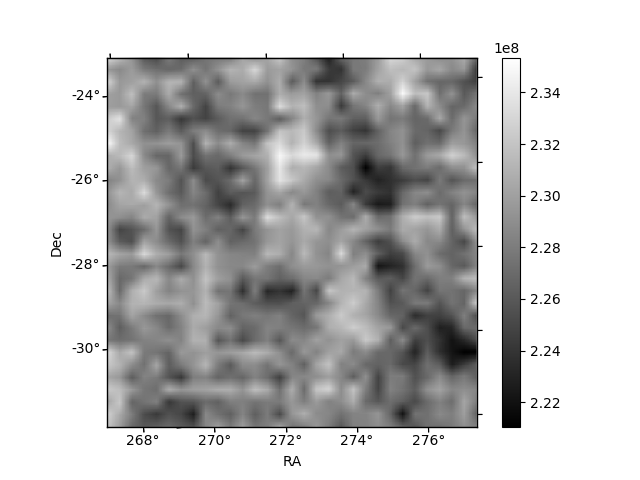
| Quadrant A |  |
 |
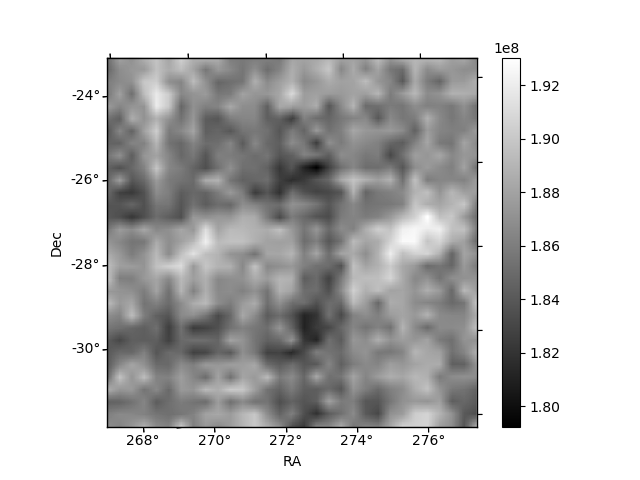
Quadrant B |
|---|---|---|---|
| Quadrant D | 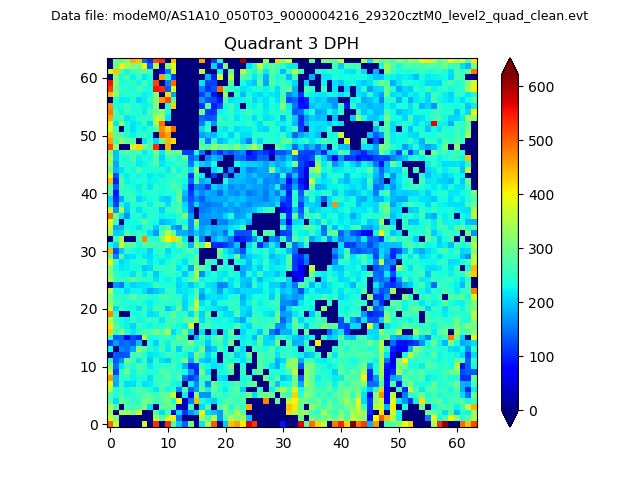 |
 |
Quadrant C |
| Plot type | Count rate plots | Images |
|---|---|---|
| Comparison with Poisson distribution Blue bars denote a histogram of data divided into 1 sec bins. Red curve is a Poisson curve with rate = median count rate of data. |
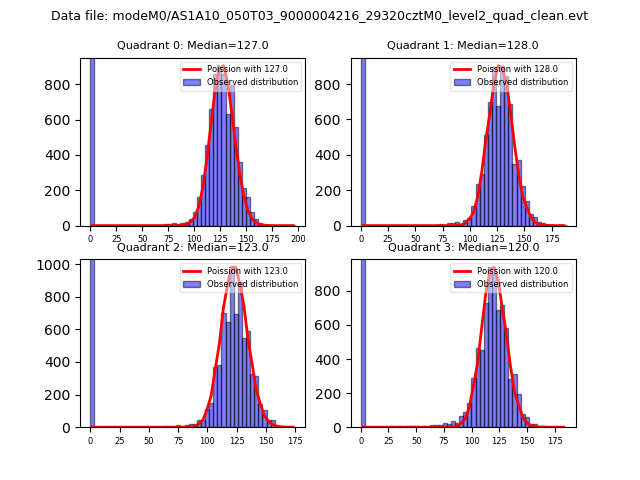 |
 |
| Quadrant-wise count rates Data is divided into 100 sec bins |
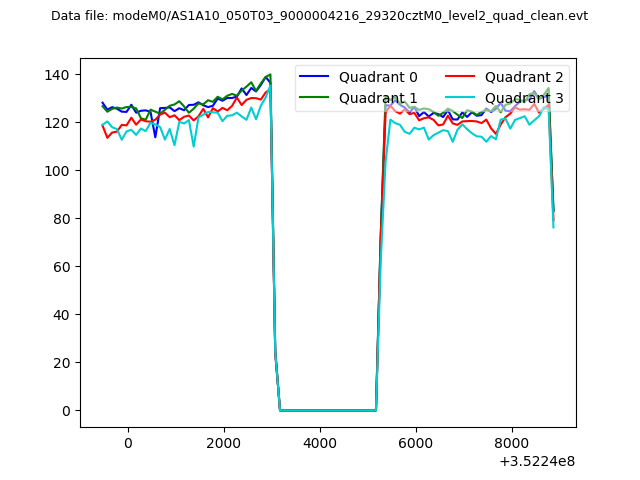 |
|
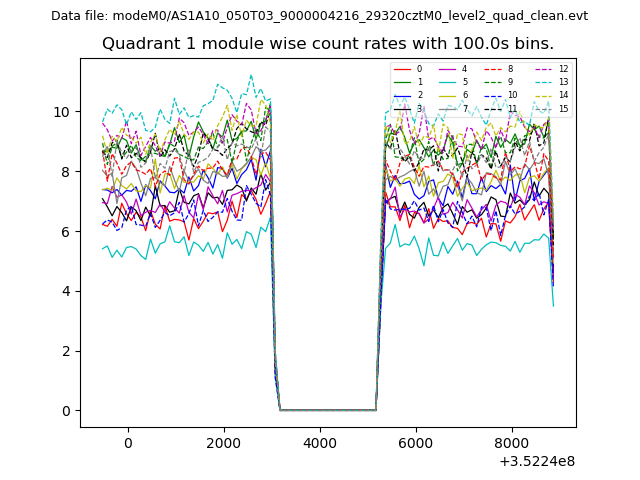
| Module-wise count rates for Quadrant A Data is divided into 100 sec bins |
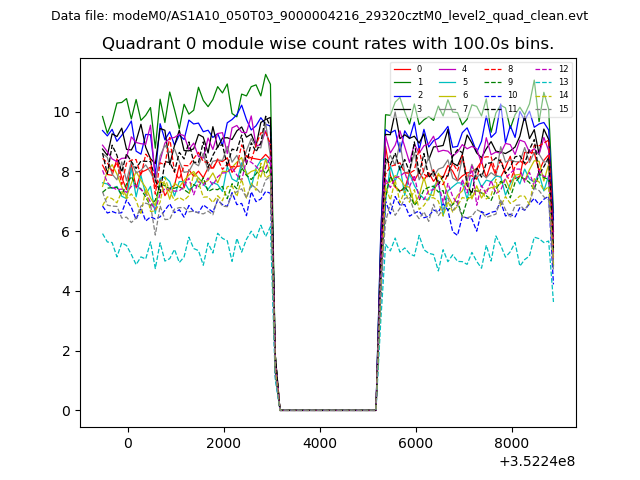 |
 |
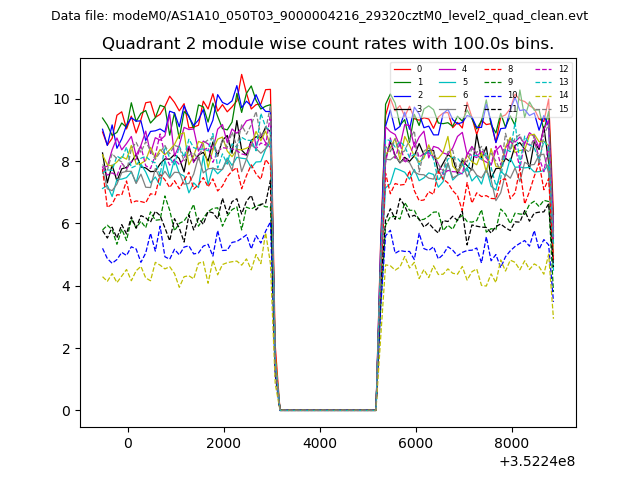
| Module-wise count rates for Quadrant B Data is divided into 100 sec bins |
 |
 |
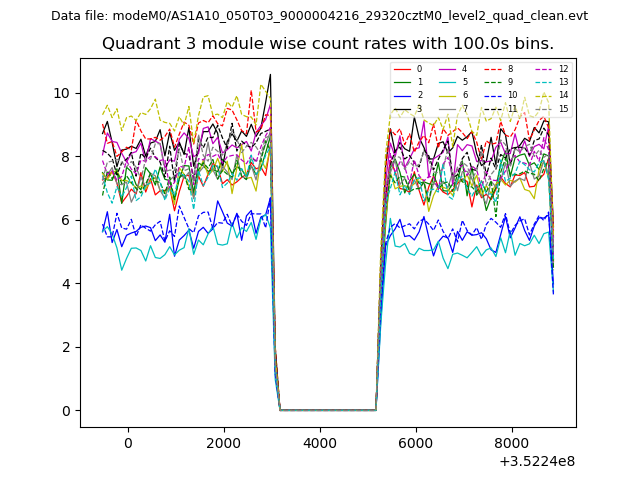
| Module-wise count rates for Quadrant C Data is divided into 100 sec bins |
 |
 |
| Module-wise count rates for Quadrant D Data is divided into 100 sec bins |
 |
 |
| Parameter | Plot |
|---|---|
| CZT HV Monitor | 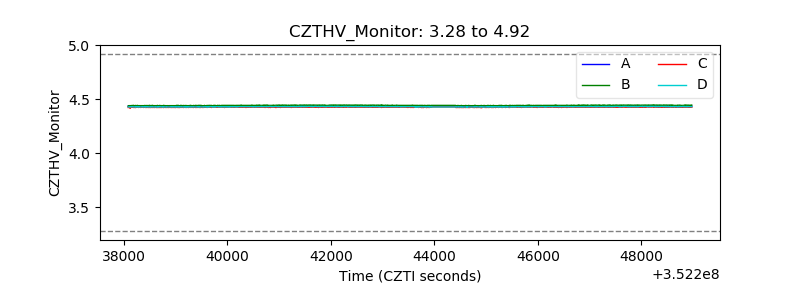 |
| D_VDD | 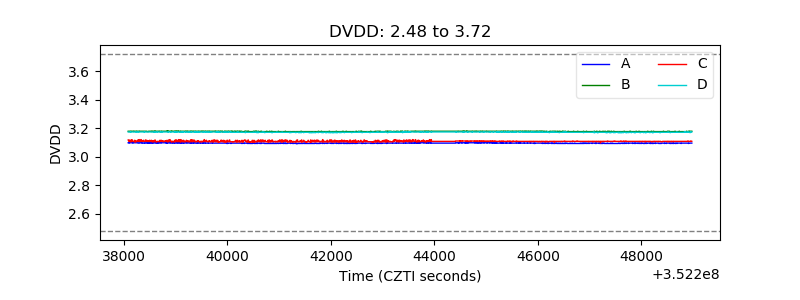 |
| Temperature 1 | 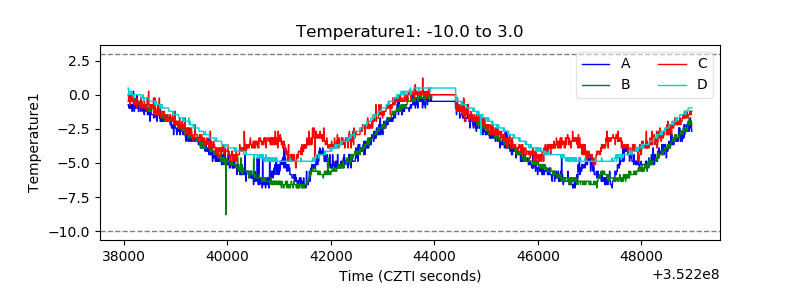 |
| Veto HV Monitor | 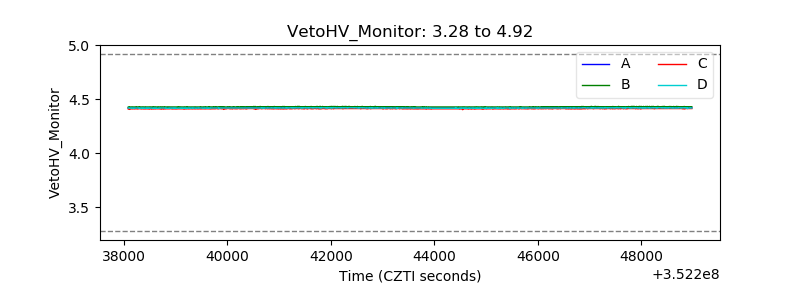 |
| Veto LLD | 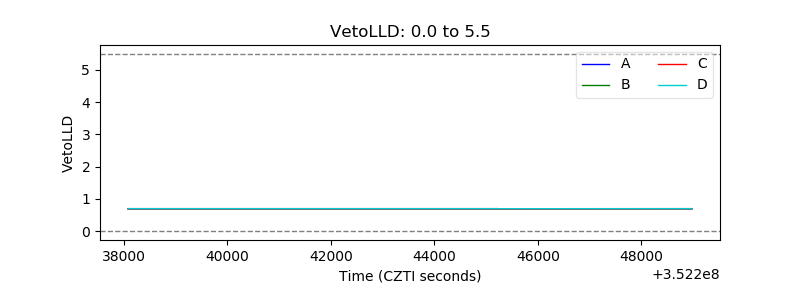 |
| Alpha Counter | 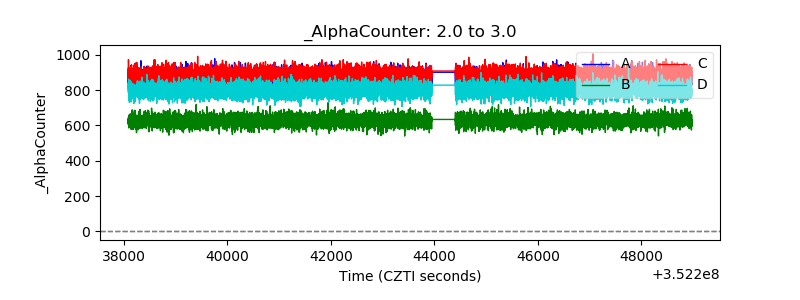 |
| _CPM_Rate |  |
| CZT Counter | 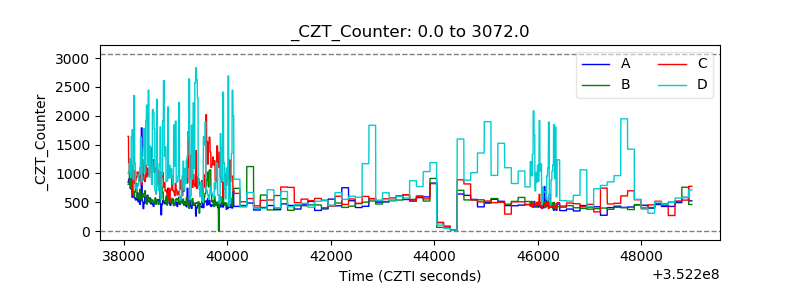 |
| +2.5 Volts monitor |  |
| +5 Volts monitor |  |
| _ROLL_ROT | 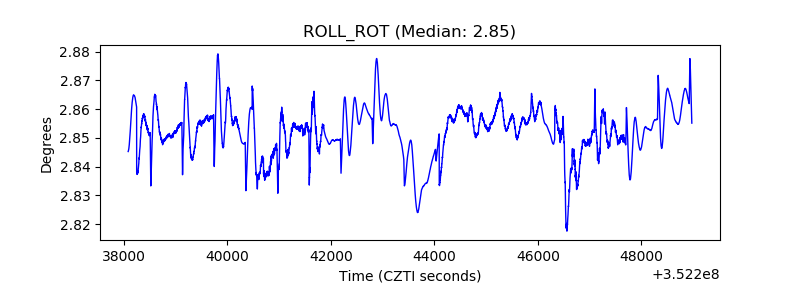 |
| _Roll_DEC | 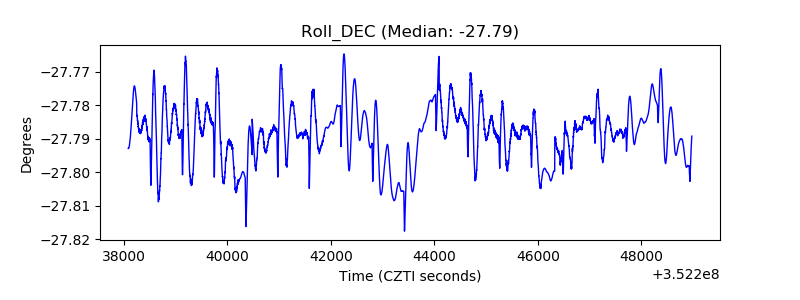 |
| _Roll_RA | 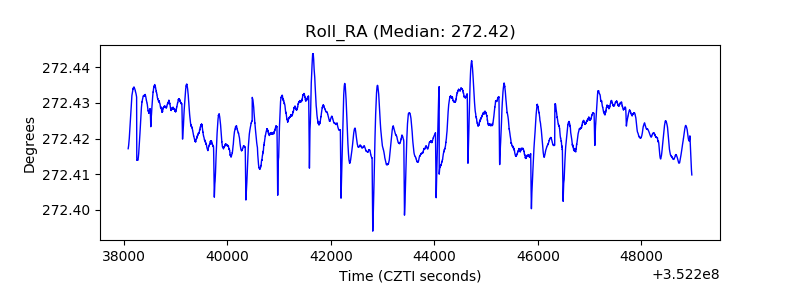 |
| Veto Counter | 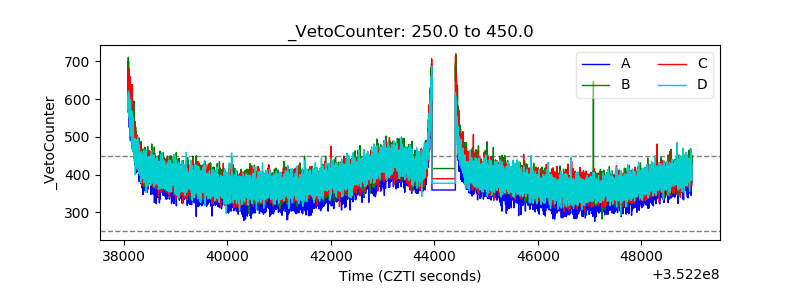 |