| Param | Original file | Final file |
|---|---|---|
| Filename | modeM0/AS1A10_050T03_9000004216_29321cztM0_level2.evt | modeM0/AS1A10_050T03_9000004216_29321cztM0_level2_quad_clean.evt |
| Size (bytes) | 1,164,231,360 | 177,877,440 |
| Size | 1.1 GB | 169.6 MB |
| Events in quadrant A | 6,646,976 | 1,151,987 |
| Events in quadrant B | 9,624,022 | 1,080,504 |
| Events in quadrant C | 8,020,113 | 1,129,990 |
| Events in quadrant D | 10,048,346 | 1,083,921 |
| Mode M9 | |||
|---|---|---|---|
| Quadrant | BADHDUFLAG | Total packets | Discarded packets |
| A | 0 | 24 | 0 |
| B | 0 | 24 | 0 |
| C | 0 | 24 | 0 |
| D | 0 | 24 | 0 |
| Mode SS | |||
|---|---|---|---|
| Quadrant | BADHDUFLAG | Total packets | Discarded packets |
| A | 0 | 280 | 0 |
| B | 0 | 280 | 0 |
| C | 0 | 280 | 0 |
| D | 0 | 280 | 0 |
| Mode M0 | |||
|---|---|---|---|
| Quadrant | BADHDUFLAG | Total packets | Discarded packets |
| A | 0 | 28254 | 3 |
| B | 0 | 37629 | 3 |
| C | 0 | 32675 | 3 |
| D | 0 | 39200 | 3 |
| Quadrant | Total seconds | Saturated seconds | Saturation percentage |
|---|---|---|---|
| A | 13612 | 59 | 0.433441% |
| B | 13612 | 1282 | 9.418160% |
| C | 13613 | 356 | 2.615147% |
| D | 13613 | 633 | 4.649967% |
Noise dominated data is calculated using 1-second bins in cleaned event files. If a bin has >2000 counts, and if more than 50% of those come from <1% of pixels, then it is considered to be noise-dominated and hence unusable.
| Quadrant | # 1 sec bins | Bins with >0 counts | Bins with >2000 counts | High rate bins dominated by noise | Noise dominated (total time) | Noise dominated (detector-on time) | Marked lightcurve |
|---|---|---|---|---|---|---|---|
| A | 16047 | 13615 | 5 | 5 | 0.03% | 0.04% | 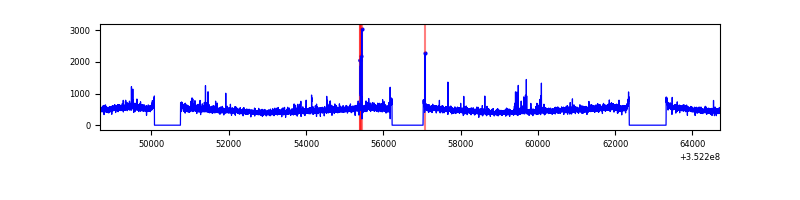 |
| B | 16047 | 13614 | 864 | 864 | 5.38% | 6.35% | 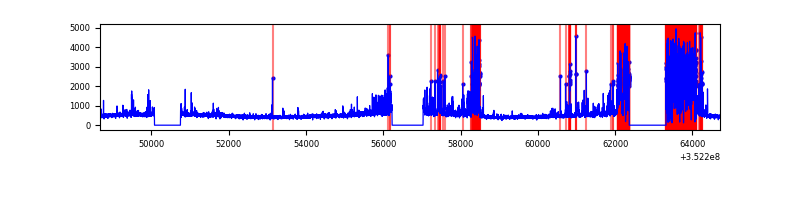 |
| C | 16048 | 13616 | 6 | 6 | 0.04% | 0.04% | 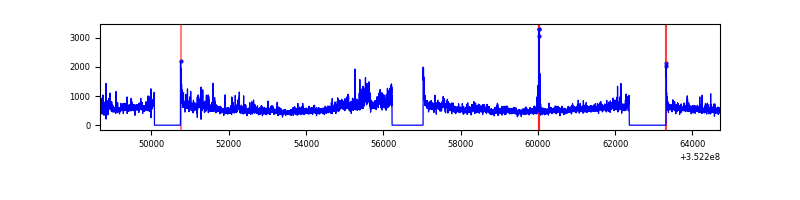 |
| D | 16048 | 13616 | 431 | 431 | 2.69% | 3.17% | 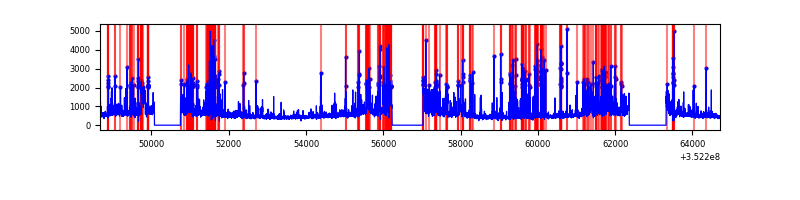 |
Top three noisy pixels from each quadrant. If the there are fewer than three noisy pixels in the level2.evt file, extra rows are filled as -1
| Pixel properties | Quadrant properties | ||||||
|---|---|---|---|---|---|---|---|
| Quadrant | DetID | PixID | Counts | Sigma | Mean | Median | Sigma |
| A | 5 | 98 | 59897 | 171.86 | 1686 | 1650 | 338.9 |
| A | 15 | 174 | 41972 | 118.97 | 1686 | 1650 | 338.9 |
| A | 13 | 254 | 28934 | 80.5 | 1686 | 1650 | 338.9 |
| B | 10 | 245 | 2960926 | 9776.18 | 1589 | 1544 | 302.7 |
| B | 0 | 190 | 158096 | 517.16 | 1589 | 1544 | 302.7 |
| B | 5 | 172 | 88697 | 287.91 | 1589 | 1544 | 302.7 |
| C | 3 | 233 | 1236948 | 3247.71 | 1620 | 1634 | 380.4 |
| C | 14 | 238 | 290966 | 760.67 | 1620 | 1634 | 380.4 |
| C | 14 | 254 | 53033 | 135.13 | 1620 | 1634 | 380.4 |
| D | 8 | 195 | 1526071 | 3914.66 | 1619 | 1577 | 389.4 |
| D | 7 | 80 | 1127779 | 2891.91 | 1619 | 1577 | 389.4 |
| D | 1 | 52 | 639624 | 1638.4 | 1619 | 1577 | 389.4 |
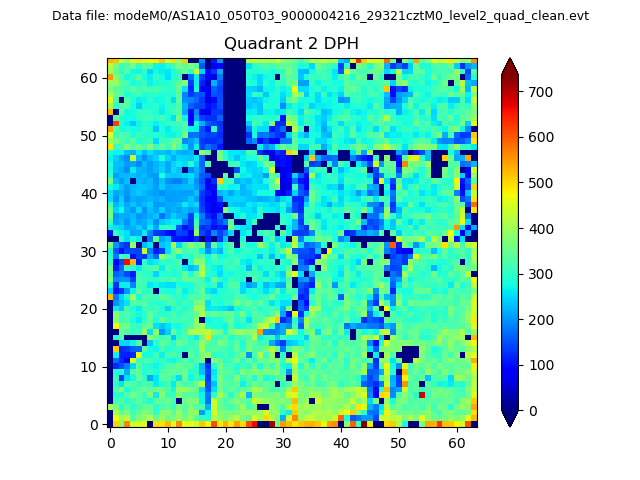
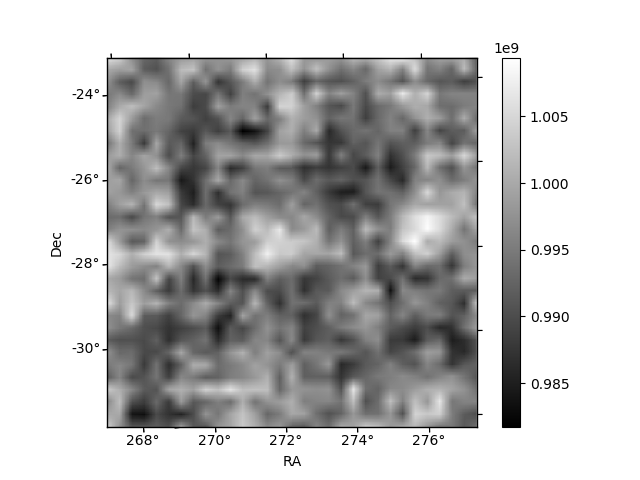
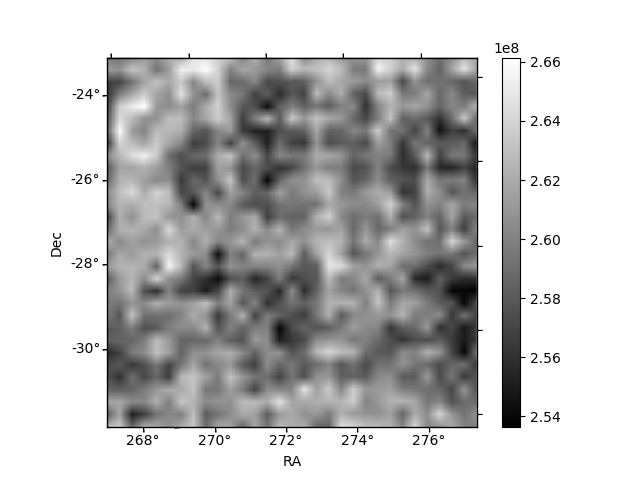
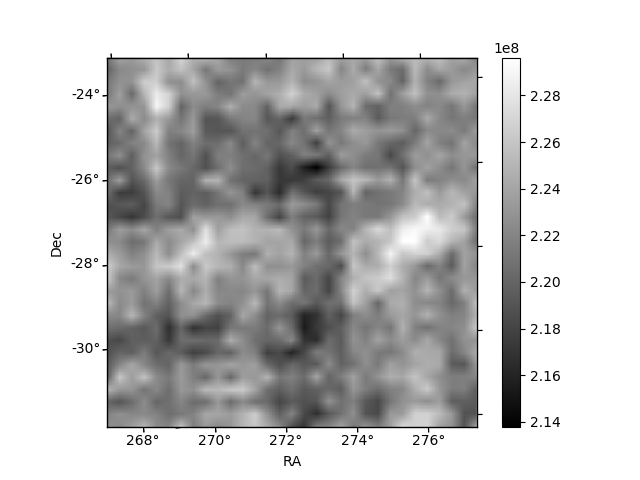
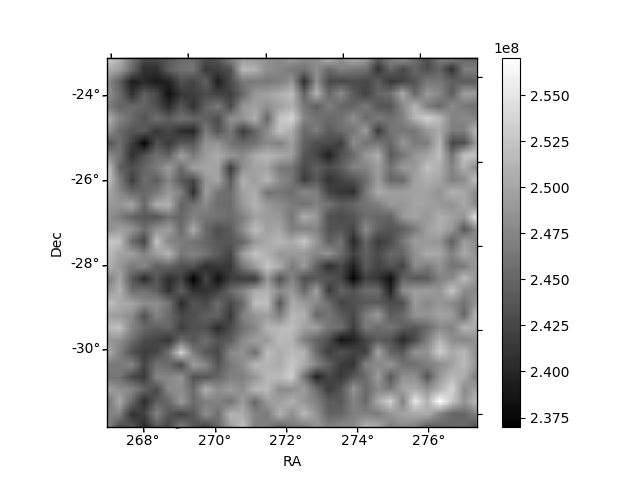
Histogram calculated using DETX and DETY for each event in the final _common_clean file
| Quadrant A | 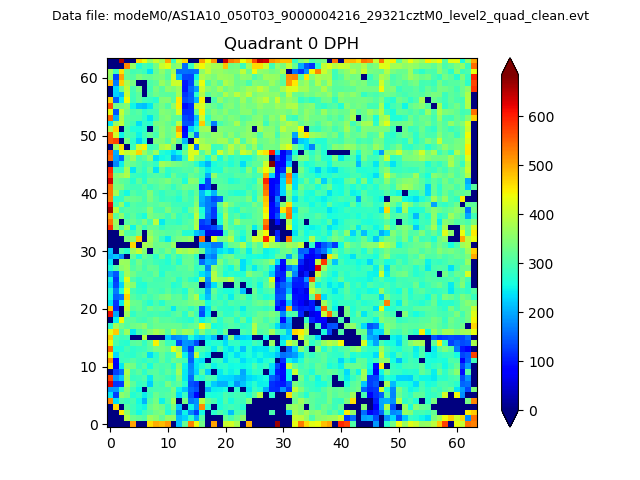 |
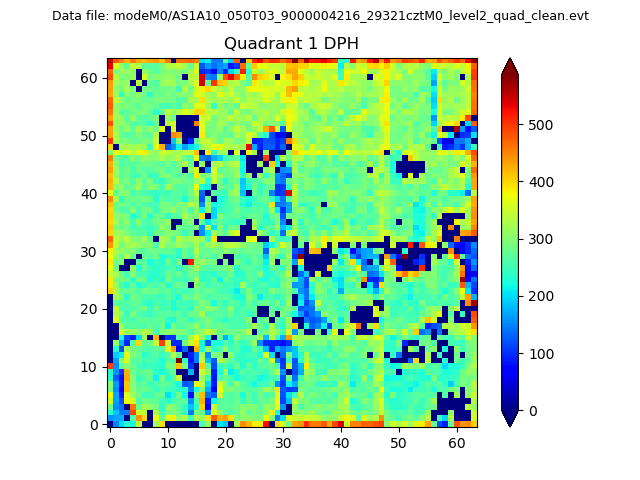 |
Quadrant B |
|---|---|---|---|
| Quadrant D | 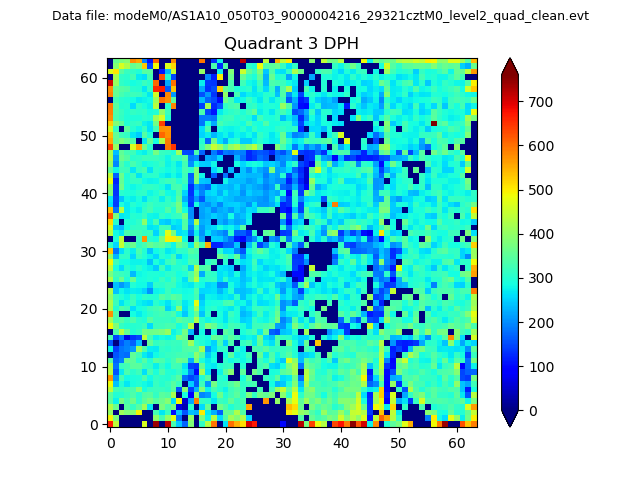 |
 |
Quadrant C |
| Plot type | Count rate plots | Images |
|---|---|---|
| Comparison with Poisson distribution Blue bars denote a histogram of data divided into 1 sec bins. Red curve is a Poisson curve with rate = median count rate of data. |
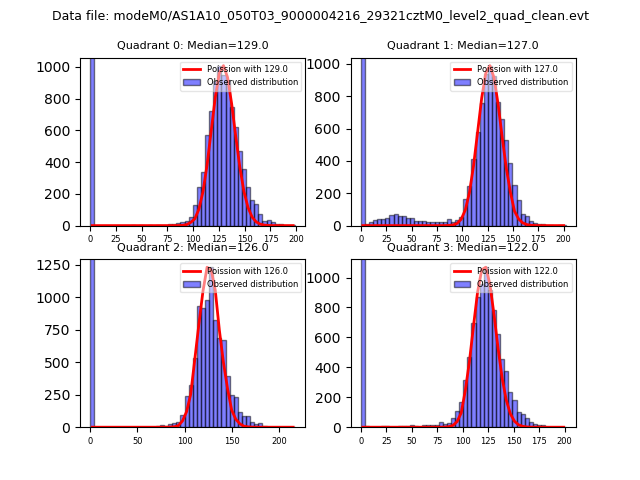 |
 |
| Quadrant-wise count rates Data is divided into 100 sec bins |
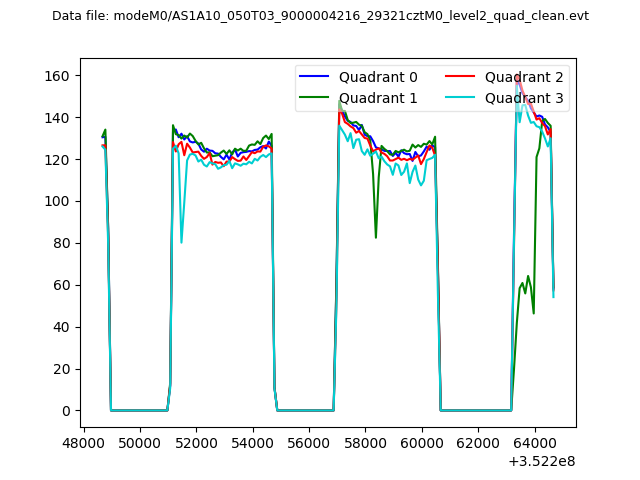 |
|
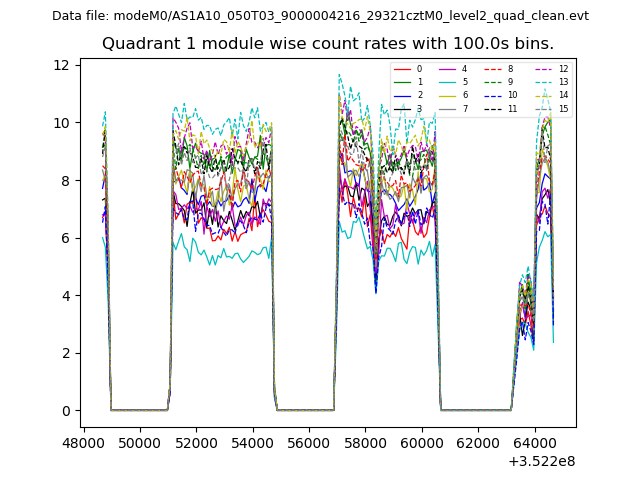
| Module-wise count rates for Quadrant A Data is divided into 100 sec bins |
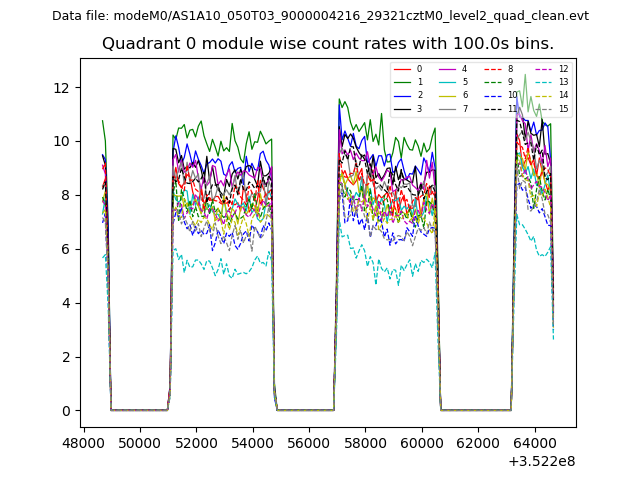 |
 |
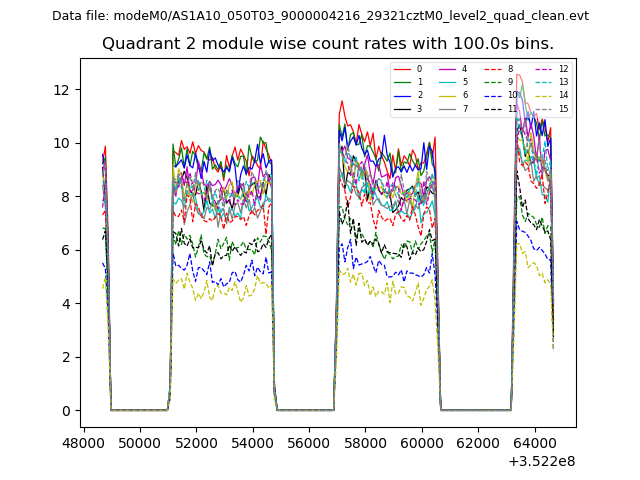
| Module-wise count rates for Quadrant B Data is divided into 100 sec bins |
 |
 |
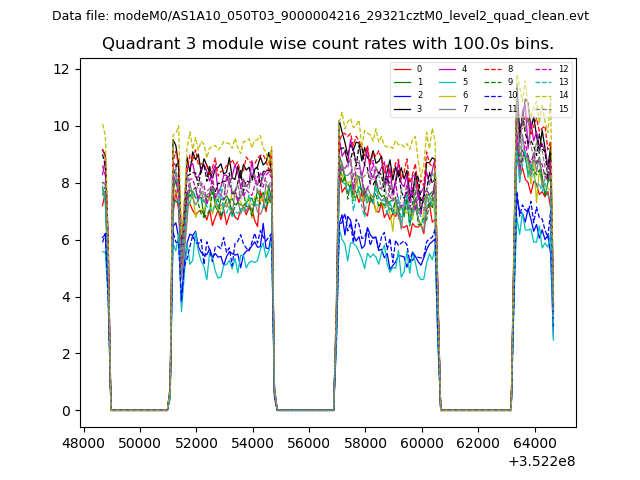
| Module-wise count rates for Quadrant C Data is divided into 100 sec bins |
 |
 |
| Module-wise count rates for Quadrant D Data is divided into 100 sec bins |
 |
 |
| Parameter | Plot |
|---|---|
| CZT HV Monitor | 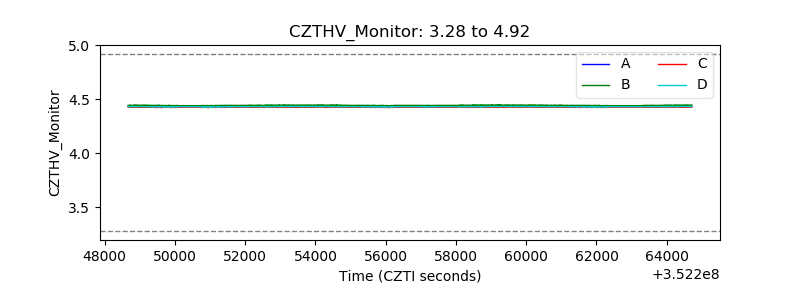 |
| D_VDD | 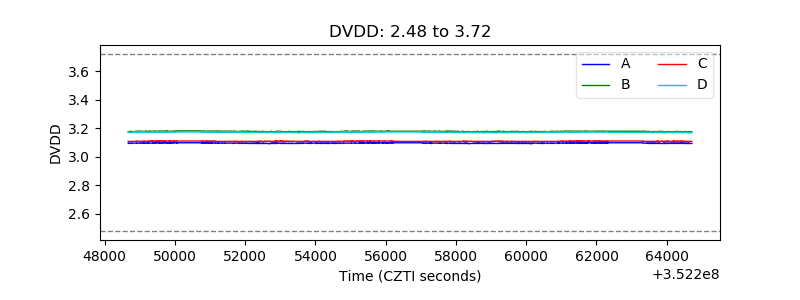 |
| Temperature 1 | 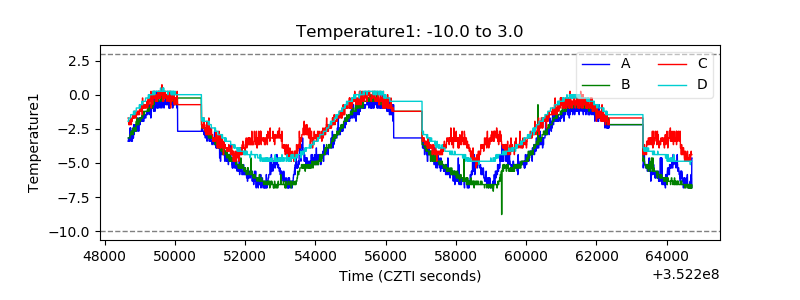 |
| Veto HV Monitor |  |
| Veto LLD |  |
| Alpha Counter |  |
| _CPM_Rate | 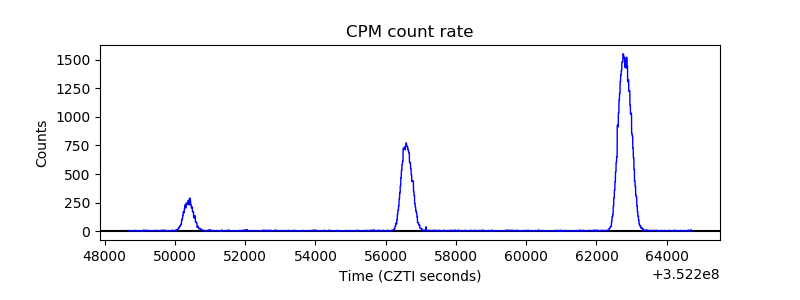 |
| CZT Counter | 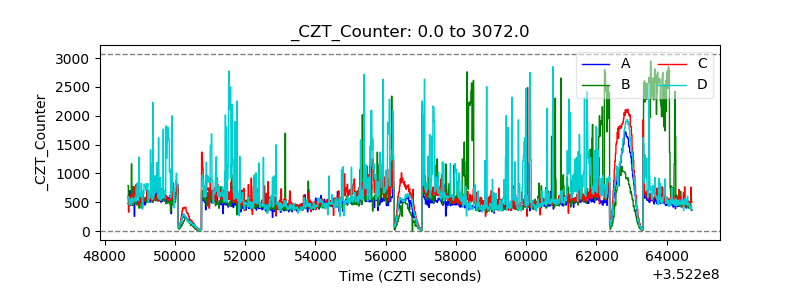 |
| +2.5 Volts monitor |  |
| +5 Volts monitor |  |
| _ROLL_ROT | 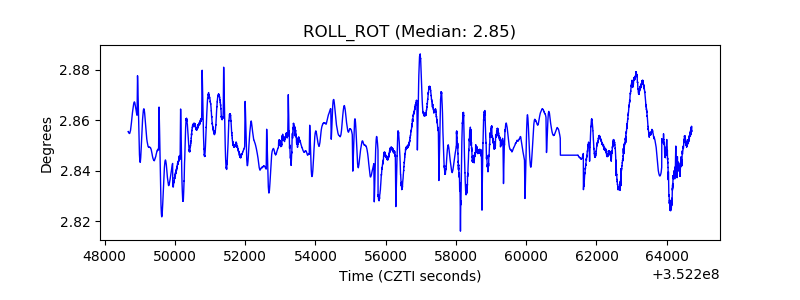 |
| _Roll_DEC | 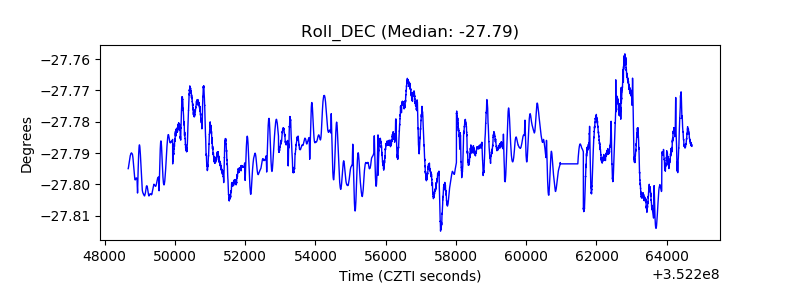 |
| _Roll_RA | 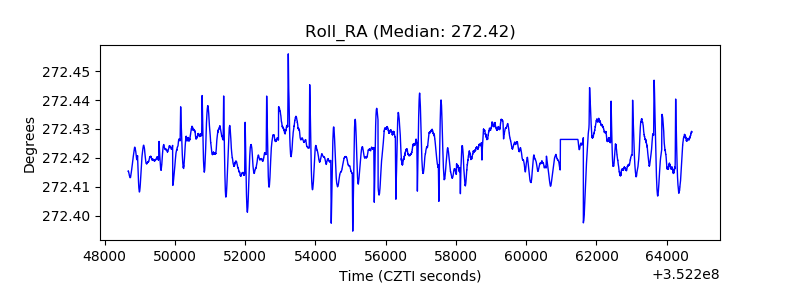 |
| Veto Counter | 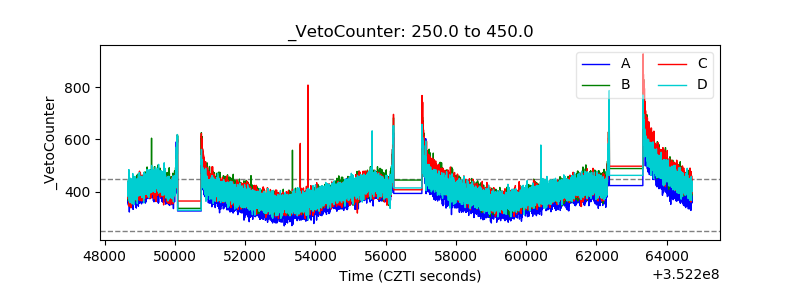 |