| Param | Original file | Final file |
|---|---|---|
| Filename | modeM0/AS1A10_050T03_9000004216_29324cztM0_level2.evt | modeM0/AS1A10_050T03_9000004216_29324cztM0_level2_quad_clean.evt |
| Size (bytes) | 672,413,760 | 91,895,040 |
| Size | 641.3 MB | 87.6 MB |
| Events in quadrant A | 3,140,955 | 615,116 |
| Events in quadrant B | 4,430,174 | 617,531 |
| Events in quadrant C | 3,366,187 | 604,605 |
| Events in quadrant D | 9,003,208 | 508,809 |
| Mode M9 | |||
|---|---|---|---|
| Quadrant | BADHDUFLAG | Total packets | Discarded packets |
| A | 0 | 12 | 0 |
| B | 0 | 12 | 0 |
| C | 0 | 12 | 0 |
| D | 0 | 12 | 0 |
| Mode SS | |||
|---|---|---|---|
| Quadrant | BADHDUFLAG | Total packets | Discarded packets |
| A | 0 | 126 | 0 |
| B | 0 | 126 | 0 |
| C | 0 | 126 | 0 |
| D | 0 | 126 | 0 |
| Mode M0 | |||
|---|---|---|---|
| Quadrant | BADHDUFLAG | Total packets | Discarded packets |
| A | 0 | 13037 | 1 |
| B | 0 | 17253 | 1 |
| C | 0 | 13757 | 1 |
| D | 0 | 30829 | 1 |
| Quadrant | Total seconds | Saturated seconds | Saturation percentage |
|---|---|---|---|
| A | 6258 | 27 | 0.431448% |
| B | 6259 | 478 | 7.637003% |
| C | 6259 | 76 | 1.214251% |
| D | 6259 | 2731 | 43.633168% |
Noise dominated data is calculated using 1-second bins in cleaned event files. If a bin has >2000 counts, and if more than 50% of those come from <1% of pixels, then it is considered to be noise-dominated and hence unusable.
| Quadrant | # 1 sec bins | Bins with >0 counts | Bins with >2000 counts | High rate bins dominated by noise | Noise dominated (total time) | Noise dominated (detector-on time) | Marked lightcurve |
|---|---|---|---|---|---|---|---|
| A | 7433 | 6259 | 0 | 0 | 0.00% | 0.00% | 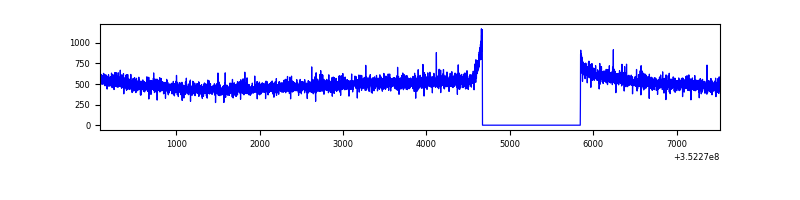 |
| B | 7434 | 6260 | 248 | 248 | 3.34% | 3.96% | 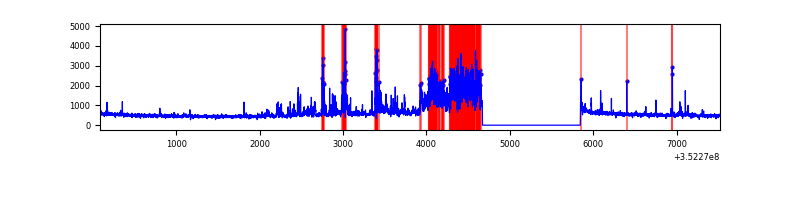 |
| C | 7434 | 6260 | 0 | 0 | 0.00% | 0.00% |  |
| D | 7434 | 6260 | 2395 | 2395 | 32.22% | 38.26% | 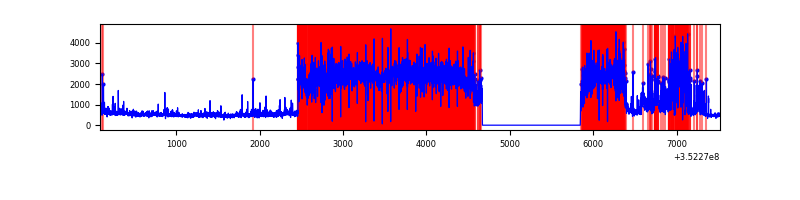 |
Top three noisy pixels from each quadrant. If the there are fewer than three noisy pixels in the level2.evt file, extra rows are filled as -1
| Pixel properties | Quadrant properties | ||||||
|---|---|---|---|---|---|---|---|
| Quadrant | DetID | PixID | Counts | Sigma | Mean | Median | Sigma |
| A | 13 | 254 | 13002 | 74.73 | 812 | 797 | 163.3 |
| A | 3 | 137 | 7206 | 39.24 | 812 | 797 | 163.3 |
| A | 0 | 226 | 6883 | 37.26 | 812 | 797 | 163.3 |
| B | 10 | 245 | 1131985 | 7677.11 | 784 | 766 | 147.3 |
| B | 0 | 190 | 149716 | 1010.86 | 784 | 766 | 147.3 |
| B | 5 | 255 | 38388 | 255.32 | 784 | 766 | 147.3 |
| C | 14 | 238 | 130237 | 701.01 | 789 | 796 | 184.6 |
| C | 3 | 233 | 125494 | 675.33 | 789 | 796 | 184.6 |
| C | 2 | 114 | 15431 | 79.26 | 789 | 796 | 184.6 |
| D | 12 | 33 | 6053444 | 42745.59 | 593 | 578 | 141.6 |
| D | 8 | 195 | 304539 | 2146.59 | 593 | 578 | 141.6 |
| D | 1 | 52 | 222975 | 1570.58 | 593 | 578 | 141.6 |
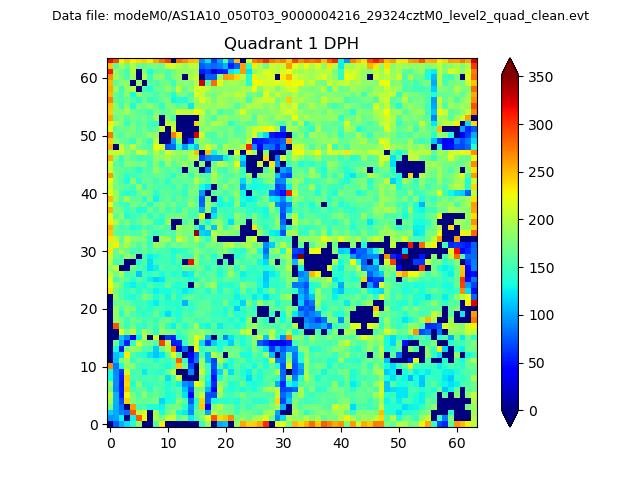
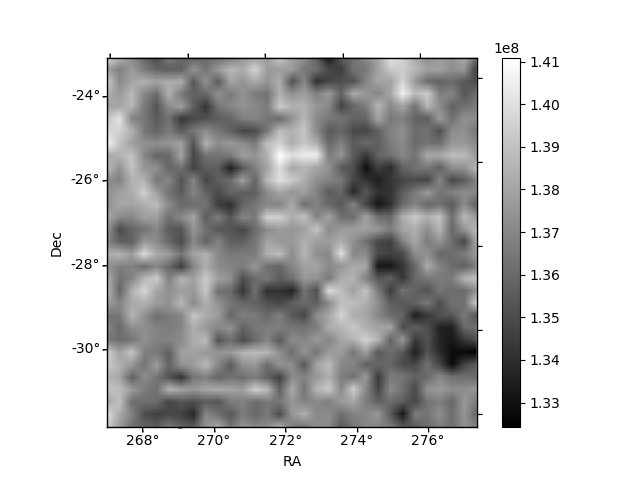
Histogram calculated using DETX and DETY for each event in the final _common_clean file
| Quadrant A | 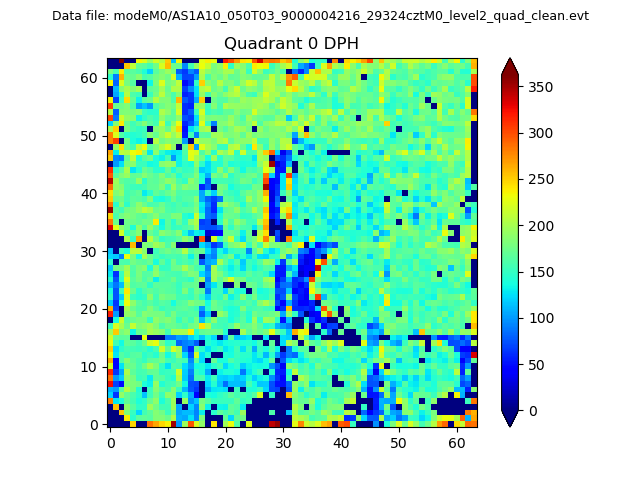 |
 |
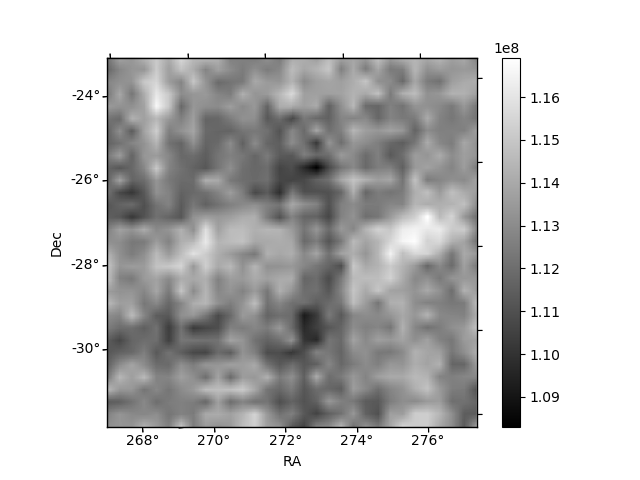
Quadrant B |
|---|---|---|---|
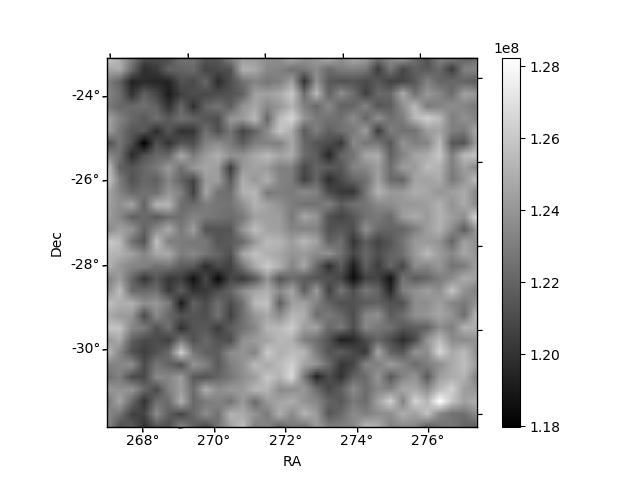
| Quadrant D | 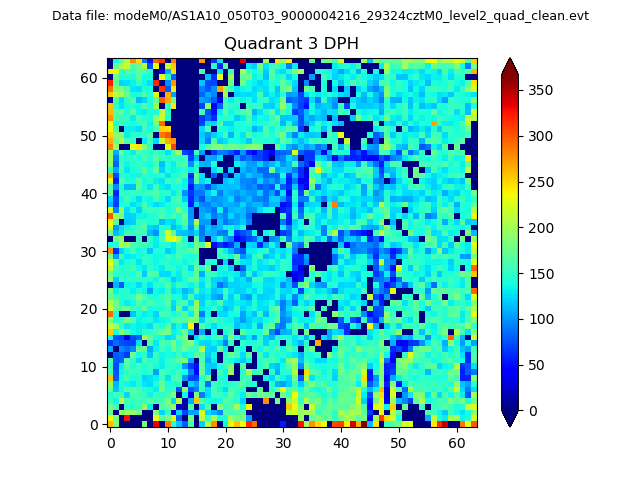 |
 |
Quadrant C |
| Plot type | Count rate plots | Images |
|---|---|---|
| Comparison with Poisson distribution Blue bars denote a histogram of data divided into 1 sec bins. Red curve is a Poisson curve with rate = median count rate of data. |
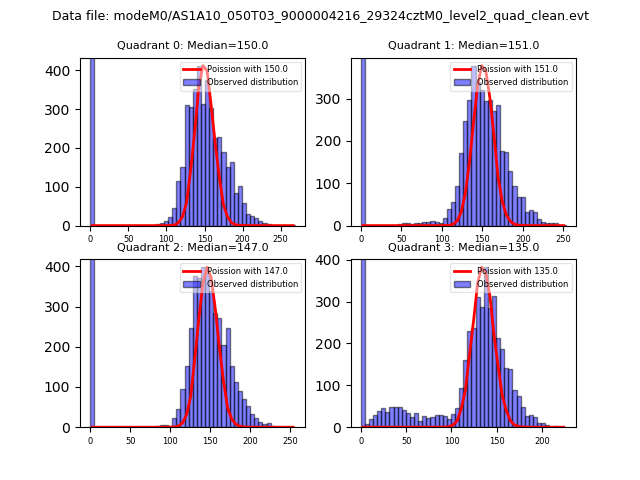 |
 |
| Quadrant-wise count rates Data is divided into 100 sec bins |
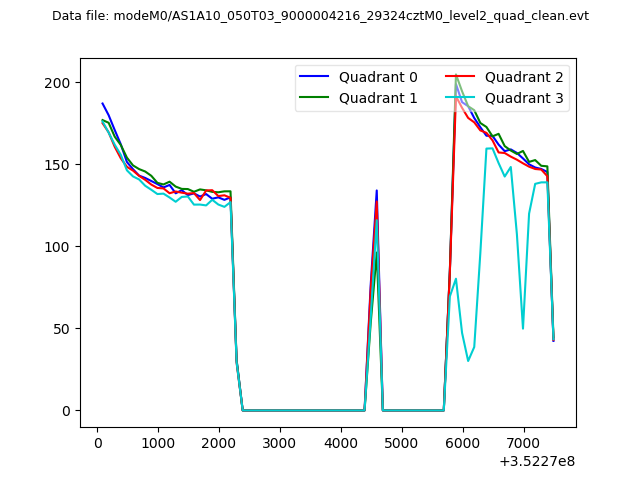 |
|
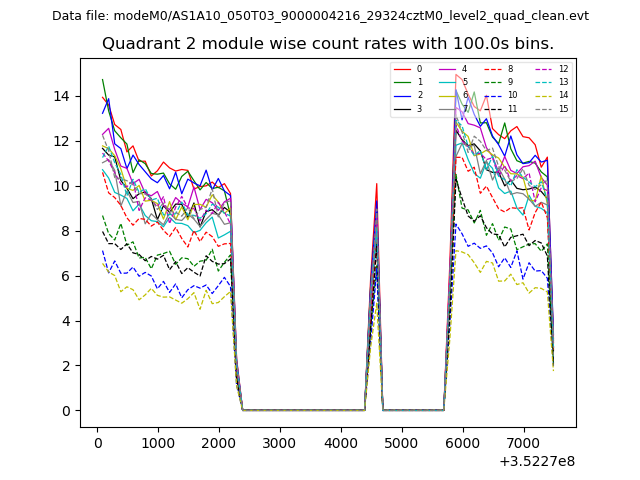
| Module-wise count rates for Quadrant A Data is divided into 100 sec bins |
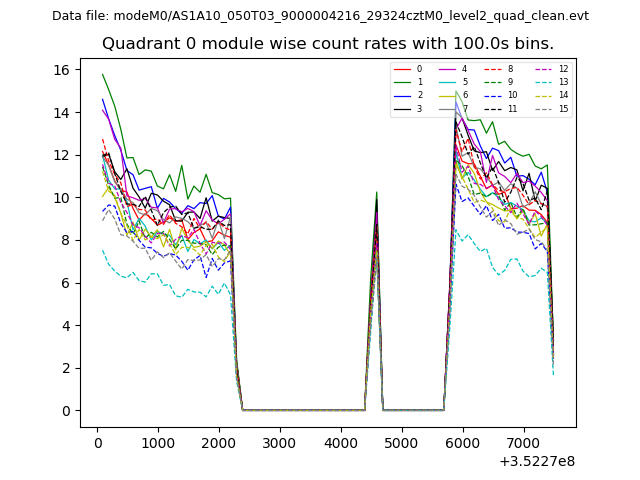 |
 |
| Module-wise count rates for Quadrant B Data is divided into 100 sec bins |
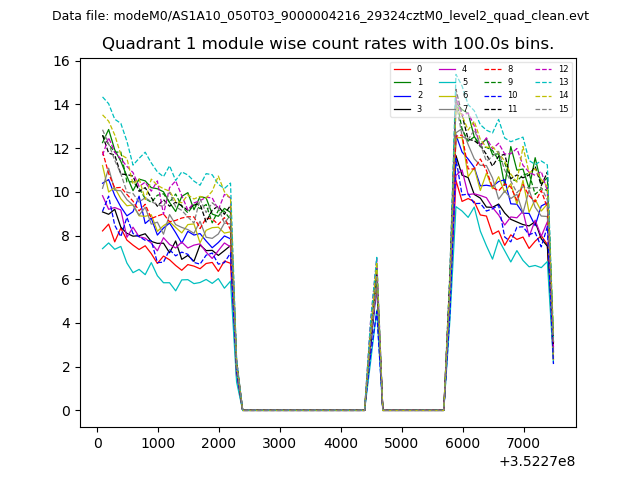 |
 |
| Module-wise count rates for Quadrant C Data is divided into 100 sec bins |
 |
 |
| Module-wise count rates for Quadrant D Data is divided into 100 sec bins |
 |
 |
| Parameter | Plot |
|---|---|
| CZT HV Monitor | 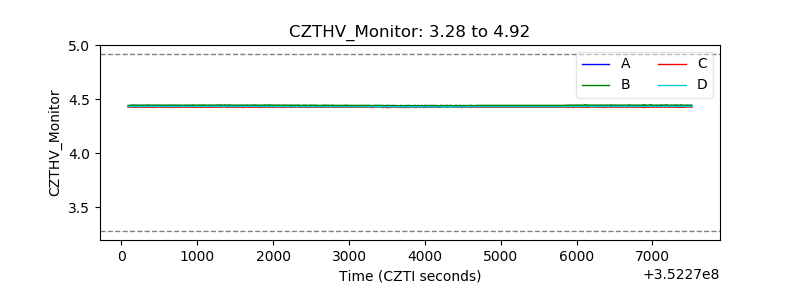 |
| D_VDD | 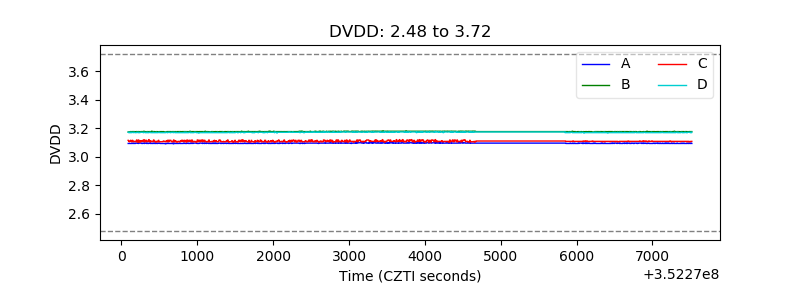 |
| Temperature 1 | 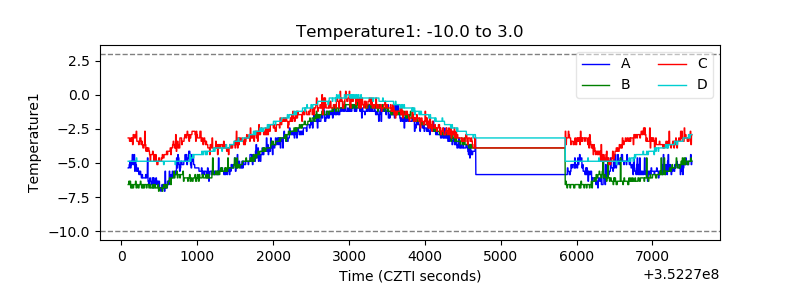 |
| Veto HV Monitor | 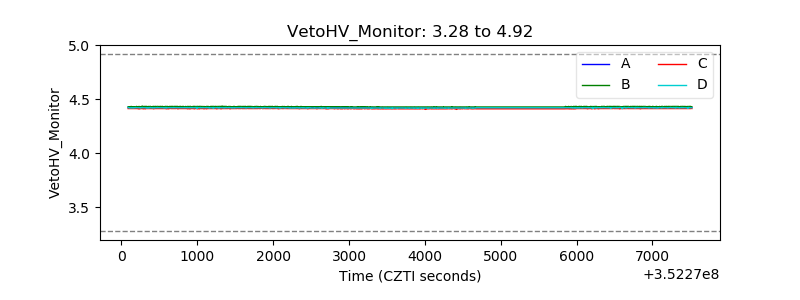 |
| Veto LLD | 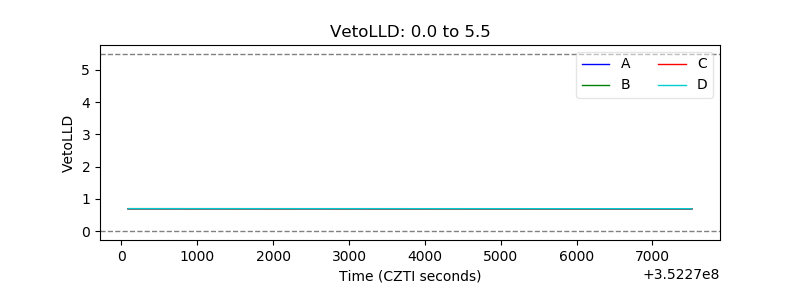 |
| Alpha Counter | 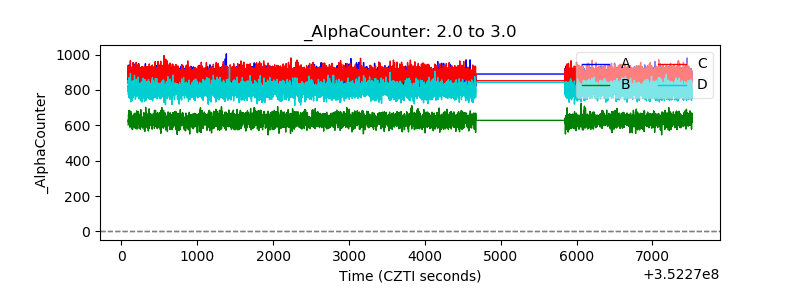 |
| _CPM_Rate | 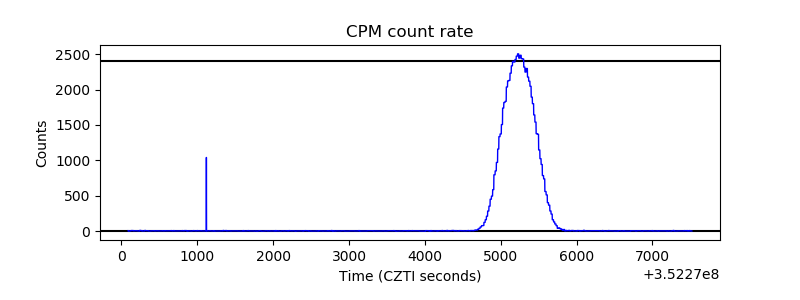 |
| CZT Counter |  |
| +2.5 Volts monitor |  |
| +5 Volts monitor | 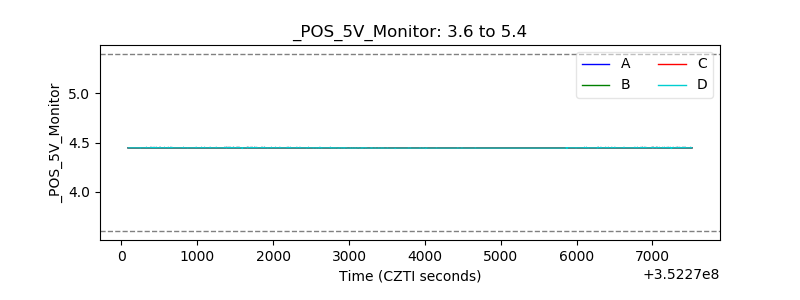 |
| _ROLL_ROT | 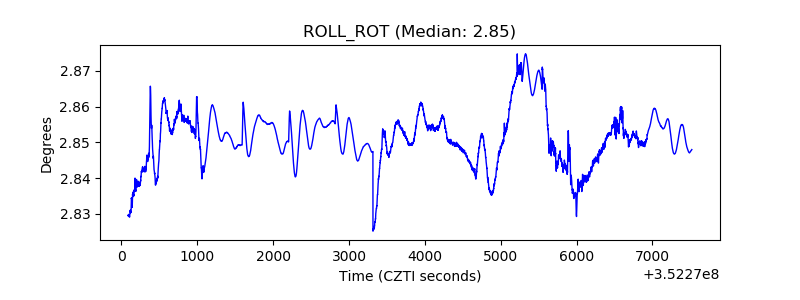 |
| _Roll_DEC | 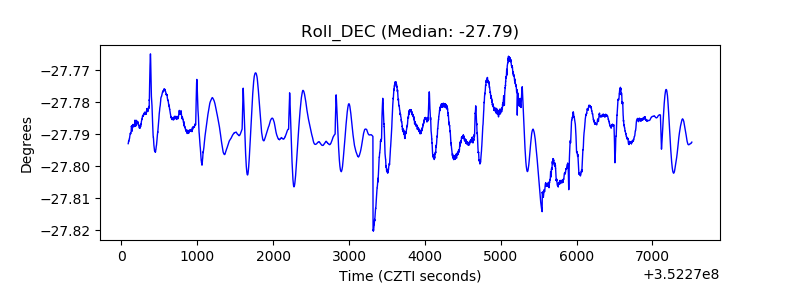 |
| _Roll_RA | 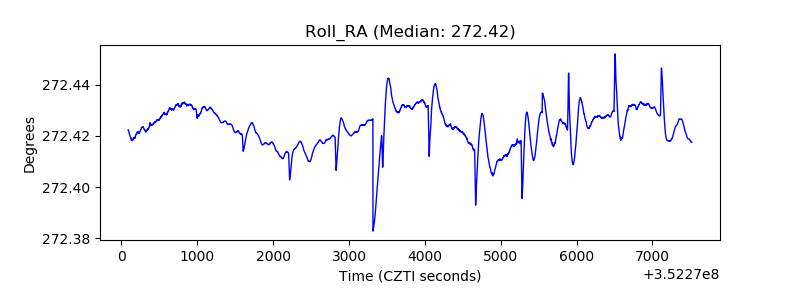 |
| Veto Counter | 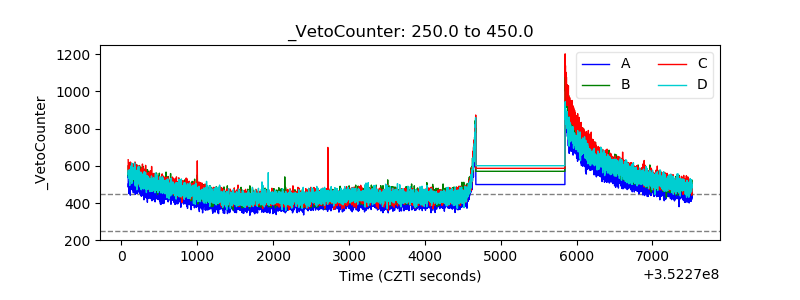 |