| Param | Original file | Final file |
|---|---|---|
| Filename | modeM0/AS1A10_050T03_9000004216_29326cztM0_level2.evt | modeM0/AS1A10_050T03_9000004216_29326cztM0_level2_quad_clean.evt |
| Size (bytes) | 735,744,960 | 78,209,280 |
| Size | 701.7 MB | 74.6 MB |
| Events in quadrant A | 2,992,415 | 554,220 |
| Events in quadrant B | 4,079,823 | 555,348 |
| Events in quadrant C | 3,587,722 | 529,071 |
| Events in quadrant D | 11,244,721 | 338,339 |
| Mode M9 | |||
|---|---|---|---|
| Quadrant | BADHDUFLAG | Total packets | Discarded packets |
| A | 0 | 13 | 0 |
| B | 0 | 13 | 0 |
| C | 0 | 13 | 0 |
| D | 0 | 13 | 0 |
| Mode SS | |||
|---|---|---|---|
| Quadrant | BADHDUFLAG | Total packets | Discarded packets |
| A | 0 | 114 | 0 |
| B | 0 | 114 | 0 |
| C | 0 | 114 | 0 |
| D | 0 | 114 | 0 |
| Mode M0 | |||
|---|---|---|---|
| Quadrant | BADHDUFLAG | Total packets | Discarded packets |
| A | 0 | 11952 | 1 |
| B | 0 | 15554 | 1 |
| C | 0 | 14586 | 1 |
| D | 0 | 37083 | 1 |
| Quadrant | Total seconds | Saturated seconds | Saturation percentage |
|---|---|---|---|
| A | 5578 | 40 | 0.717103% |
| B | 5578 | 393 | 7.045536% |
| C | 5579 | 92 | 1.649041% |
| D | 5579 | 3951 | 70.819143% |
Noise dominated data is calculated using 1-second bins in cleaned event files. If a bin has >2000 counts, and if more than 50% of those come from <1% of pixels, then it is considered to be noise-dominated and hence unusable.
| Quadrant | # 1 sec bins | Bins with >0 counts | Bins with >2000 counts | High rate bins dominated by noise | Noise dominated (total time) | Noise dominated (detector-on time) | Marked lightcurve |
|---|---|---|---|---|---|---|---|
| A | 6883 | 5579 | 0 | 0 | 0.00% | 0.00% | 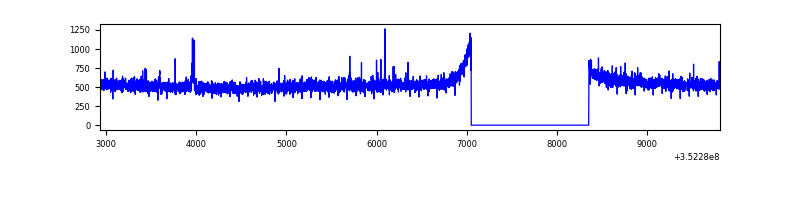 |
| B | 6883 | 5579 | 246 | 246 | 3.57% | 4.41% | 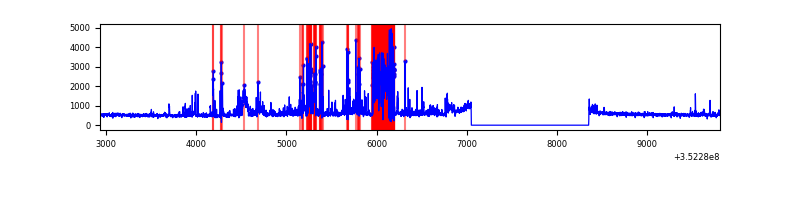 |
| C | 6884 | 5580 | 0 | 0 | 0.00% | 0.00% | 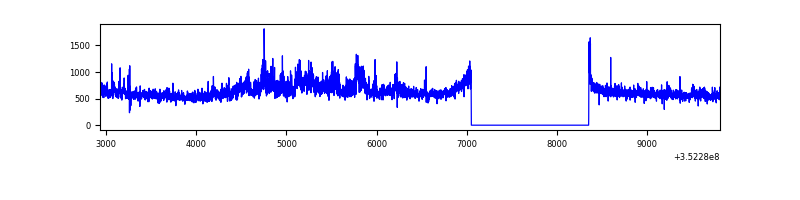 |
| D | 6884 | 5580 | 3644 | 3644 | 52.93% | 65.30% | 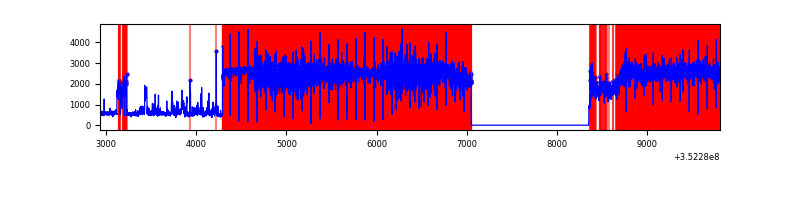 |
Top three noisy pixels from each quadrant. If the there are fewer than three noisy pixels in the level2.evt file, extra rows are filled as -1
| Pixel properties | Quadrant properties | ||||||
|---|---|---|---|---|---|---|---|
| Quadrant | DetID | PixID | Counts | Sigma | Mean | Median | Sigma |
| A | 0 | 13 | 14496 | 89.84 | 769 | 756 | 152.9 |
| A | 13 | 254 | 11245 | 68.58 | 769 | 756 | 152.9 |
| A | 0 | 226 | 6759 | 39.25 | 769 | 756 | 152.9 |
| B | 10 | 245 | 872637 | 6389.06 | 728 | 712 | 136.5 |
| B | 5 | 255 | 226040 | 1651.1 | 728 | 712 | 136.5 |
| B | 0 | 190 | 74142 | 538.06 | 728 | 712 | 136.5 |
| C | 3 | 233 | 486379 | 2850.21 | 731 | 737 | 170.4 |
| C | 14 | 238 | 120190 | 701.07 | 731 | 737 | 170.4 |
| C | 10 | 9 | 111271 | 648.72 | 731 | 737 | 170.4 |
| D | 12 | 33 | 8805966 | 82305.78 | 438 | 427 | 107.0 |
| D | 8 | 195 | 335151 | 3128.68 | 438 | 427 | 107.0 |
| D | 1 | 52 | 246047 | 2295.82 | 438 | 427 | 107.0 |
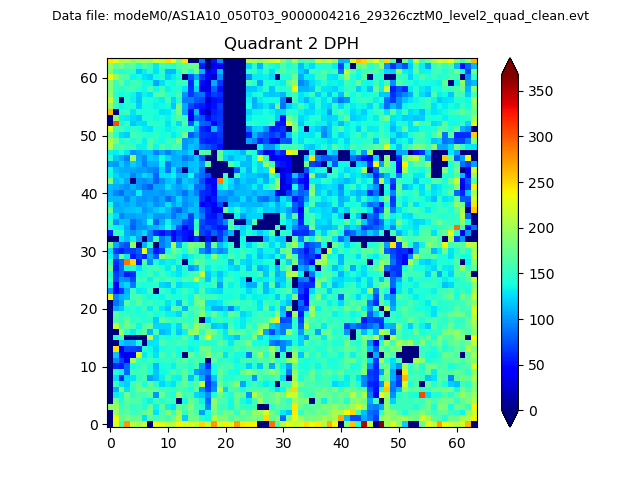
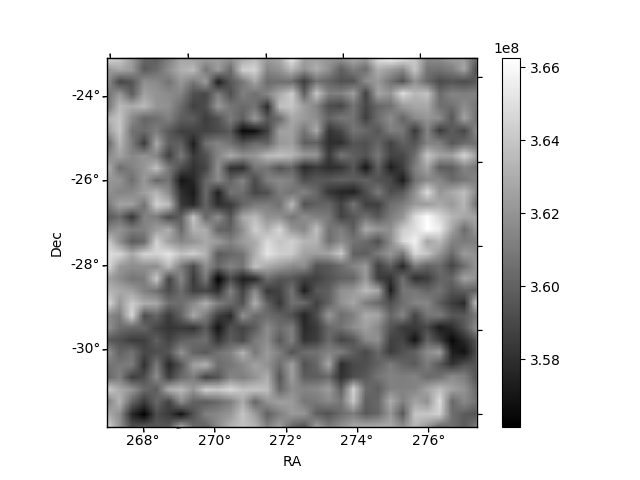
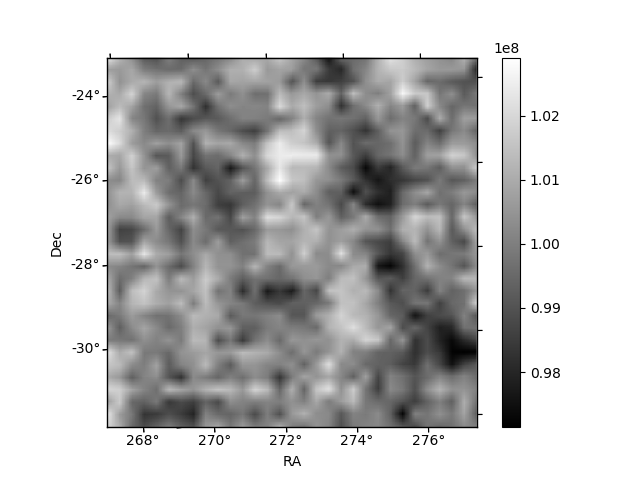
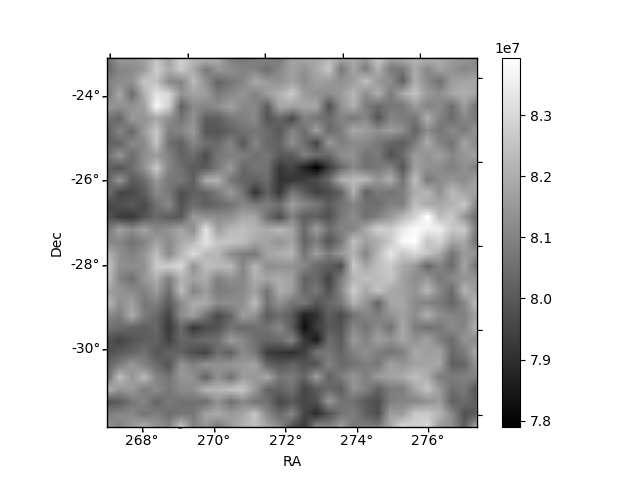
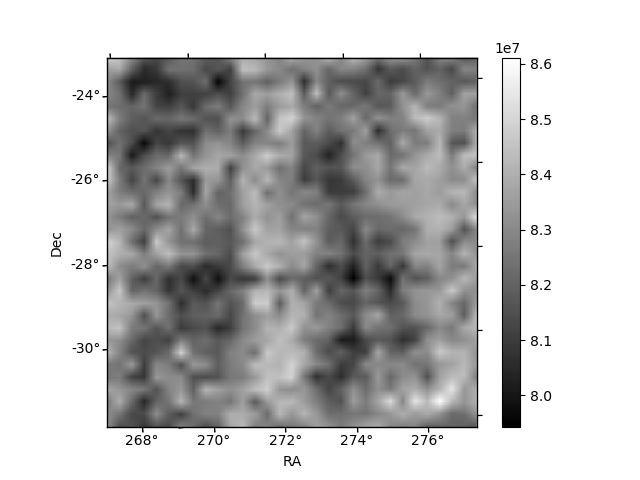
Histogram calculated using DETX and DETY for each event in the final _common_clean file
| Quadrant A | 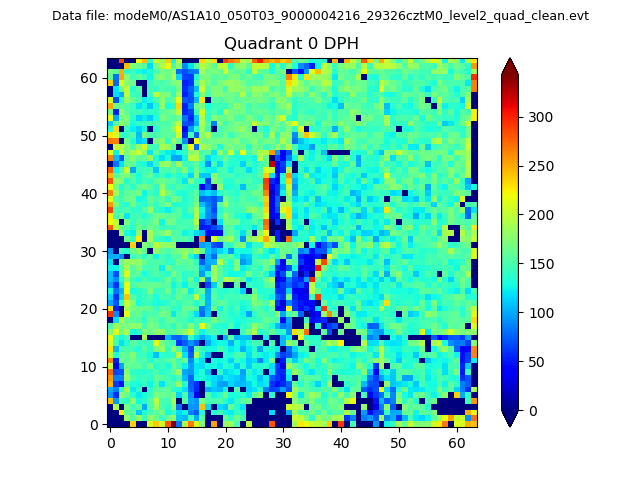 |
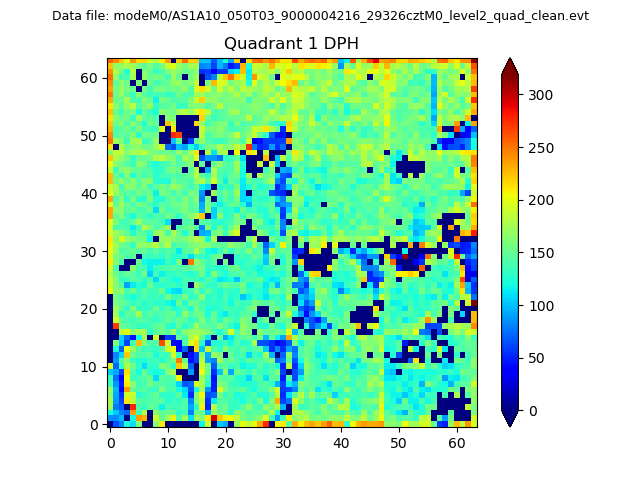 |
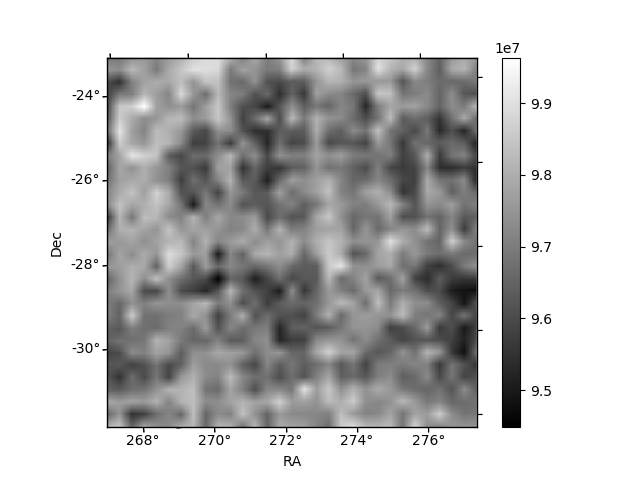
Quadrant B |
|---|---|---|---|
| Quadrant D | 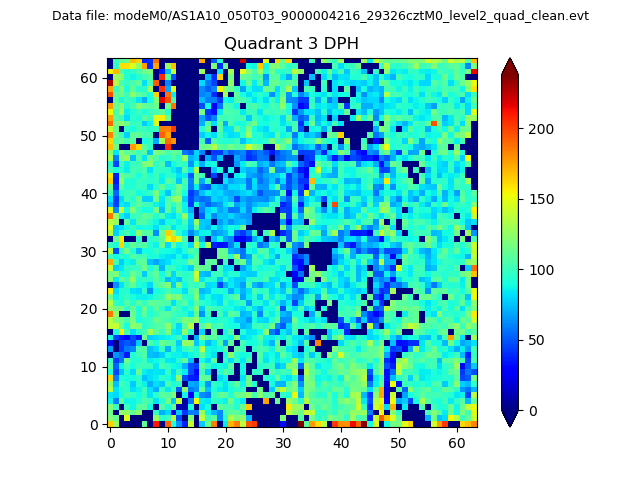 |
 |
Quadrant C |
| Plot type | Count rate plots | Images |
|---|---|---|
| Comparison with Poisson distribution Blue bars denote a histogram of data divided into 1 sec bins. Red curve is a Poisson curve with rate = median count rate of data. |
 |
 |
| Quadrant-wise count rates Data is divided into 100 sec bins |
 |
|
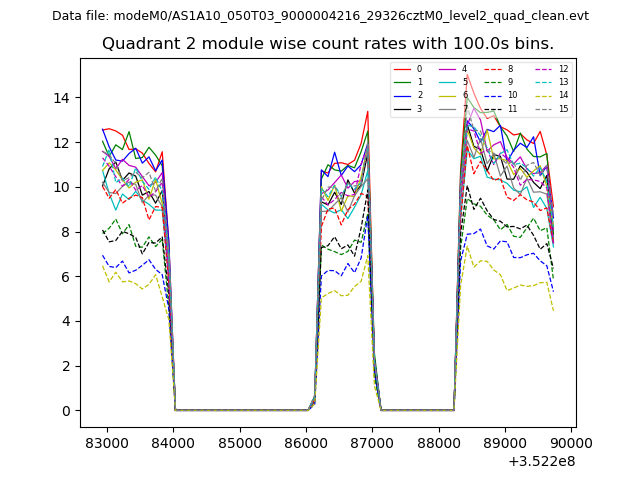
| Module-wise count rates for Quadrant A Data is divided into 100 sec bins |
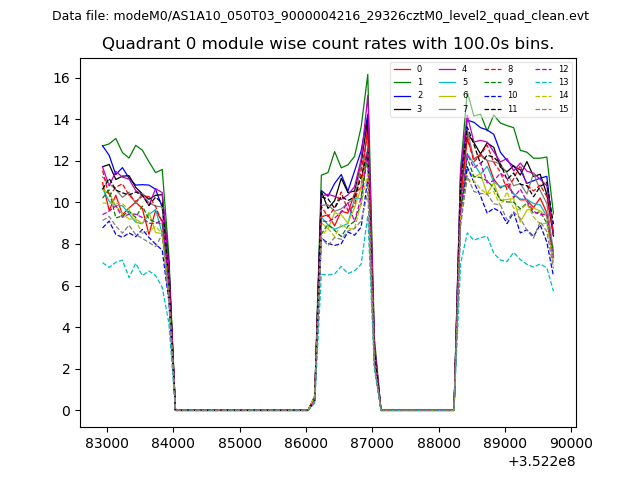 |
 |
| Module-wise count rates for Quadrant B Data is divided into 100 sec bins |
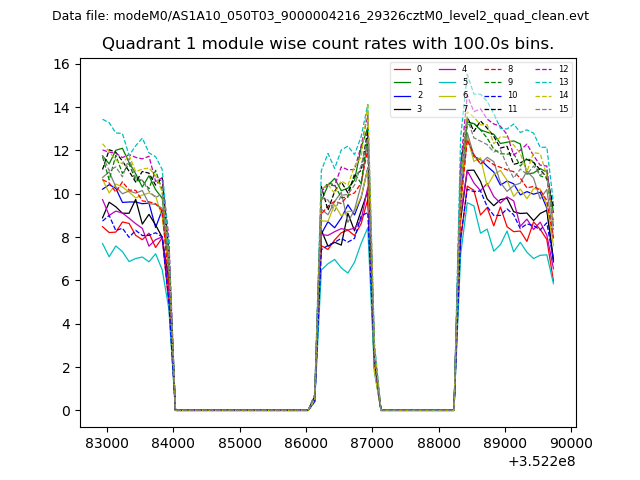 |
 |
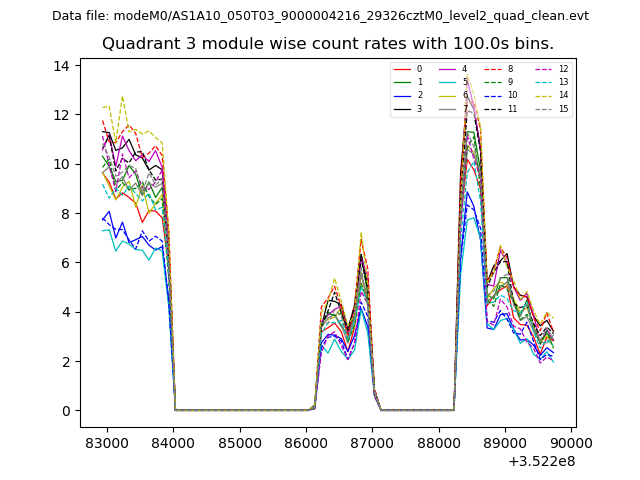
| Module-wise count rates for Quadrant C Data is divided into 100 sec bins |
 |
 |
| Module-wise count rates for Quadrant D Data is divided into 100 sec bins |
 |
 |
| Parameter | Plot |
|---|---|
| CZT HV Monitor | 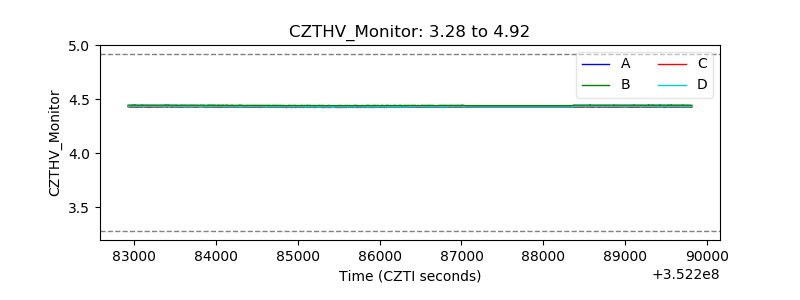 |
| D_VDD | 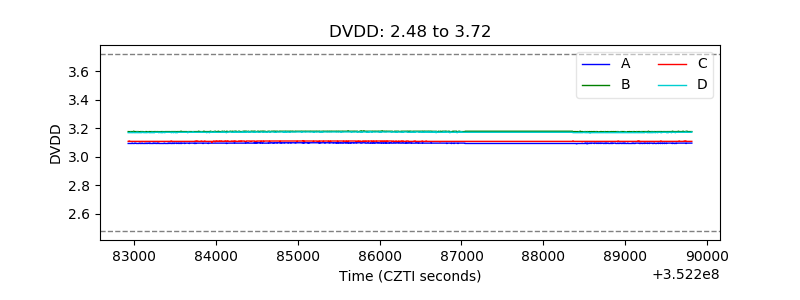 |
| Temperature 1 | 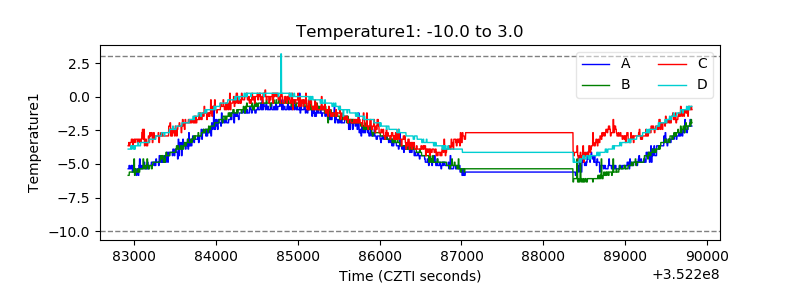 |
| Veto HV Monitor | 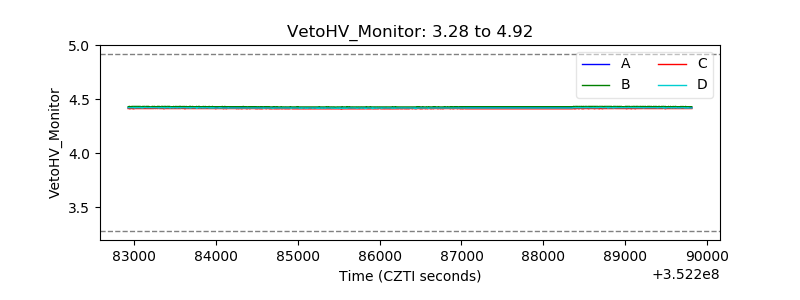 |
| Veto LLD | 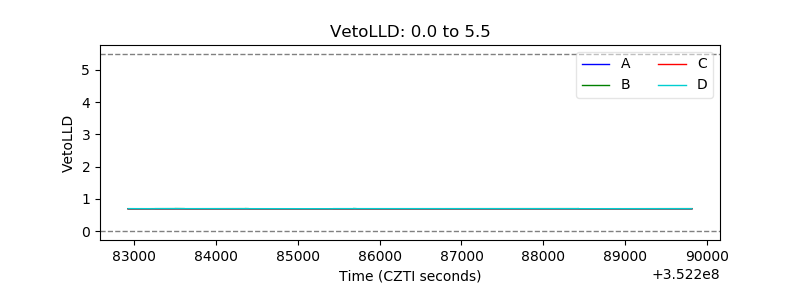 |
| Alpha Counter |  |
| _CPM_Rate |  |
| CZT Counter | 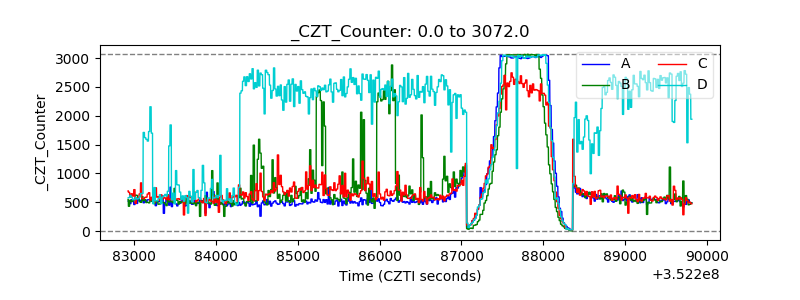 |
| +2.5 Volts monitor |  |
| +5 Volts monitor |  |
| _ROLL_ROT | 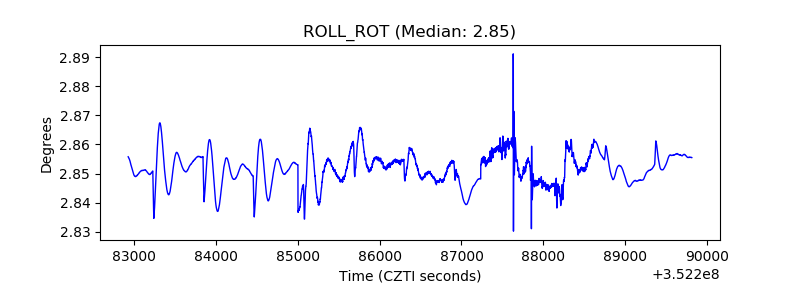 |
| _Roll_DEC | 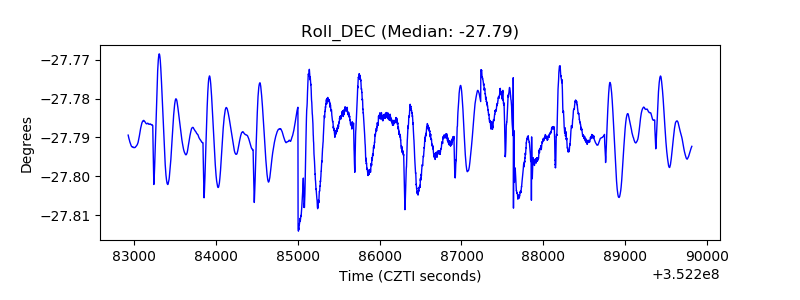 |
| _Roll_RA | 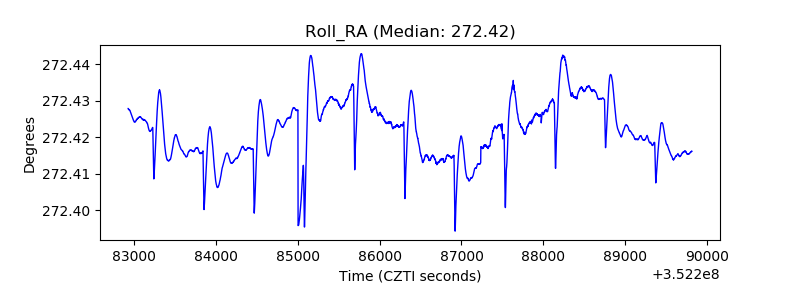 |
| Veto Counter | 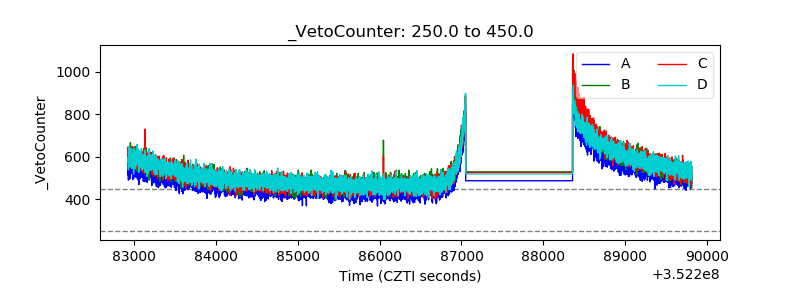 |