| Param | Original file | Final file |
|---|---|---|
| Filename | modeM0/AS1A10_050T03_9000004216_29327cztM0_level2.evt | modeM0/AS1A10_050T03_9000004216_29327cztM0_level2_quad_clean.evt |
| Size (bytes) | 899,343,360 | 78,140,160 |
| Size | 857.7 MB | 74.5 MB |
| Events in quadrant A | 3,410,069 | 579,713 |
| Events in quadrant B | 4,745,301 | 567,780 |
| Events in quadrant C | 3,716,513 | 535,482 |
| Events in quadrant D | 14,947,511 | 250,514 |
| Mode M9 | |||
|---|---|---|---|
| Quadrant | BADHDUFLAG | Total packets | Discarded packets |
| A | 0 | 13 | 0 |
| B | 0 | 13 | 0 |
| C | 0 | 13 | 0 |
| D | 0 | 13 | 0 |
| Mode SS | |||
|---|---|---|---|
| Quadrant | BADHDUFLAG | Total packets | Discarded packets |
| A | 0 | 124 | 0 |
| B | 0 | 124 | 0 |
| C | 0 | 124 | 0 |
| D | 0 | 124 | 0 |
| Mode M0 | |||
|---|---|---|---|
| Quadrant | BADHDUFLAG | Total packets | Discarded packets |
| A | 0 | 13535 | 1 |
| B | 0 | 18056 | 1 |
| C | 0 | 14819 | 1 |
| D | 0 | 48563 | 1 |
| Quadrant | Total seconds | Saturated seconds | Saturation percentage |
|---|---|---|---|
| A | 6180 | 115 | 1.860841% |
| B | 6181 | 367 | 5.937551% |
| C | 6180 | 153 | 2.475728% |
| D | 6180 | 6030 | 97.572816% |
Noise dominated data is calculated using 1-second bins in cleaned event files. If a bin has >2000 counts, and if more than 50% of those come from <1% of pixels, then it is considered to be noise-dominated and hence unusable.
| Quadrant | # 1 sec bins | Bins with >0 counts | Bins with >2000 counts | High rate bins dominated by noise | Noise dominated (total time) | Noise dominated (detector-on time) | Marked lightcurve |
|---|---|---|---|---|---|---|---|
| A | 7415 | 6181 | 11 | 11 | 0.15% | 0.18% | 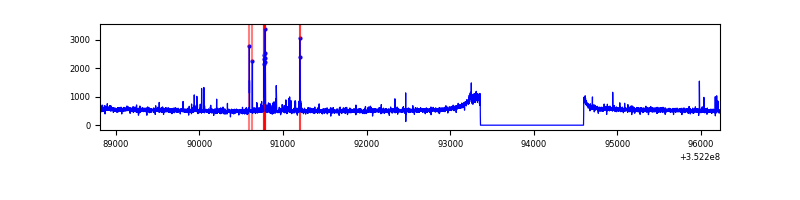 |
| B | 7416 | 6182 | 174 | 174 | 2.35% | 2.81% | 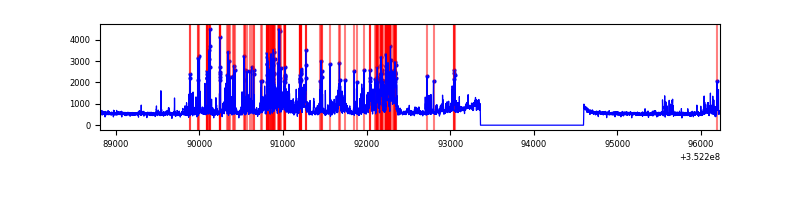 |
| C | 7415 | 6181 | 24 | 24 | 0.32% | 0.39% | 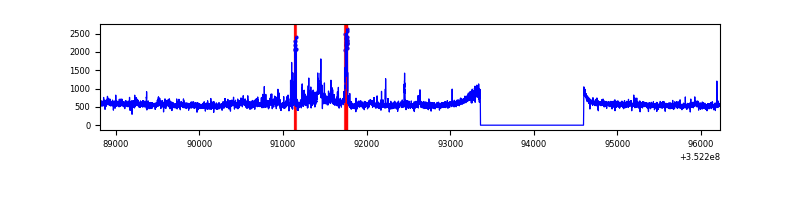 |
| D | 7415 | 6181 | 5086 | 5086 | 68.59% | 82.28% | 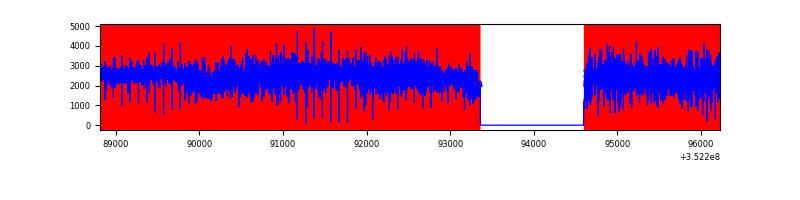 |
Top three noisy pixels from each quadrant. If the there are fewer than three noisy pixels in the level2.evt file, extra rows are filled as -1
| Pixel properties | Quadrant properties | ||||||
|---|---|---|---|---|---|---|---|
| Quadrant | DetID | PixID | Counts | Sigma | Mean | Median | Sigma |
| A | 1 | 113 | 59570 | 340.22 | 859 | 843 | 172.6 |
| A | 15 | 174 | 38471 | 217.99 | 859 | 843 | 172.6 |
| A | 13 | 254 | 13008 | 70.47 | 859 | 843 | 172.6 |
| B | 10 | 245 | 1223682 | 7950.78 | 825 | 808 | 153.8 |
| B | 0 | 190 | 106118 | 684.7 | 825 | 808 | 153.8 |
| B | 5 | 172 | 102148 | 658.88 | 825 | 808 | 153.8 |
| C | 3 | 233 | 358762 | 1917.38 | 805 | 814 | 186.7 |
| C | 14 | 238 | 129526 | 689.46 | 805 | 814 | 186.7 |
| C | 10 | 9 | 38465 | 201.68 | 805 | 814 | 186.7 |
| D | 12 | 33 | 12437543 | 120302.87 | 434 | 424 | 103.4 |
| D | 8 | 195 | 359663 | 3474.87 | 434 | 424 | 103.4 |
| D | 12 | 17 | 177121 | 1709.17 | 434 | 424 | 103.4 |
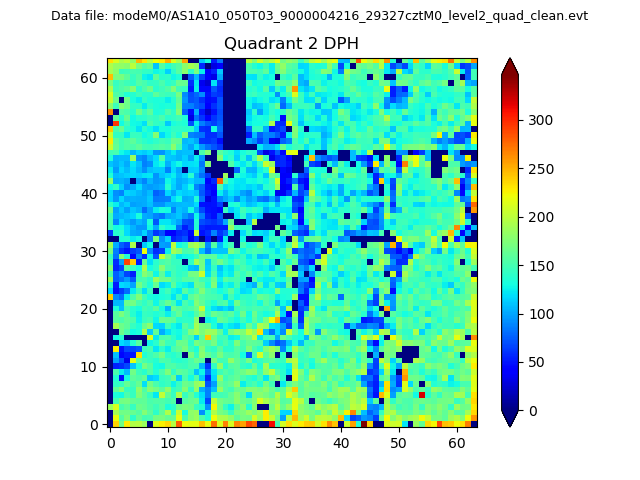
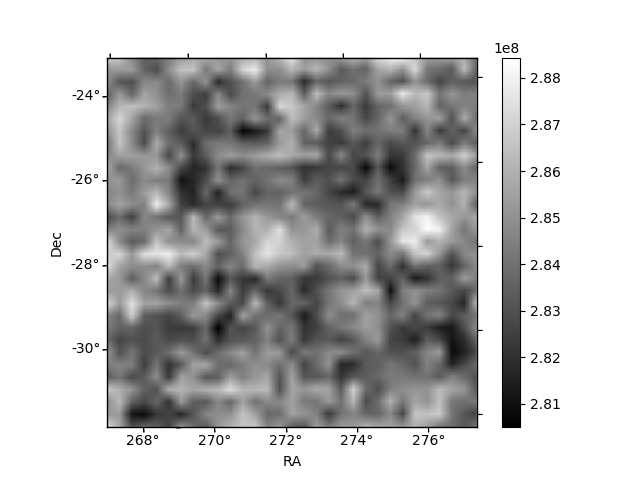
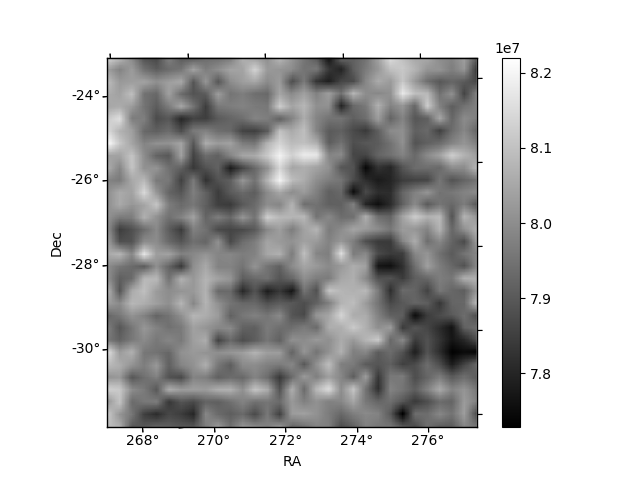
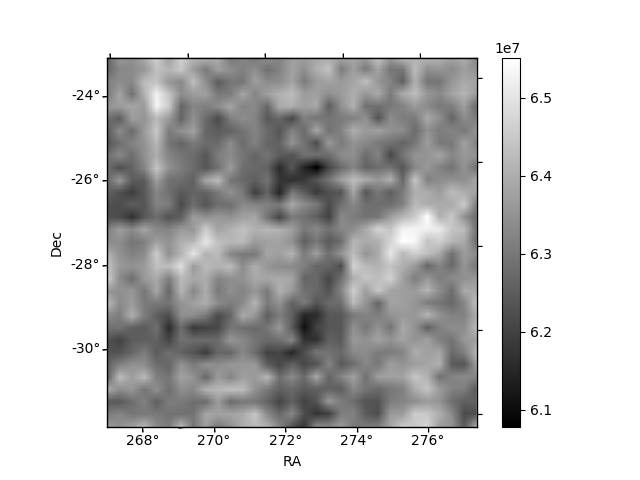
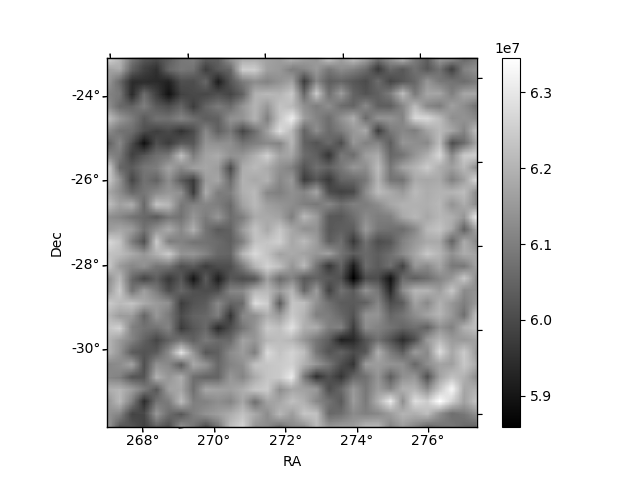
Histogram calculated using DETX and DETY for each event in the final _common_clean file
| Quadrant A | 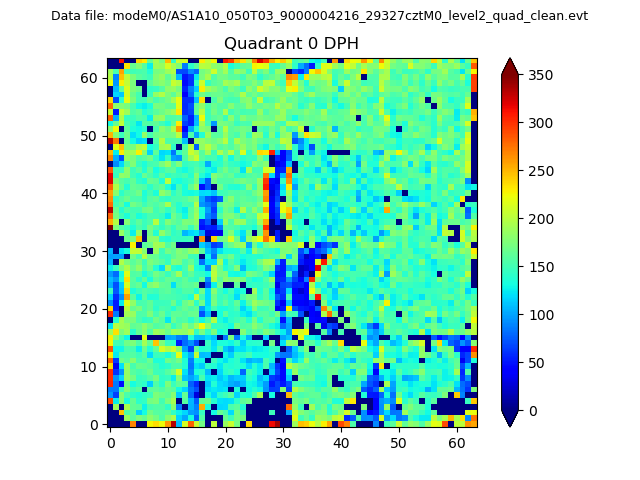 |
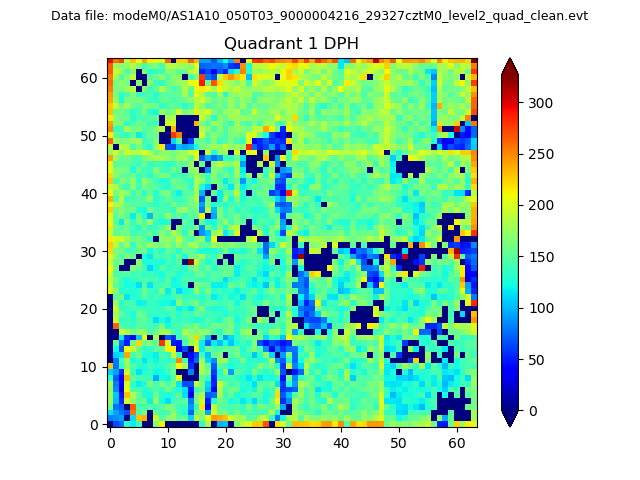 |
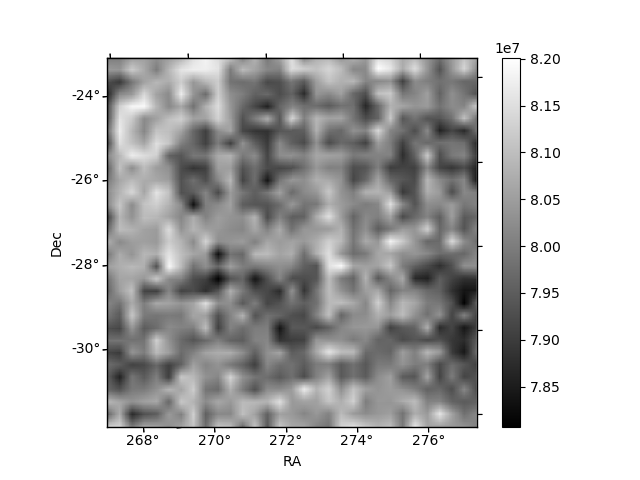
Quadrant B |
|---|---|---|---|
| Quadrant D | 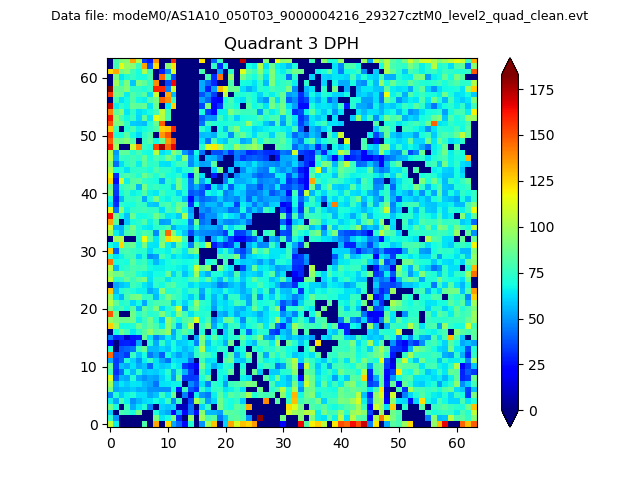 |
 |
Quadrant C |
| Plot type | Count rate plots | Images |
|---|---|---|
| Comparison with Poisson distribution Blue bars denote a histogram of data divided into 1 sec bins. Red curve is a Poisson curve with rate = median count rate of data. |
 |
 |
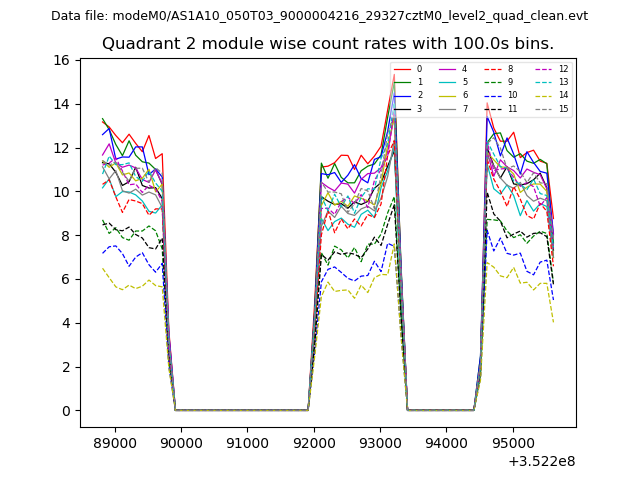
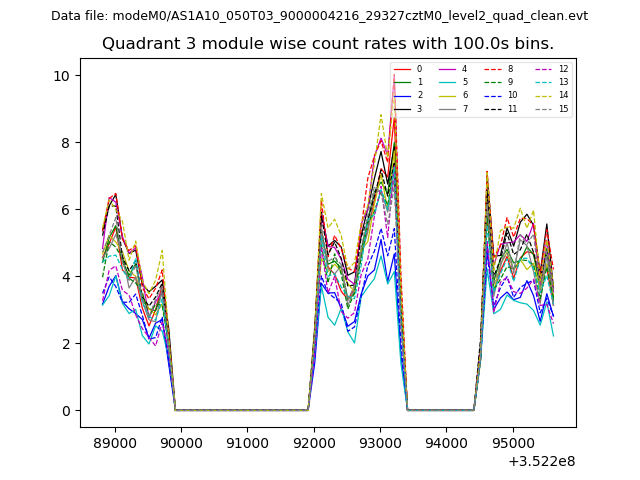
| Quadrant-wise count rates Data is divided into 100 sec bins |
 |
|
| Module-wise count rates for Quadrant A Data is divided into 100 sec bins |
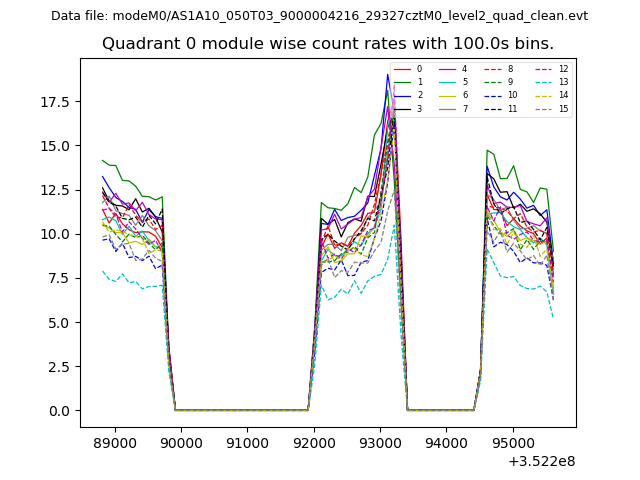 |
 |
| Module-wise count rates for Quadrant B Data is divided into 100 sec bins |
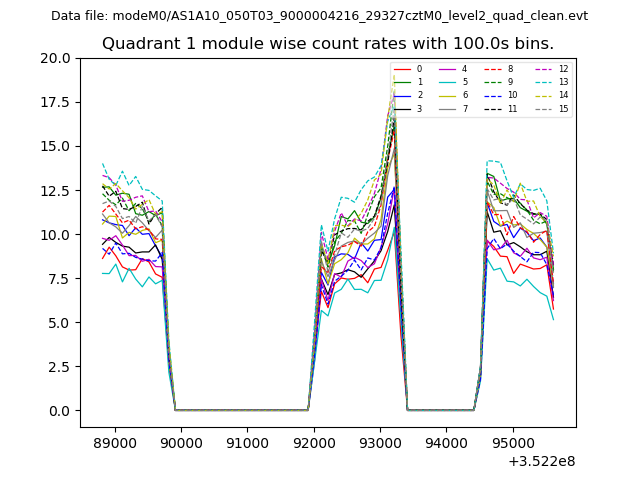 |
 |
| Module-wise count rates for Quadrant C Data is divided into 100 sec bins |
 |
 |
| Module-wise count rates for Quadrant D Data is divided into 100 sec bins |
 |
 |
| Parameter | Plot |
|---|---|
| CZT HV Monitor | 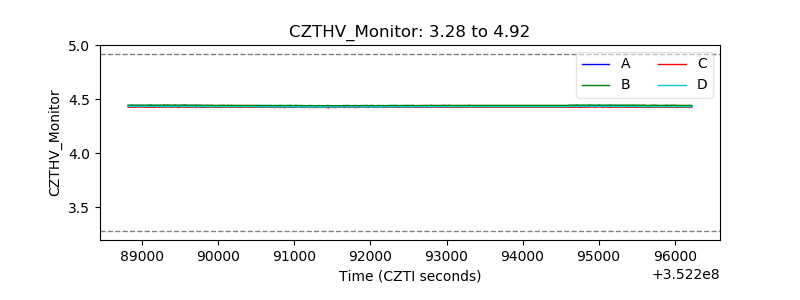 |
| D_VDD | 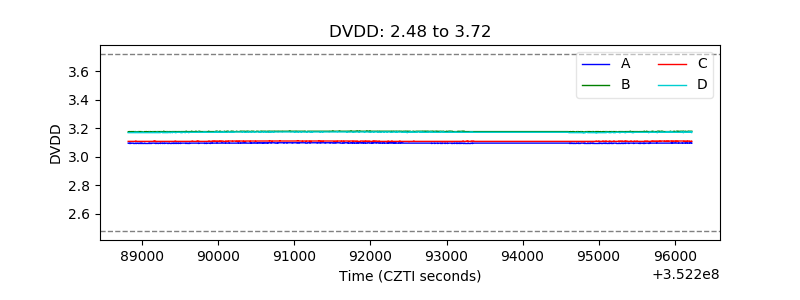 |
| Temperature 1 | 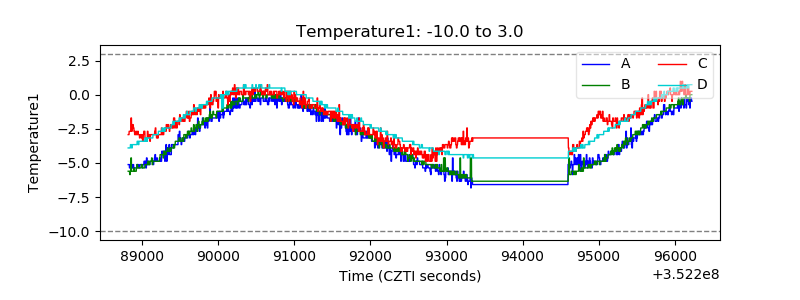 |
| Veto HV Monitor | 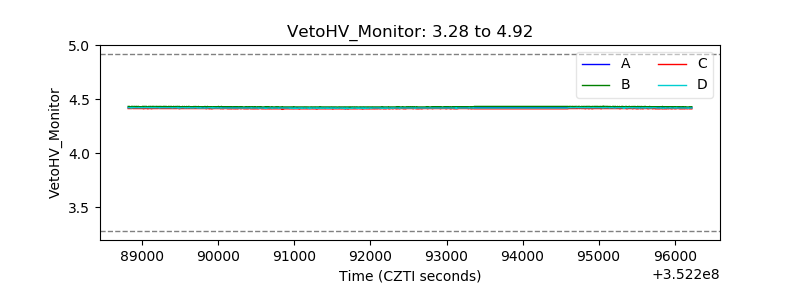 |
| Veto LLD | 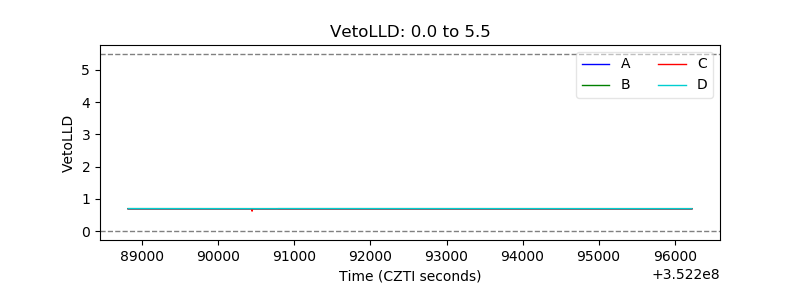 |
| Alpha Counter |  |
| _CPM_Rate |  |
| CZT Counter | 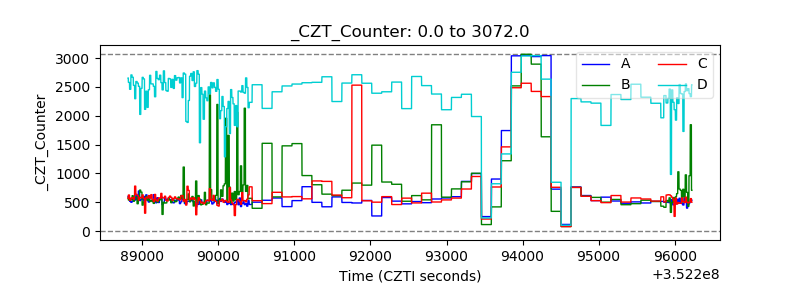 |
| +2.5 Volts monitor |  |
| +5 Volts monitor |  |
| _ROLL_ROT | 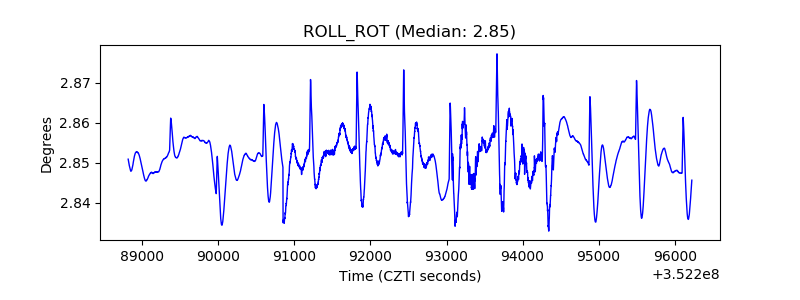 |
| _Roll_DEC | 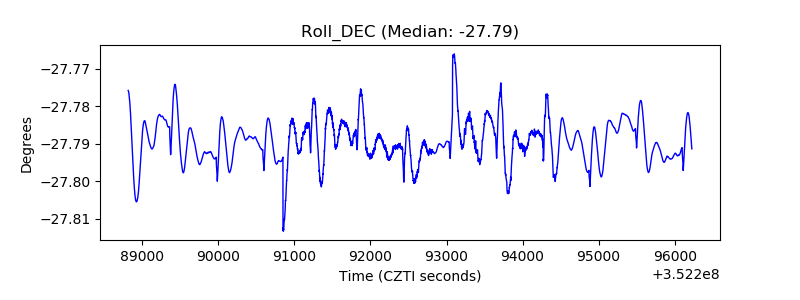 |
| _Roll_RA | 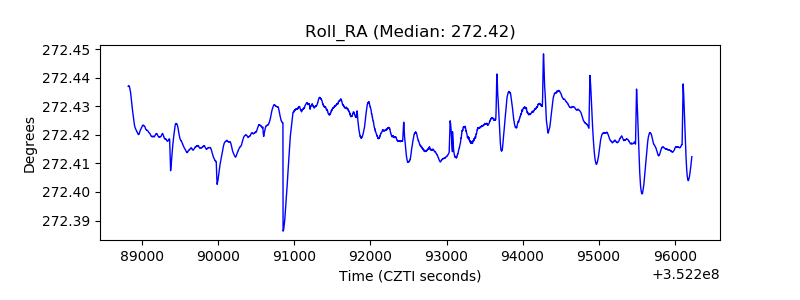 |
| Veto Counter | 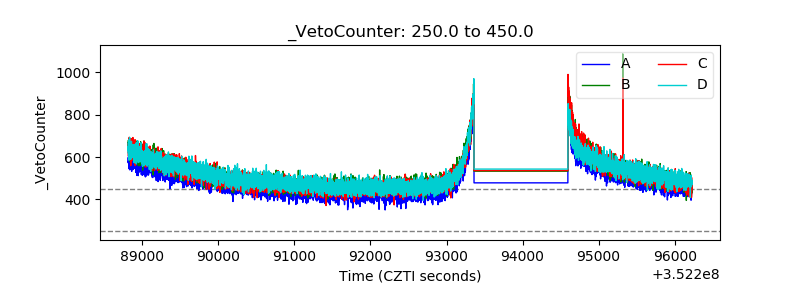 |