| Param | Original file | Final file |
|---|---|---|
| Filename | modeM0/AS1A10_050T03_9000004216_29328cztM0_level2.evt | modeM0/AS1A10_050T03_9000004216_29328cztM0_level2_quad_clean.evt |
| Size (bytes) | 914,022,720 | 73,226,880 |
| Size | 871.7 MB | 69.8 MB |
| Events in quadrant A | 3,484,458 | 521,839 |
| Events in quadrant B | 4,511,449 | 518,974 |
| Events in quadrant C | 3,559,474 | 499,550 |
| Events in quadrant D | 15,675,310 | 211,198 |
| Mode M9 | |||
|---|---|---|---|
| Quadrant | BADHDUFLAG | Total packets | Discarded packets |
| A | 0 | 11 | 0 |
| B | 0 | 11 | 0 |
| C | 0 | 11 | 0 |
| D | 0 | 11 | 0 |
| Mode SS | |||
|---|---|---|---|
| Quadrant | BADHDUFLAG | Total packets | Discarded packets |
| A | 0 | 134 | 0 |
| B | 0 | 134 | 0 |
| C | 0 | 134 | 0 |
| D | 0 | 134 | 0 |
| Mode M0 | |||
|---|---|---|---|
| Quadrant | BADHDUFLAG | Total packets | Discarded packets |
| A | 0 | 14062 | 1 |
| B | 0 | 17404 | 1 |
| C | 0 | 14225 | 1 |
| D | 0 | 51031 | 8 |
| Quadrant | Total seconds | Saturated seconds | Saturation percentage |
|---|---|---|---|
| A | 6658 | 116 | 1.742265% |
| B | 6659 | 360 | 5.406217% |
| C | 6659 | 136 | 2.042349% |
| D | 6658 | 6558 | 98.498047% |
Noise dominated data is calculated using 1-second bins in cleaned event files. If a bin has >2000 counts, and if more than 50% of those come from <1% of pixels, then it is considered to be noise-dominated and hence unusable.
| Quadrant | # 1 sec bins | Bins with >0 counts | Bins with >2000 counts | High rate bins dominated by noise | Noise dominated (total time) | Noise dominated (detector-on time) | Marked lightcurve |
|---|---|---|---|---|---|---|---|
| A | 7723 | 6659 | 5 | 5 | 0.06% | 0.08% | 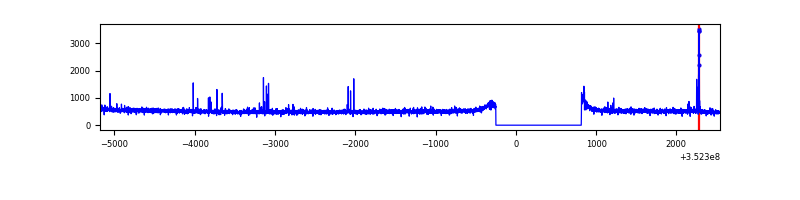 |
| B | 7724 | 6660 | 180 | 180 | 2.33% | 2.70% | 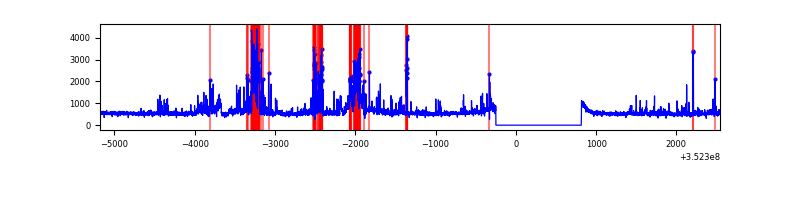 |
| C | 7724 | 6660 | 0 | 0 | 0.00% | 0.00% | 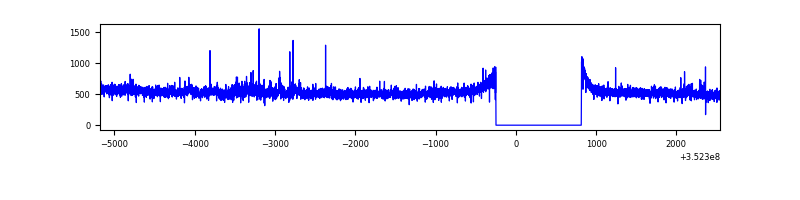 |
| D | 7723 | 6659 | 4992 | 4992 | 64.64% | 74.97% | 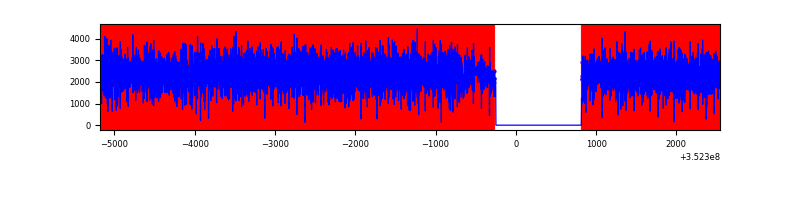 |
Top three noisy pixels from each quadrant. If the there are fewer than three noisy pixels in the level2.evt file, extra rows are filled as -1
| Pixel properties | Quadrant properties | ||||||
|---|---|---|---|---|---|---|---|
| Quadrant | DetID | PixID | Counts | Sigma | Mean | Median | Sigma |
| A | 0 | 13 | 37641 | 208.64 | 884 | 867 | 176.3 |
| A | 1 | 113 | 27592 | 151.63 | 884 | 867 | 176.3 |
| A | 13 | 254 | 15215 | 81.4 | 884 | 867 | 176.3 |
| B | 10 | 245 | 551424 | 3421.48 | 853 | 833 | 160.9 |
| B | 5 | 172 | 369741 | 2292.47 | 853 | 833 | 160.9 |
| B | 0 | 190 | 103148 | 635.81 | 853 | 833 | 160.9 |
| C | 14 | 238 | 134297 | 683.69 | 838 | 847 | 195.2 |
| C | 3 | 233 | 113947 | 579.43 | 838 | 847 | 195.2 |
| C | 2 | 114 | 17203 | 83.79 | 838 | 847 | 195.2 |
| D | 12 | 33 | 12807679 | 126952.52 | 416 | 404 | 100.9 |
| D | 12 | 17 | 491609 | 4869.09 | 416 | 404 | 100.9 |
| D | 1 | 52 | 230152 | 2277.38 | 416 | 404 | 100.9 |
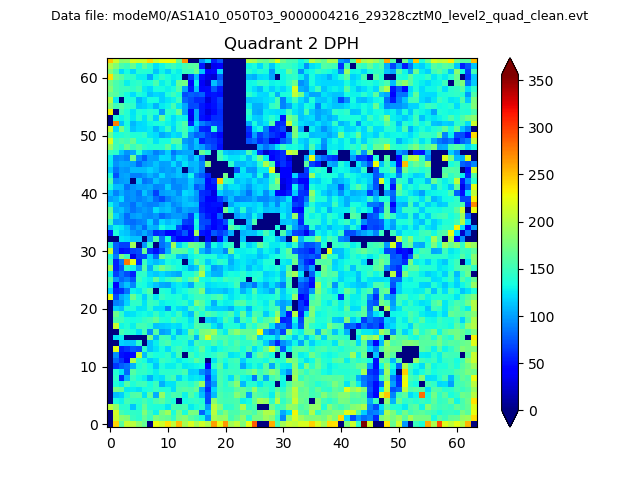
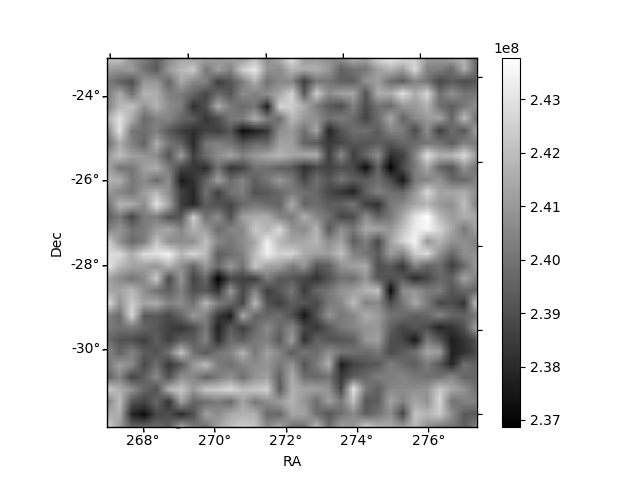
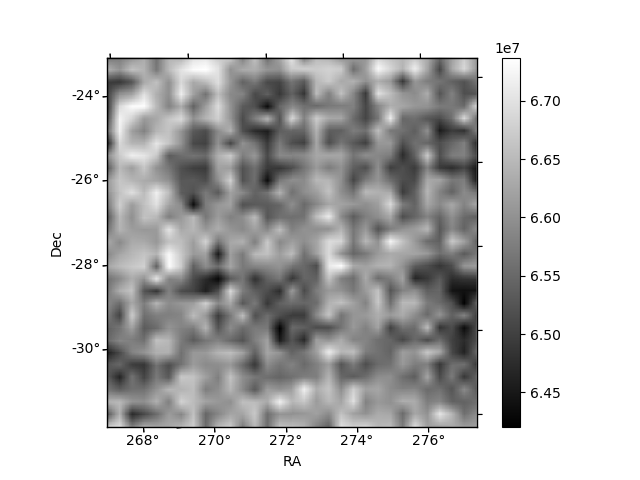
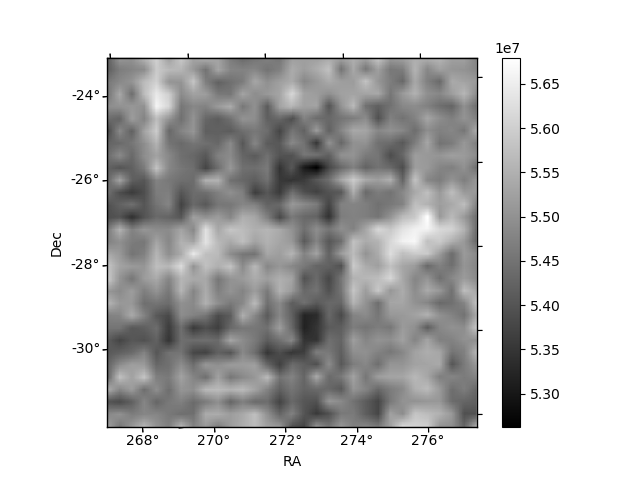
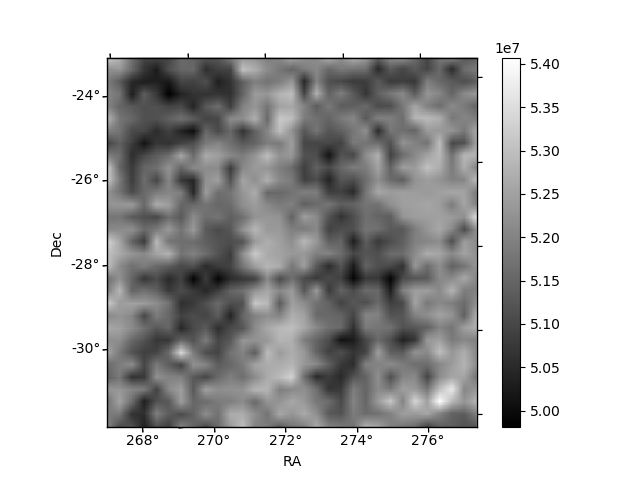
Histogram calculated using DETX and DETY for each event in the final _common_clean file
| Quadrant A | 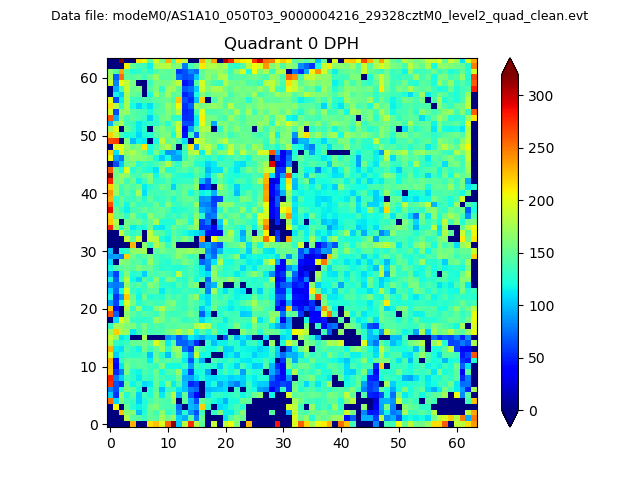 |
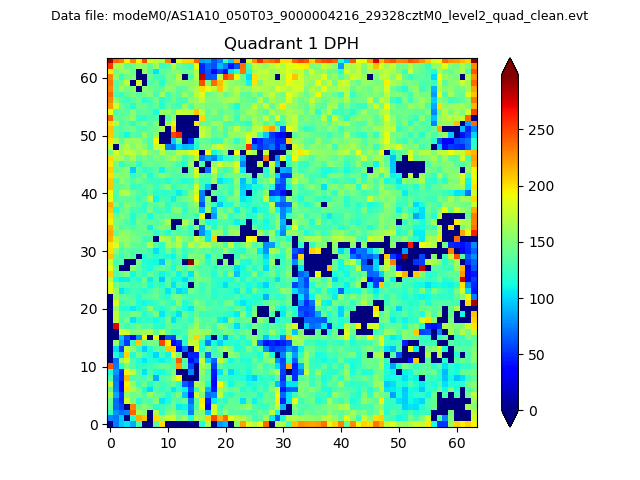 |
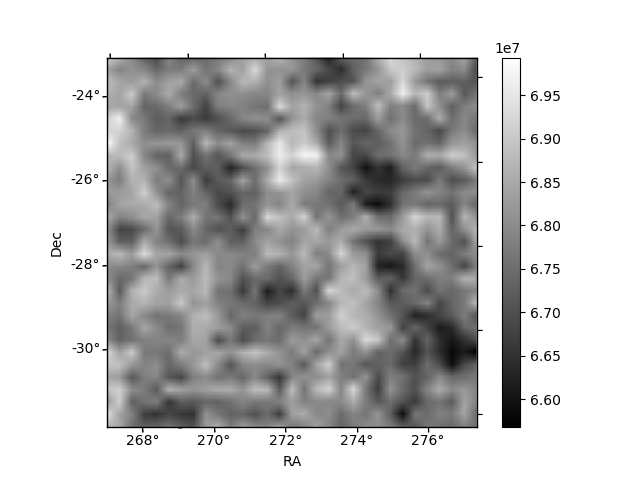
Quadrant B |
|---|---|---|---|
| Quadrant D | 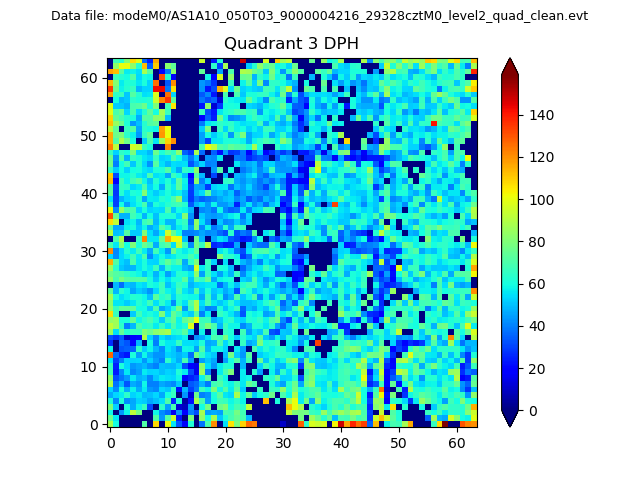 |
 |
Quadrant C |
| Plot type | Count rate plots | Images |
|---|---|---|
| Comparison with Poisson distribution Blue bars denote a histogram of data divided into 1 sec bins. Red curve is a Poisson curve with rate = median count rate of data. |
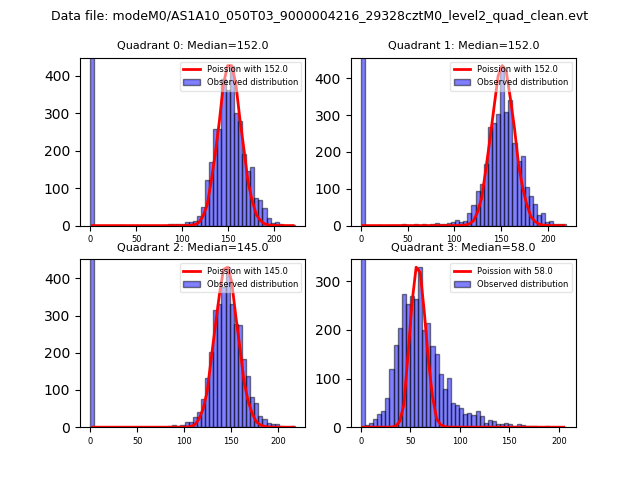 |
 |
| Quadrant-wise count rates Data is divided into 100 sec bins |
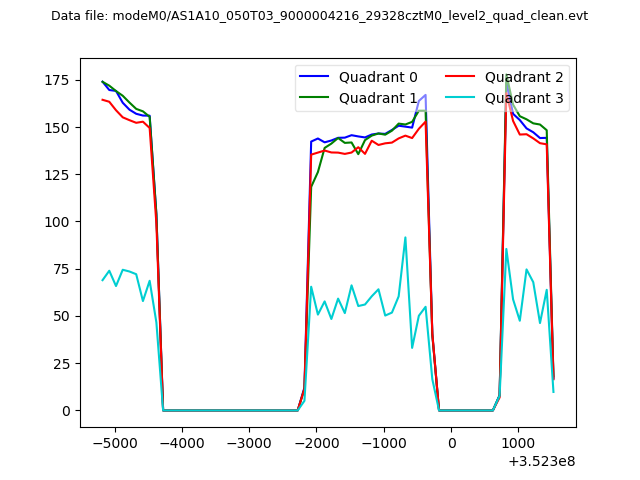 |
|
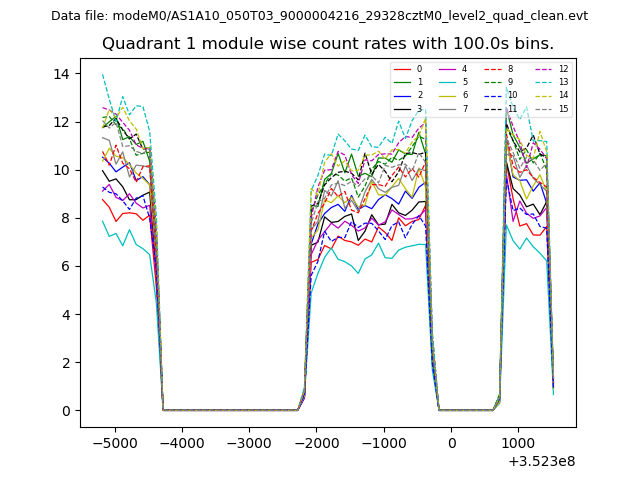
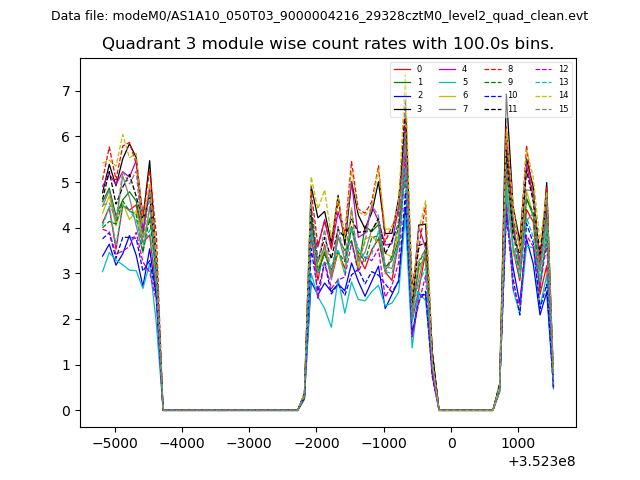
| Module-wise count rates for Quadrant A Data is divided into 100 sec bins |
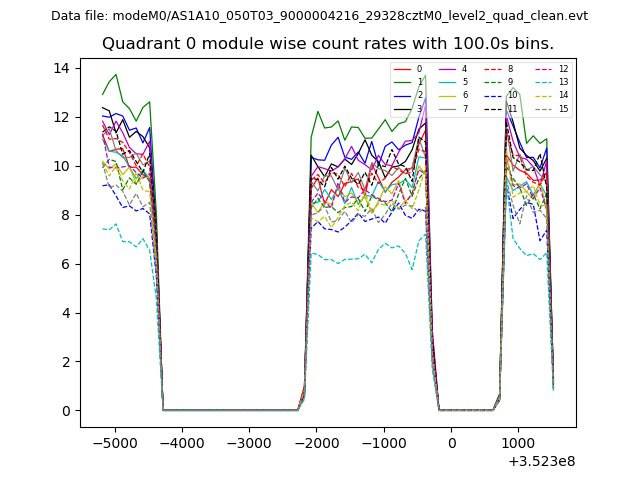 |
 |
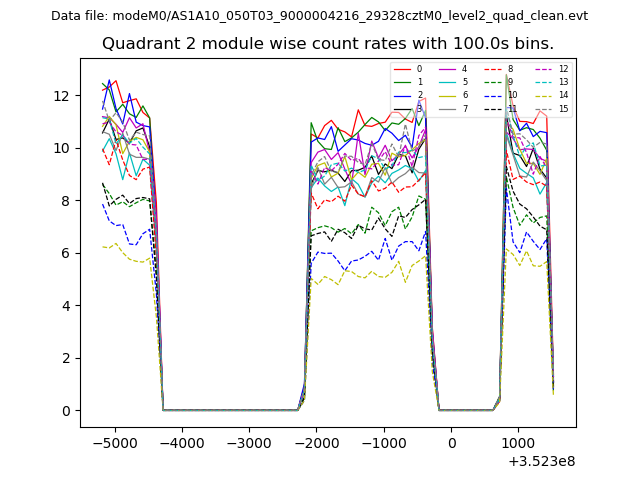
| Module-wise count rates for Quadrant B Data is divided into 100 sec bins |
 |
 |
| Module-wise count rates for Quadrant C Data is divided into 100 sec bins |
 |
 |
| Module-wise count rates for Quadrant D Data is divided into 100 sec bins |
 |
 |
| Parameter | Plot |
|---|---|
| CZT HV Monitor | 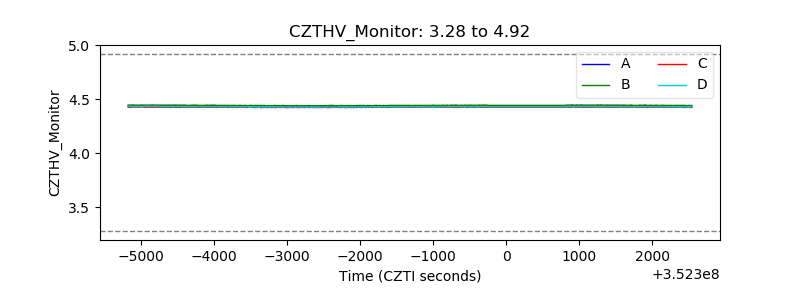 |
| D_VDD | 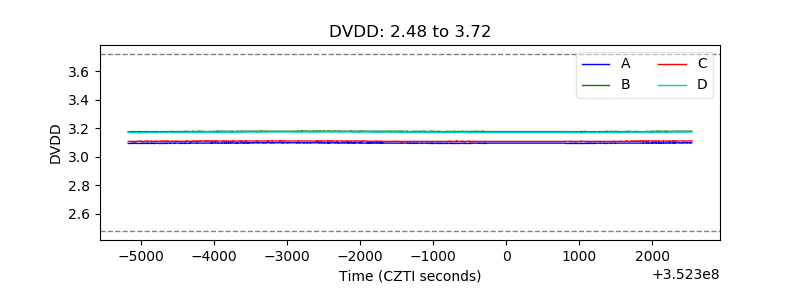 |
| Temperature 1 | 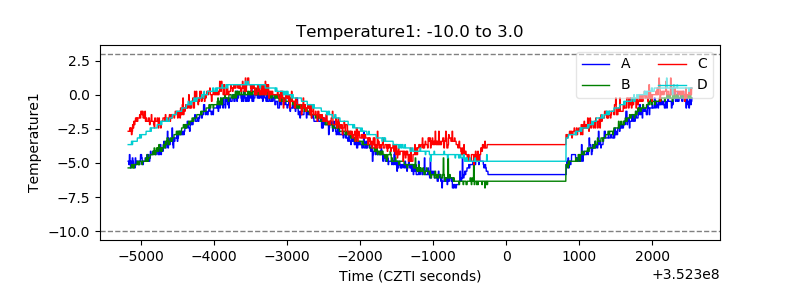 |
| Veto HV Monitor | 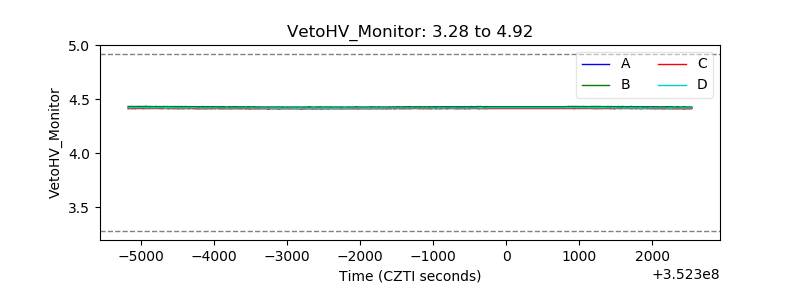 |
| Veto LLD | 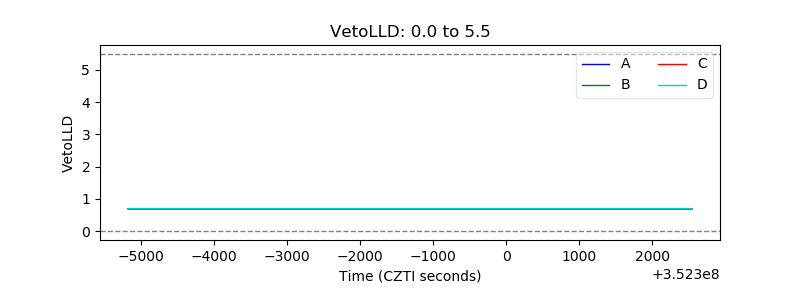 |
| Alpha Counter | 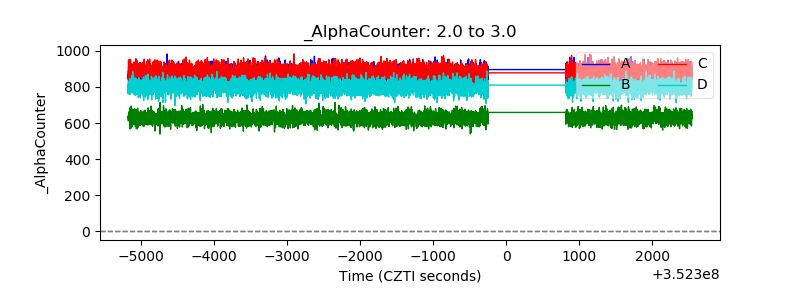 |
| _CPM_Rate | 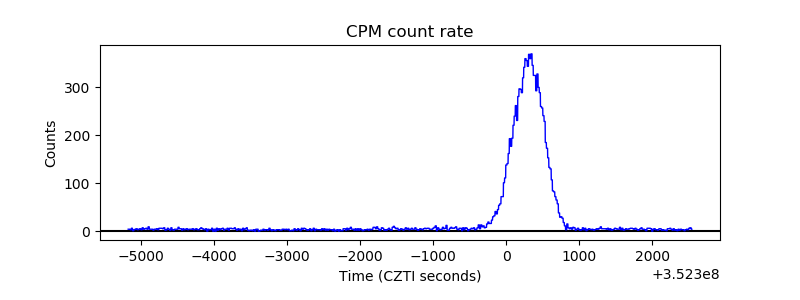 |
| CZT Counter | 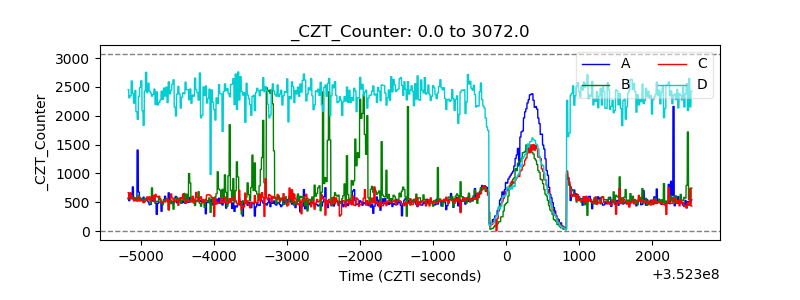 |
| +2.5 Volts monitor |  |
| +5 Volts monitor |  |
| _ROLL_ROT | 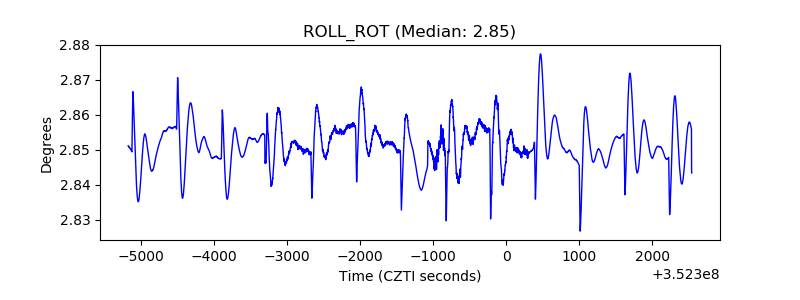 |
| _Roll_DEC | 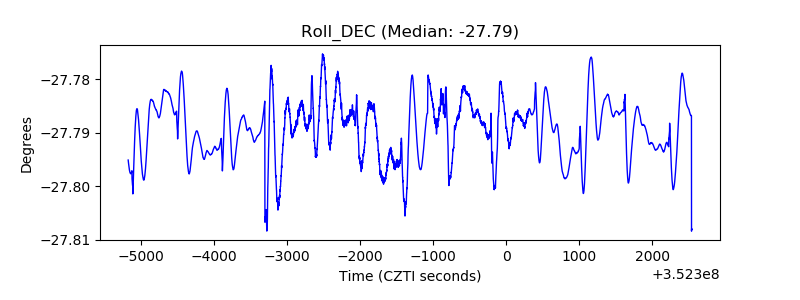 |
| _Roll_RA | 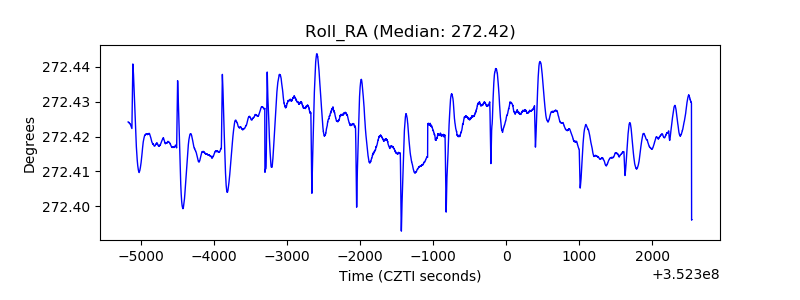 |
| Veto Counter | 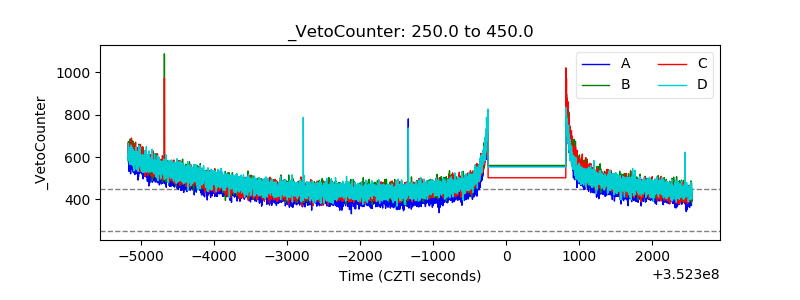 |