| Param | Original file | Final file |
|---|---|---|
| Filename | modeM0/AS1A10_050T03_9000004216_29329cztM0_level2.evt | modeM0/AS1A10_050T03_9000004216_29329cztM0_level2_quad_clean.evt |
| Size (bytes) | 855,308,160 | 61,352,640 |
| Size | 815.7 MB | 58.5 MB |
| Events in quadrant A | 3,289,473 | 411,872 |
| Events in quadrant B | 3,765,329 | 412,649 |
| Events in quadrant C | 3,440,232 | 400,418 |
| Events in quadrant D | 14,965,676 | 176,008 |
| Mode M9 | |||
|---|---|---|---|
| Quadrant | BADHDUFLAG | Total packets | Discarded packets |
| A | 0 | 7 | 0 |
| B | 0 | 7 | 0 |
| C | 0 | 7 | 0 |
| D | 0 | 7 | 0 |
| Mode SS | |||
|---|---|---|---|
| Quadrant | BADHDUFLAG | Total packets | Discarded packets |
| A | 0 | 134 | 0 |
| B | 0 | 134 | 0 |
| C | 0 | 134 | 0 |
| D | 0 | 134 | 0 |
| Mode M0 | |||
|---|---|---|---|
| Quadrant | BADHDUFLAG | Total packets | Discarded packets |
| A | 0 | 13657 | 1 |
| B | 0 | 15069 | 1 |
| C | 0 | 13952 | 1 |
| D | 0 | 48880 | 5 |
| Quadrant | Total seconds | Saturated seconds | Saturation percentage |
|---|---|---|---|
| A | 6518 | 120 | 1.841056% |
| B | 6519 | 187 | 2.868538% |
| C | 6519 | 163 | 2.500383% |
| D | 6518 | 6433 | 98.695919% |
Noise dominated data is calculated using 1-second bins in cleaned event files. If a bin has >2000 counts, and if more than 50% of those come from <1% of pixels, then it is considered to be noise-dominated and hence unusable.
| Quadrant | # 1 sec bins | Bins with >0 counts | Bins with >2000 counts | High rate bins dominated by noise | Noise dominated (total time) | Noise dominated (detector-on time) | Marked lightcurve |
|---|---|---|---|---|---|---|---|
| A | 7263 | 6519 | 7 | 7 | 0.10% | 0.11% | 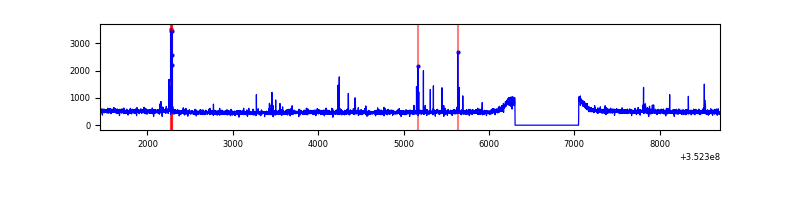 |
| B | 7264 | 6520 | 23 | 23 | 0.32% | 0.35% | 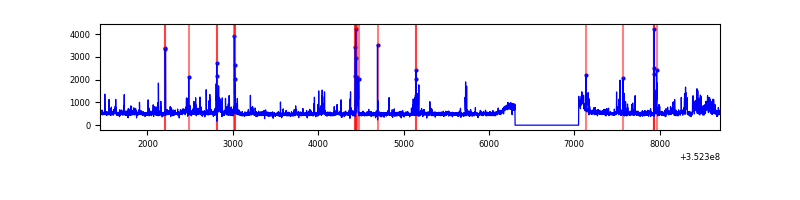 |
| C | 7264 | 6520 | 0 | 0 | 0.00% | 0.00% | 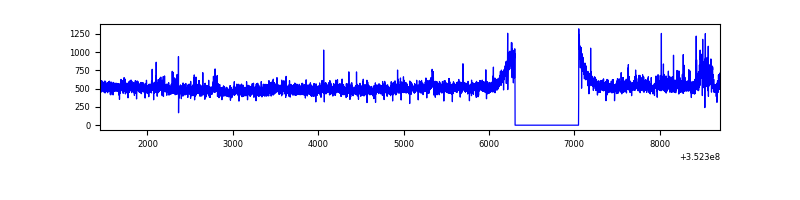 |
| D | 7263 | 6518 | 4617 | 4617 | 63.57% | 70.83% | 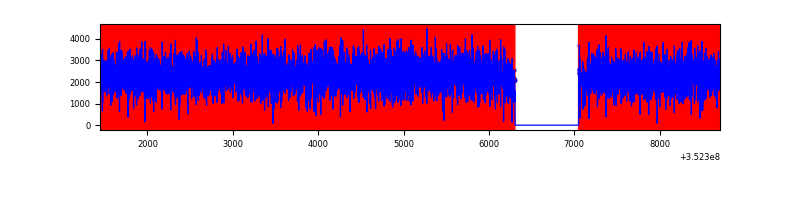 |
Top three noisy pixels from each quadrant. If the there are fewer than three noisy pixels in the level2.evt file, extra rows are filled as -1
| Pixel properties | Quadrant properties | ||||||
|---|---|---|---|---|---|---|---|
| Quadrant | DetID | PixID | Counts | Sigma | Mean | Median | Sigma |
| A | 0 | 13 | 40467 | 236.86 | 831 | 813 | 167.4 |
| A | 1 | 113 | 31699 | 184.49 | 831 | 813 | 167.4 |
| A | 13 | 254 | 15960 | 90.48 | 831 | 813 | 167.4 |
| B | 0 | 190 | 175750 | 1109.11 | 820 | 801 | 157.7 |
| B | 10 | 245 | 85926 | 539.66 | 820 | 801 | 157.7 |
| B | 5 | 255 | 76387 | 479.18 | 820 | 801 | 157.7 |
| C | 3 | 233 | 192173 | 1025.38 | 793 | 800 | 186.6 |
| C | 14 | 238 | 130381 | 694.3 | 793 | 800 | 186.6 |
| C | 2 | 114 | 16210 | 82.57 | 793 | 800 | 186.6 |
| D | 12 | 33 | 8779716 | 92985.46 | 393 | 383 | 94.4 |
| D | 12 | 17 | 1998838 | 21166.44 | 393 | 383 | 94.4 |
| D | 1 | 52 | 1992749 | 21101.95 | 393 | 383 | 94.4 |
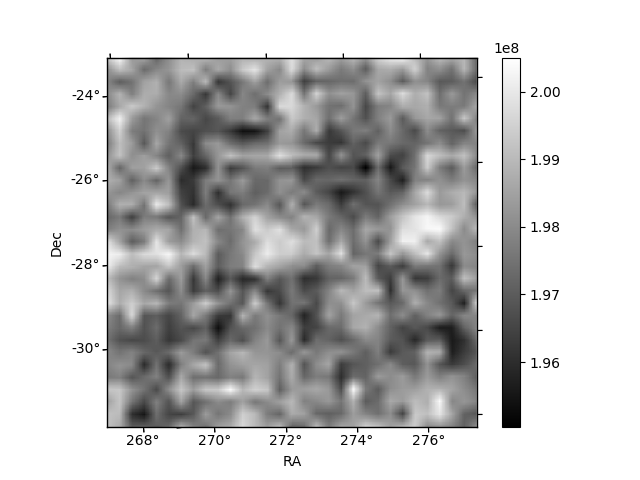
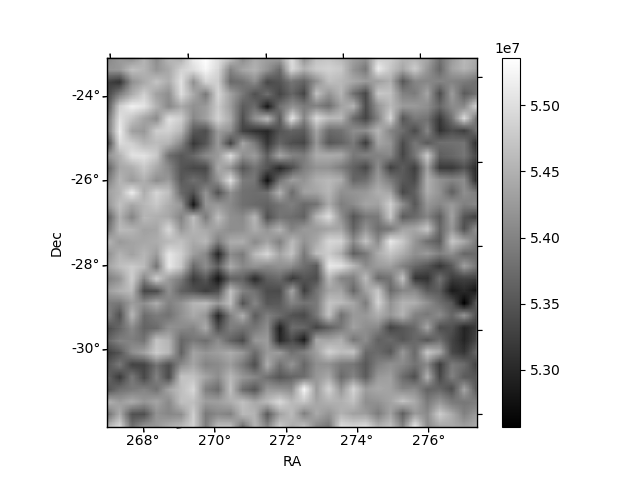
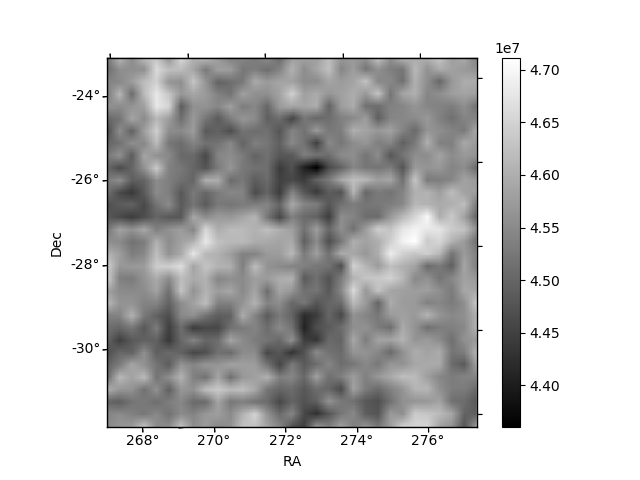
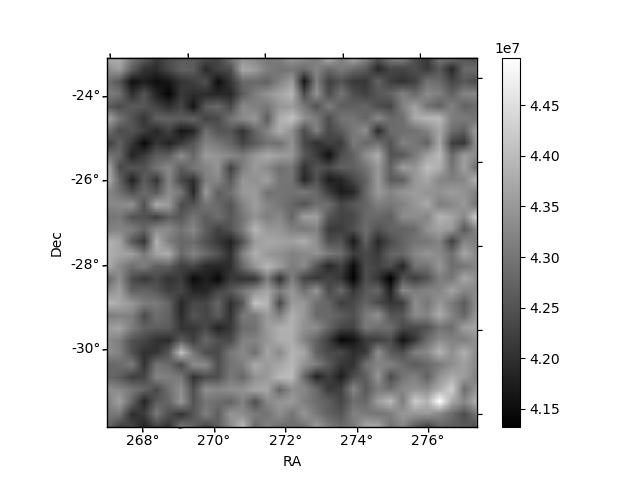
Histogram calculated using DETX and DETY for each event in the final _common_clean file
| Quadrant A | 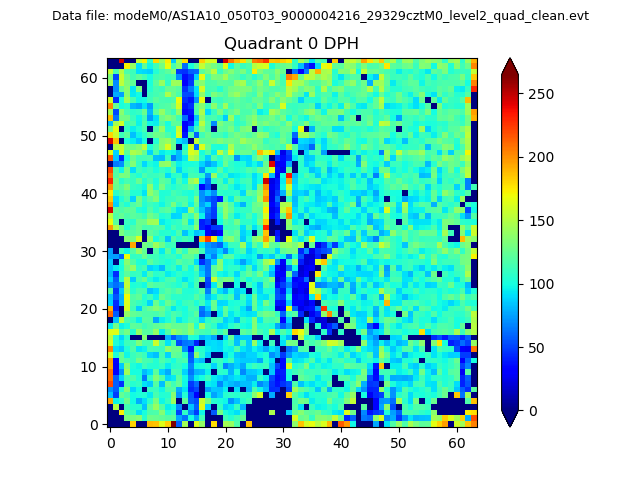 |
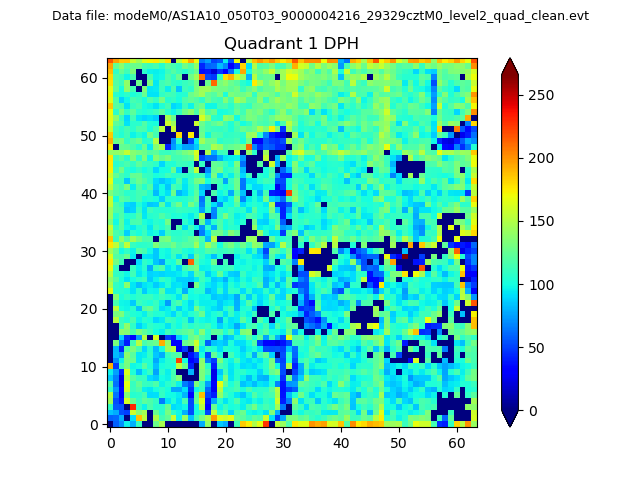 |
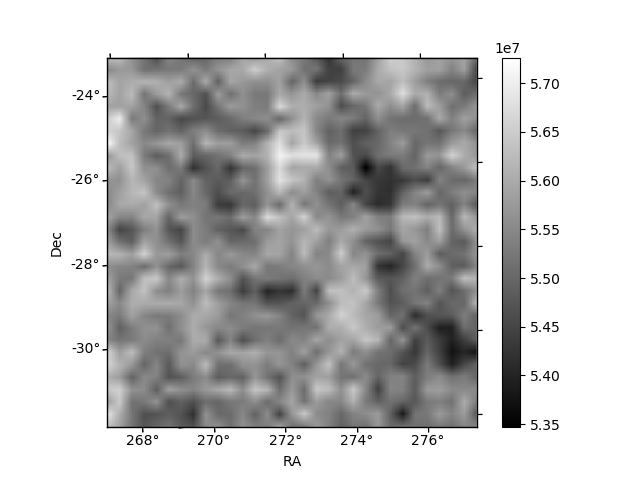
Quadrant B |
|---|---|---|---|
| Quadrant D | 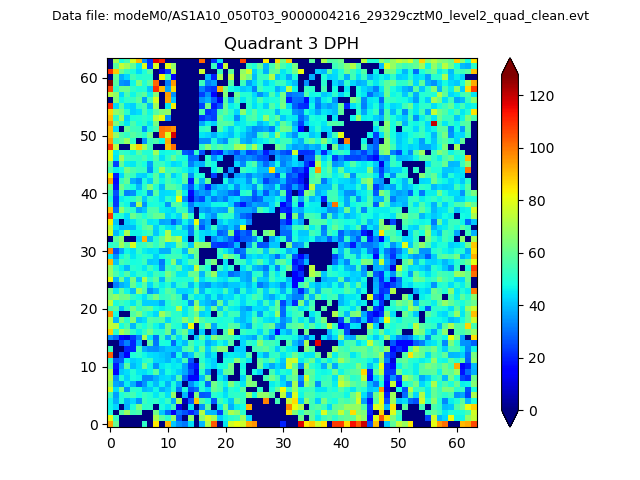 |
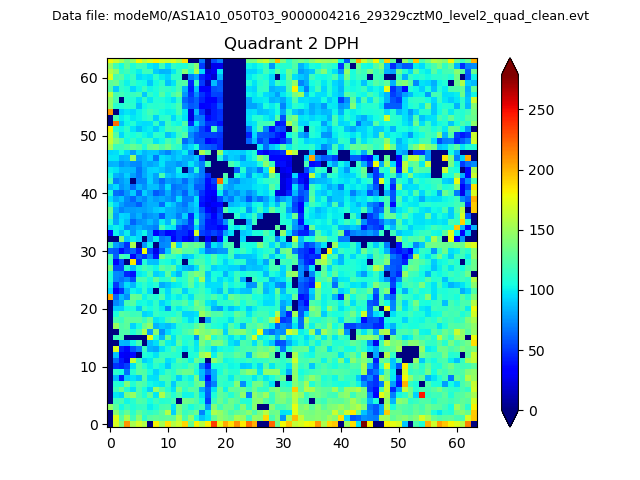 |
Quadrant C |
| Plot type | Count rate plots | Images |
|---|---|---|
| Comparison with Poisson distribution Blue bars denote a histogram of data divided into 1 sec bins. Red curve is a Poisson curve with rate = median count rate of data. |
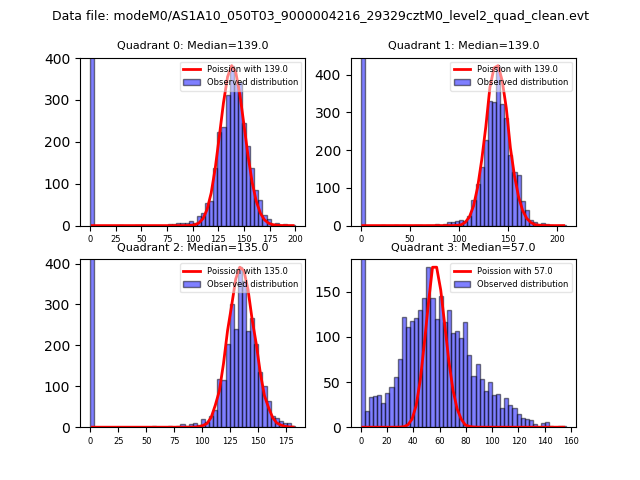 |
 |
| Quadrant-wise count rates Data is divided into 100 sec bins |
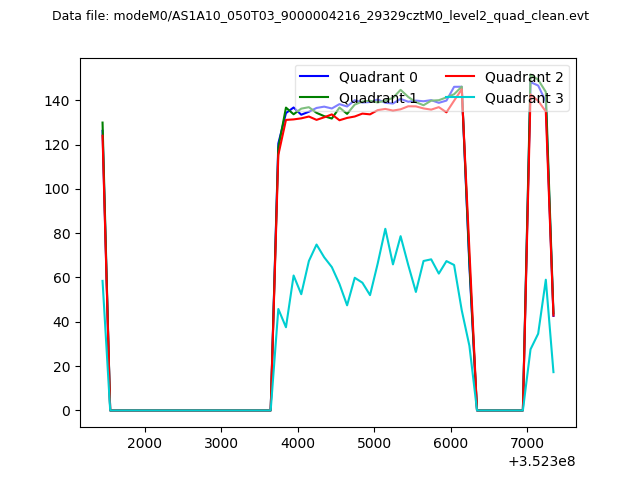 |
|
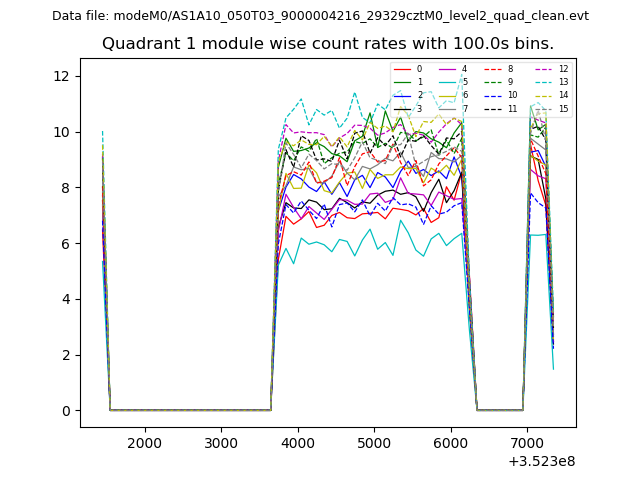
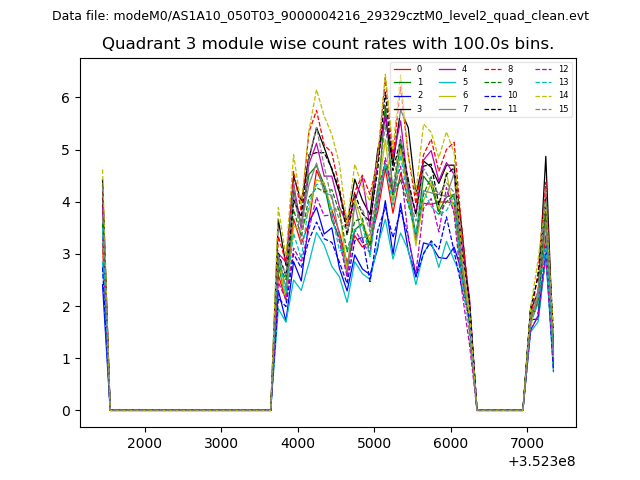
| Module-wise count rates for Quadrant A Data is divided into 100 sec bins |
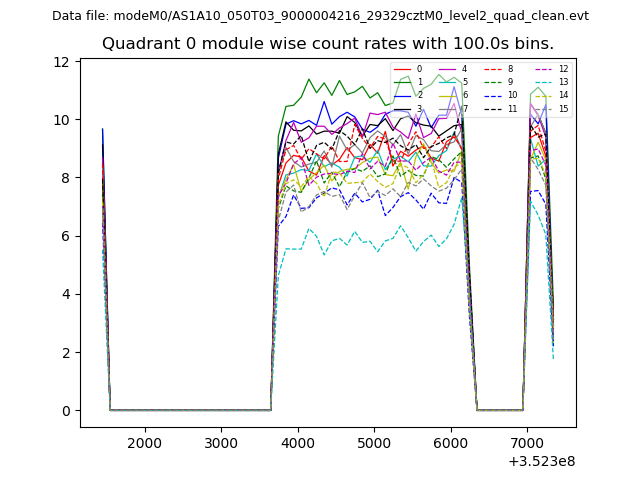 |
 |
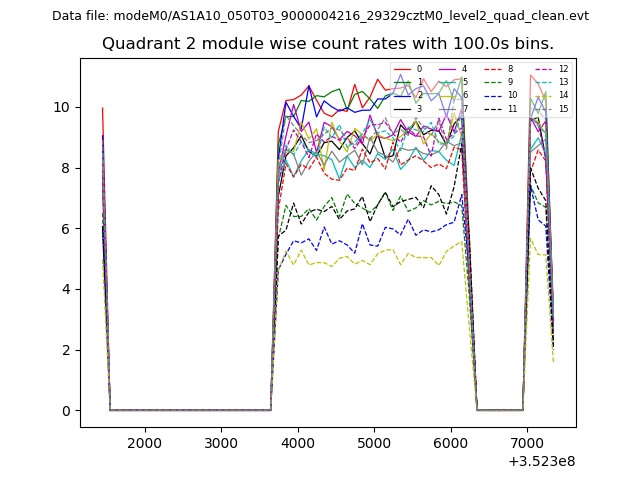
| Module-wise count rates for Quadrant B Data is divided into 100 sec bins |
 |
 |
| Module-wise count rates for Quadrant C Data is divided into 100 sec bins |
 |
 |
| Module-wise count rates for Quadrant D Data is divided into 100 sec bins |
 |
 |
| Parameter | Plot |
|---|---|
| CZT HV Monitor | 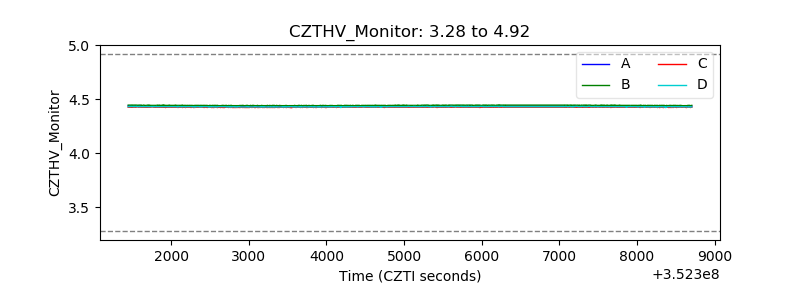 |
| D_VDD | 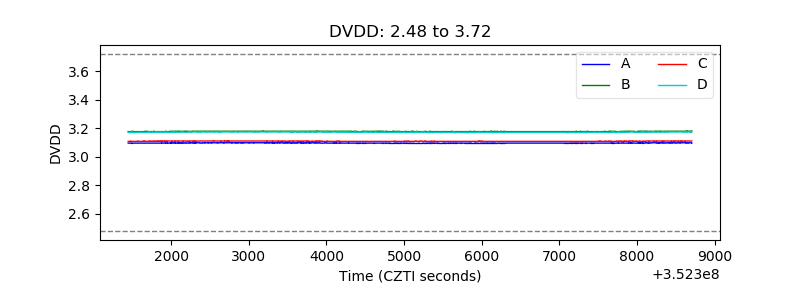 |
| Temperature 1 | 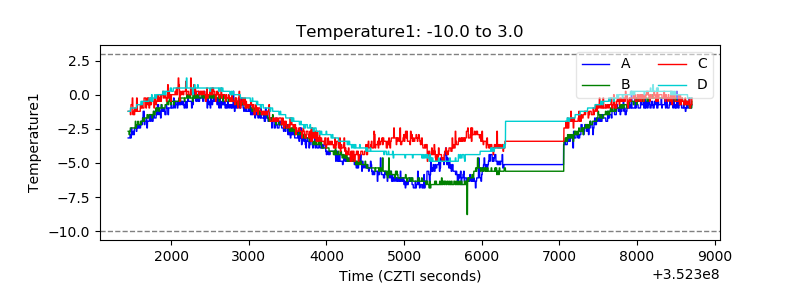 |
| Veto HV Monitor |  |
| Veto LLD | 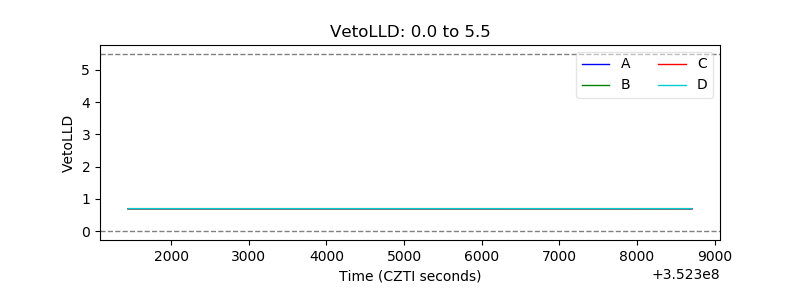 |
| Alpha Counter | 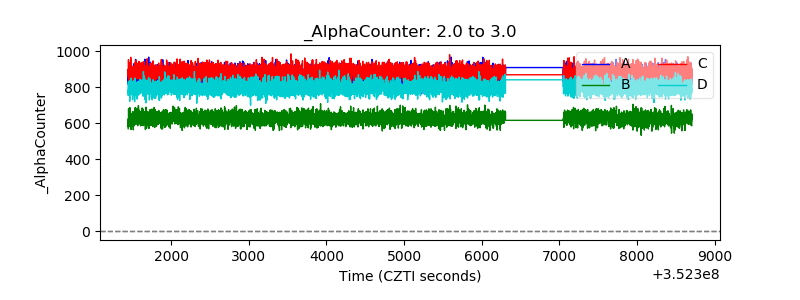 |
| _CPM_Rate |  |
| CZT Counter | 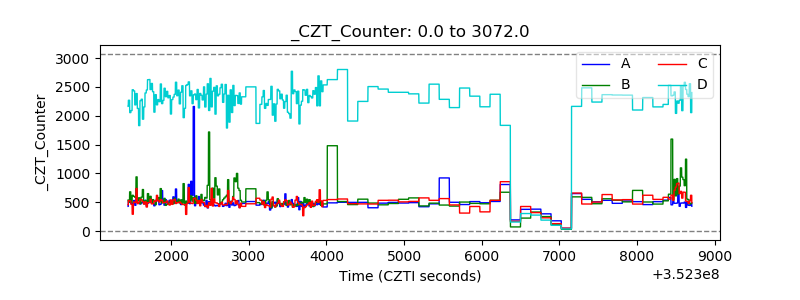 |
| +2.5 Volts monitor |  |
| +5 Volts monitor | 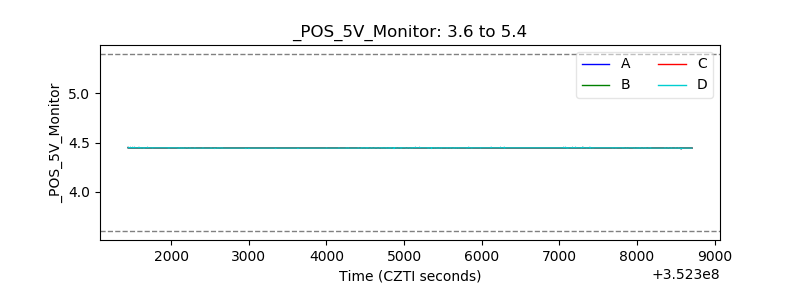 |
| _ROLL_ROT | 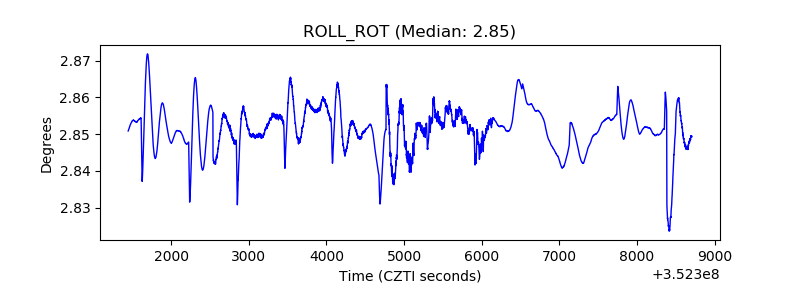 |
| _Roll_DEC | 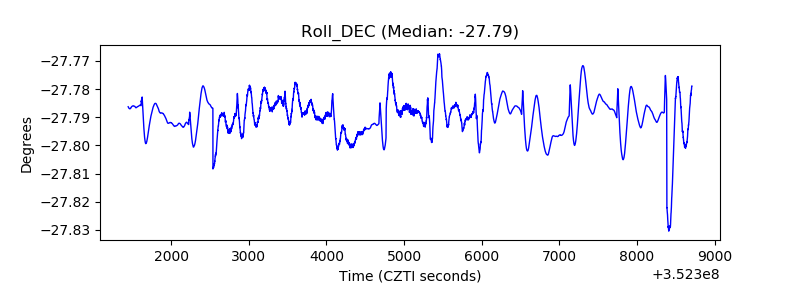 |
| _Roll_RA | 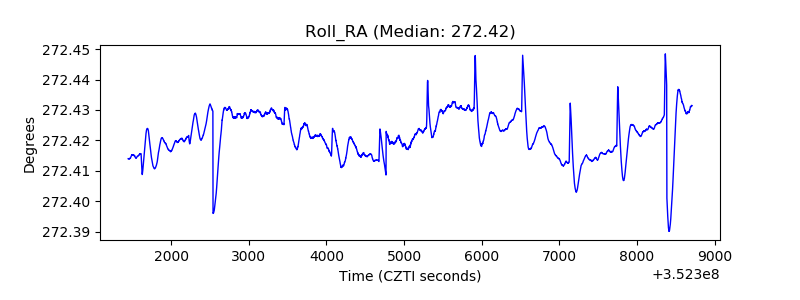 |
| Veto Counter | 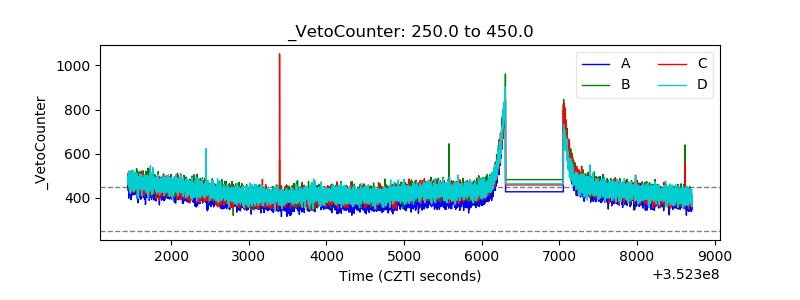 |